
Oil Supply Risks Widen as Washington Eases Pressure on Russia
Crude oil markets went in two different directions with regards to oil supply and fundamentals. Policy changes in Washington may ease restrictions on supply. Attacks on oil supply and other critical infrastructure constrain the physical supply of oil.

WTI: Washington Loosens the Russia Valve
President Trump invoked the Graham Act’s national interest waiver on Friday, suspending the imposition of Section 112 and 113 duties on Russian energy and other products two days before the deadline. Among the suspended provisions are levies of up to 100% on the largest buyers of Russian crude and other energy products. Executive Orders issued before the Act are the basis for the sanctions on Russia that remain in place. A temporary ease on sanctions on the export of Russian diesel was reported earlier this month.
US drilling activity held steady this week. The Baker Hughes rig count was unchanged at 603 as of October 16, with oil rig counts down 3 at 459 and gas up 1 at 133.
Brent: Gulf and Russian Supply Under Fire
The UK Maritime Trade Operations Centre said two tankers were attacked off Saudi Arabia in the Persian Gulf on Friday, with one hit by a rocket-propelled grenade fired from a small boat. Meanwhile, Iran’s Revolutionary Guards said two other tankers, each carrying about 2 million barrels of crude, caught on fire after hitting naval mines in the Strait of Hormuz. The Saudi-led coalition said it intercepted several missiles over the Red Sea on Friday, including one aimed at the oil export hub of Yanbu. Additionally, Ukraine also struck an oil terminal in St. Petersburg on Sunday.
Natural Gas: Mild Weather Outweighs Lean Supply
Lower 48 production has averaged 110.8 bcfd in October so far, below the August and September records of 113.3 bcfd, due to disruptions and issues with pipelines and the Gulf of Mexico. Mild weather is currently limiting natural gas demand, and LSEG expects it to rise to 106.8 bcfd during the next two weeks from 103.87 bcfd this week. LNG feedgas was expected to reach a five-month high of 18.9 bcfd on Friday.
Natural Gas Price Forecast
Every new Natural Gas analysis as it publishes, today's technical signal and key levels, live price — on one page.
See all Natural Gas forecastsNatural Gas Technical Analysis: NG Slips Below $3.09 as $3.03 Support Comes Into Focus
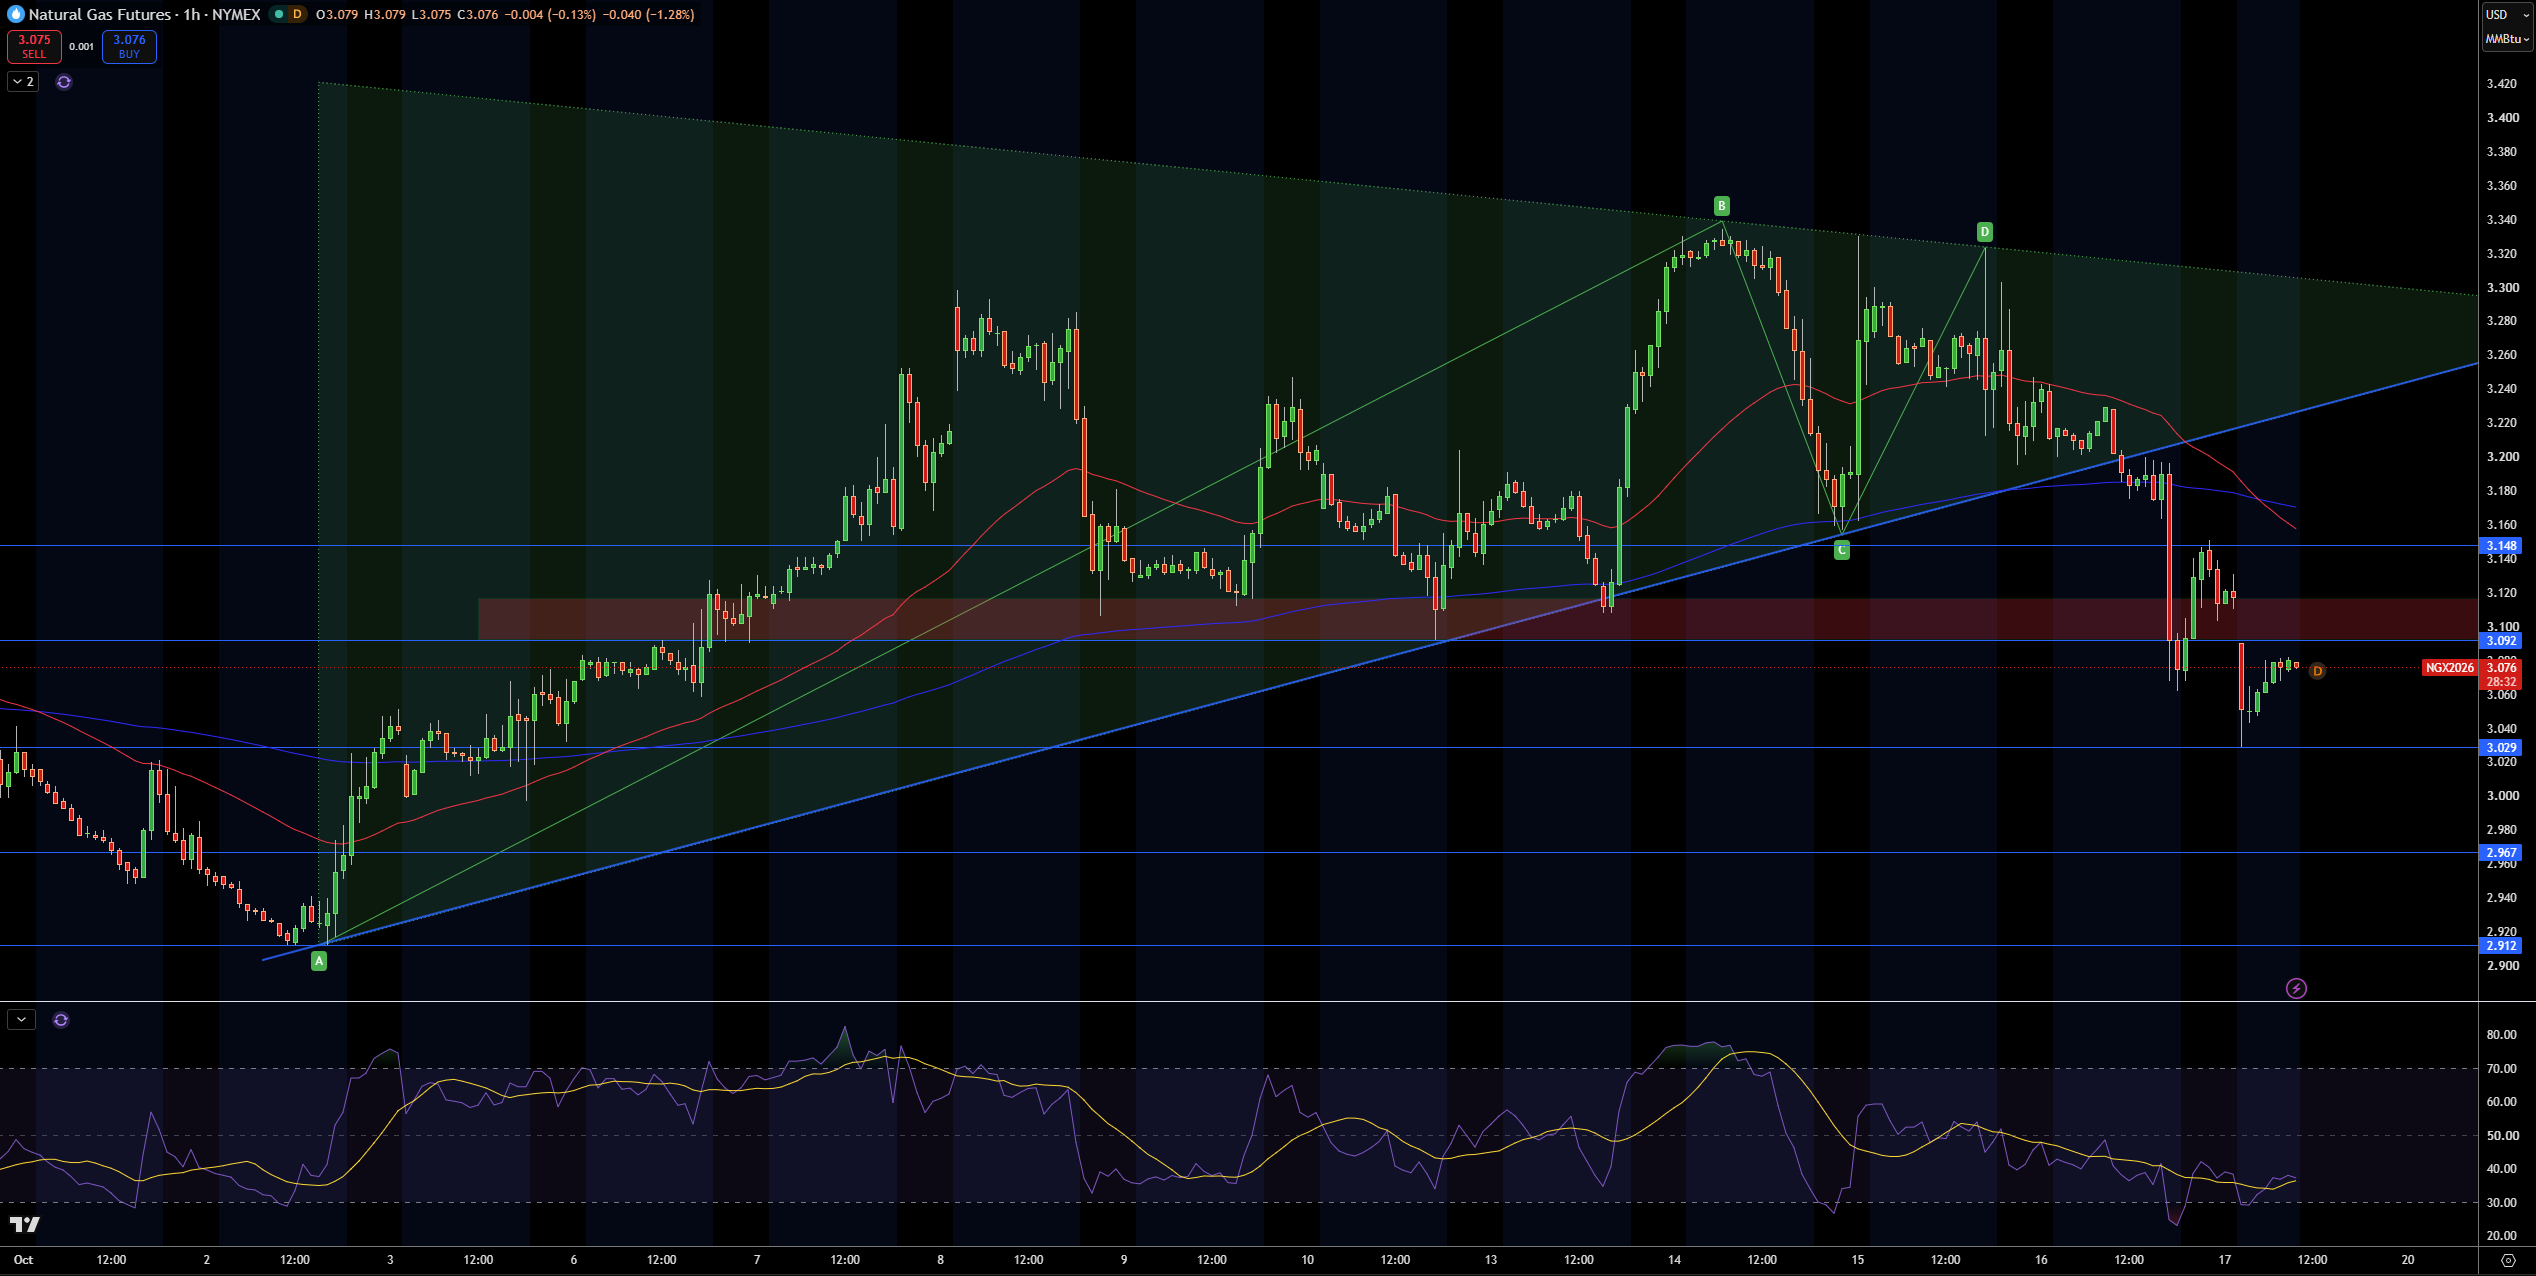
Natural gas is trading at about $3.08/MMBtu. The price has broken and closed below the rising trend line that had been in place since early October, which is bearish. Further, the price has traded below both the 10- and 20-period moving averages. Furthermore, the 10-period moving average is rolling over and crossing below the 20-period moving average, which is also bearish.
Bullish, near term, I would look to defend the price of $3.03, where the latest move lower found buying. Below that, the price of $2.97 and $2.91 would be targeted. These levels correspond to the October lows. From a bullish perspective, I would look for the price to close above the $3.15 level, where sellers were defending the price after the breakdown.
RSI is currently at 37 and has flattened out at its 50-period moving average, which is neutral, but is still bearish. As long as $3.09 continues to cap the upside of natural gas, I would maintain a bearish bias and look for selling opportunities. A move below $3.03 would further strengthen the bear case while a move above $3.15 would negate the bear case.
WTI Technical Analysis: USOIL Holds $97.27 as $98.31 Comes Into Focus
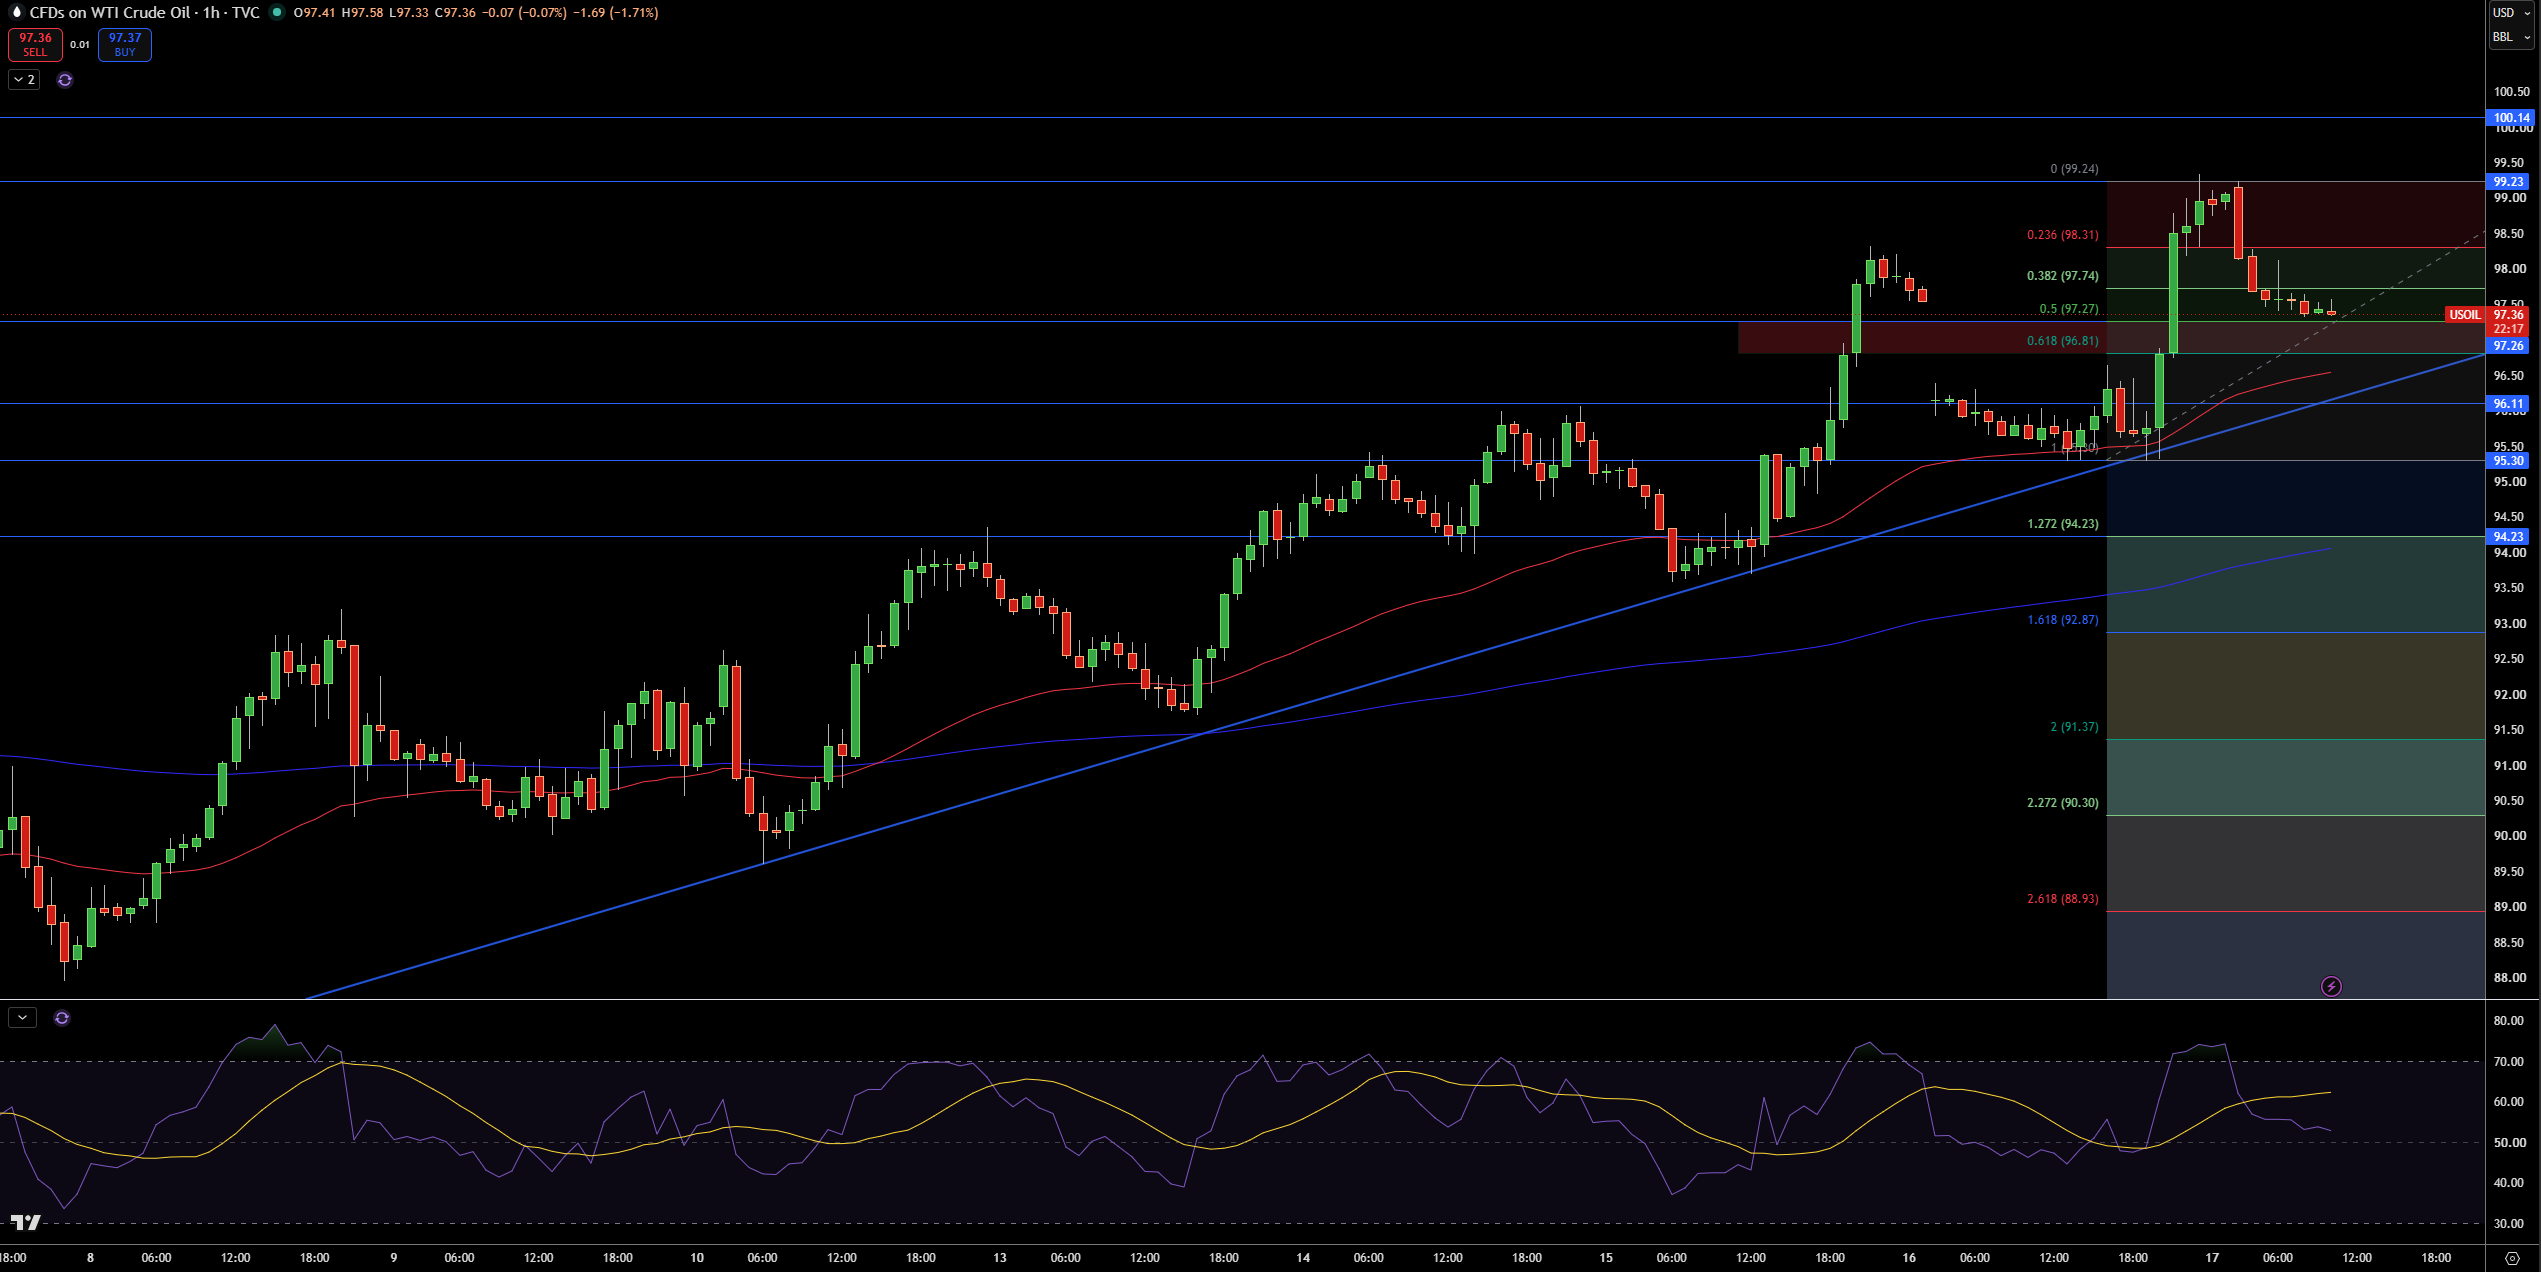
WTI is trading at $97.36 on the 1-hour chart. What I see is the pullback from the high at $99.24 has slowed at the 50% Fibonacci retracement at $97.27. Below that is the $96.81 to $97.26 support zone, which is confluent with the rising trendline. As long as the moving averages are sloping up, and WTI is trading above both of them, the prevailing trend remains up.
In the near-term, the first level of resistance is at $97.74 (the 38.2% level), with the next level at $98.31. A break above that level opens $99.23 and then $100.14. The first level of support is at $96.81 (the 61.8% level) with further support at $96.11 and $95.30.
RSI is at 53 and the trend line is flat, indicating momentum has cooled rather than turned bearish. My bias is slightly bullish for the near-term as long as WTI stays above $96.81. I’d be looking for a close above $98.31 to add further evidence of a bullish continuation. A close below $96.11 would likely break the rising trendline.
Brent Technical Analysis: UKOIL Holds $107.56 as $108.84 Comes Into Focus
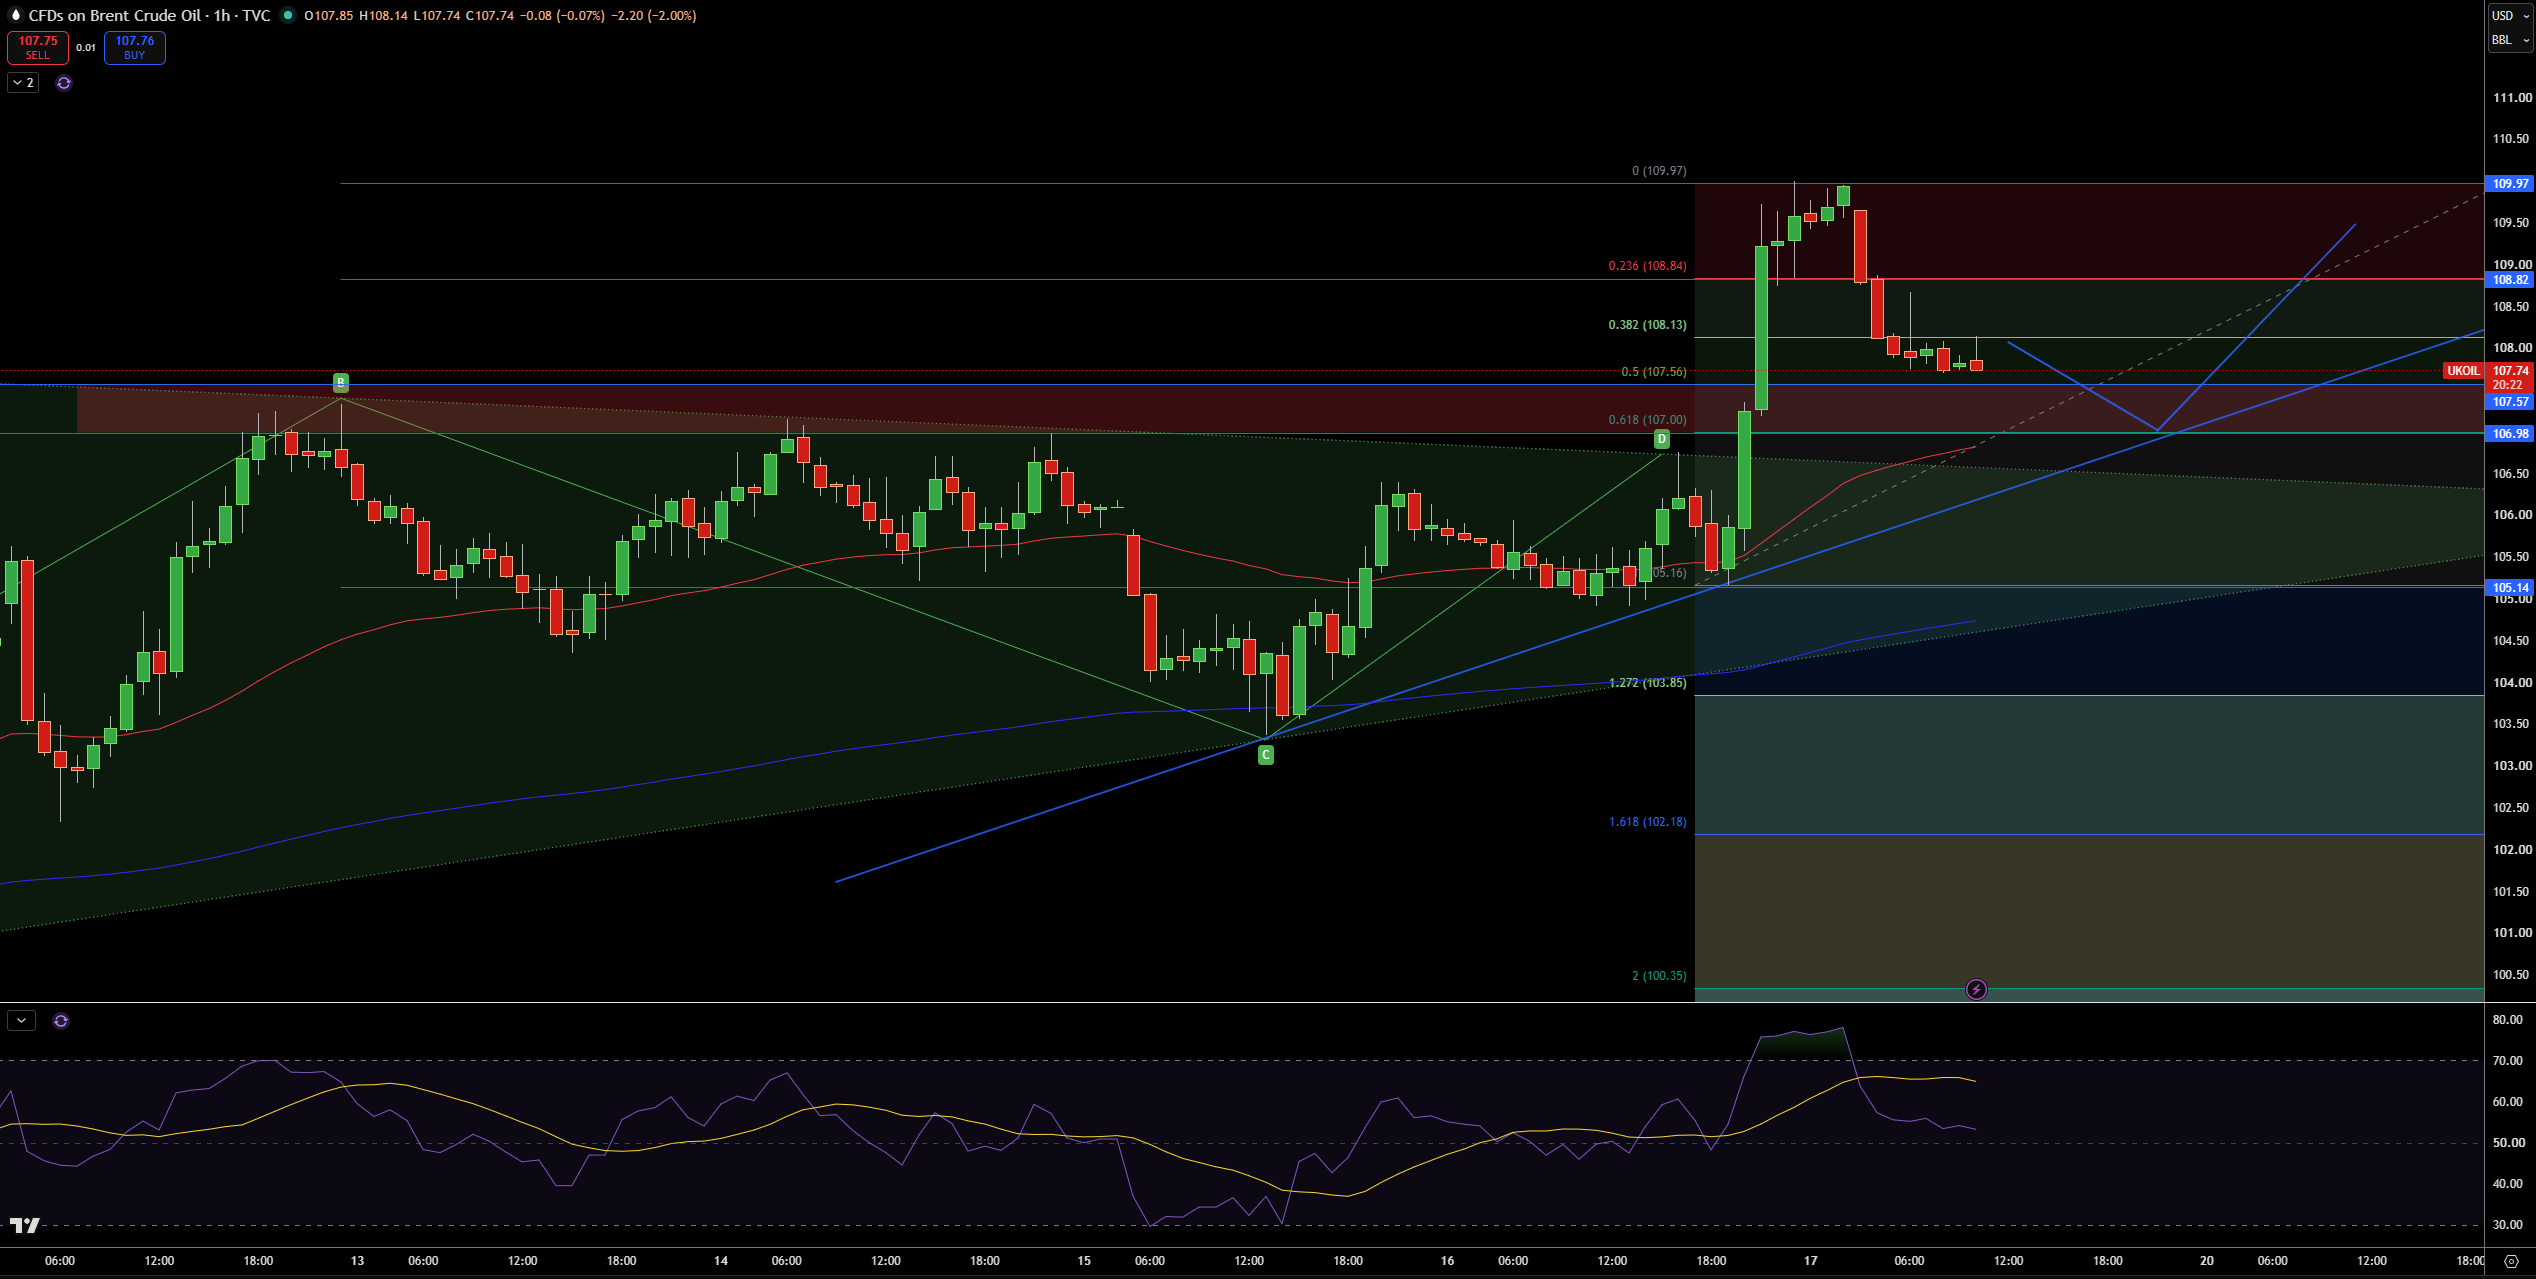
Brent is currently trading at $107.74, according to the 1-hour chart. I’m currently looking at the breakout from the contracting triangle, which propelled the price up to $109.97, before selling pressure set in. The pullback is currently sitting at the $107.56 50% Fibonacci retracement. The rising trendline and the fast moving average are both converging and providing support at the $107.00 area.
In the near term, the first resistance I’m looking at is at $108.13, followed by $108.84. The area between these two levels is the close-above target for the contracting triangle and was previously resistance. A clean break above this area would bring the price up to the $109.97 high. On the other hand, the $107.00 area remains key support, and the projected path of the chart suggests a possible retest of this area before a move higher. $105.14 is the next key support level further down.
RSI is at 53, and is trending down from 71, a potential bearish signal. That said, I am a bit bullish as long as Brent stays above $107.00. A close above $108.84 would confirm the bullish breakout, while a close below $105.14 would invalidate it.