



Oil Sinks to August Lows as Trump Holds Fire on Iran
Crude extended its slide on Tuesday after President Trump signaled restraint on Iran. Brent settled at $92.57 on Monday, its lowest since August 31, after a 16% fall last week that was its steepest weekly drop since the start of the Covid-19 pandemic, Reuters reported. Natural gas moved the other way, rising to a three-week high on colder forecasts.
Brent: Diplomacy Gains Ground, but the Blockade Stays
Trump said on Monday he would hold off on new military strikes against Iran for now, after appeals from regional countries, including Qatar’s prime minister during talks at the White House, Reuters reported. He also said the US naval blockade in the Strait of Hormuz would stay in place for now. “The market continues to prioritise President Trump’s more conciliatory tone toward Iran since the midterms,” said Tim Waterer, chief market analyst at KCM Trade.
The talks remain fragile. Secretary of State Marco Rubio described some of Iran’s demands as “outrageous and ridiculous and really not realistic.” Iran’s foreign ministry spokesman Esmaeil Baghaei said on November 2 that Hormuz could reopen within two days if the US accepted Tehran’s conditions, which include an end to the war on all fronts. Both countries also reported ships hit in or near the strait. Those incidents did not lift prices; Waterer said attacks on shipping have not escalated enough to add a fresh risk premium, the extra price traders pay for the chance of a supply disruption.
WTI: Physical Supply Is Loosening
More oil is finding a way out of the Gulf. Iraq reached understandings with Washington to export oil through Hormuz along a shipping lane near Oman, Foreign Minister Fuad Hussein told Al Jazeera on November 8. OPEC output rose 1.38mn barrels per day in October to 22.87mn bpd, a Reuters survey found, and JPMorgan estimated the global surplus at about 1.4mn bpd that month.
The physical market is softening as well. Morgan Stanley said Dated Brent, the benchmark price for physical North Sea cargoes, has slipped to a discount to nearby Brent futures, a sign that buyers no longer need barrels urgently. With more supply moving and less urgency to buy, the war premium in WTI keeps fading.
Natural Gas Price Forecast
Every new Natural Gas analysis as it publishes, today's technical signal and key levels, live price — on one page.
See all Natural Gas forecastsNatural Gas: Cold Arrives, LNG Breaks Records
December natural gas futures rose 5.4% to $3.16/MMBtu, or per million British thermal units, on Monday, a three-week high, on colder forecasts and lower output, Reuters reported. LSEG said Lower 48 output slipped to 112.1bn cubic feet per day (bcfd) so far in November from 113.4bn in October. It expects demand, including exports, to rise from 114.7 bcfd this week to 120 bcfd next week.
Exports are adding to the pull. Feedgas to the nine big US LNG plants, the gas that is cooled into liquid for shipping abroad, averaged a record 19.3 bcfd so far in November, above October’s record of 18.4 bcfd. Analysts estimate storage was about 2.1% above normal in the week ended November 6, up from 1.4% a week earlier. The EIA’s next storage report is due on November 13, and the key test is whether colder weather starts to shrink that surplus.
WTI Crude Oil Technical Analysis: Oil Tests $85.03 Support After Channel Breakdown
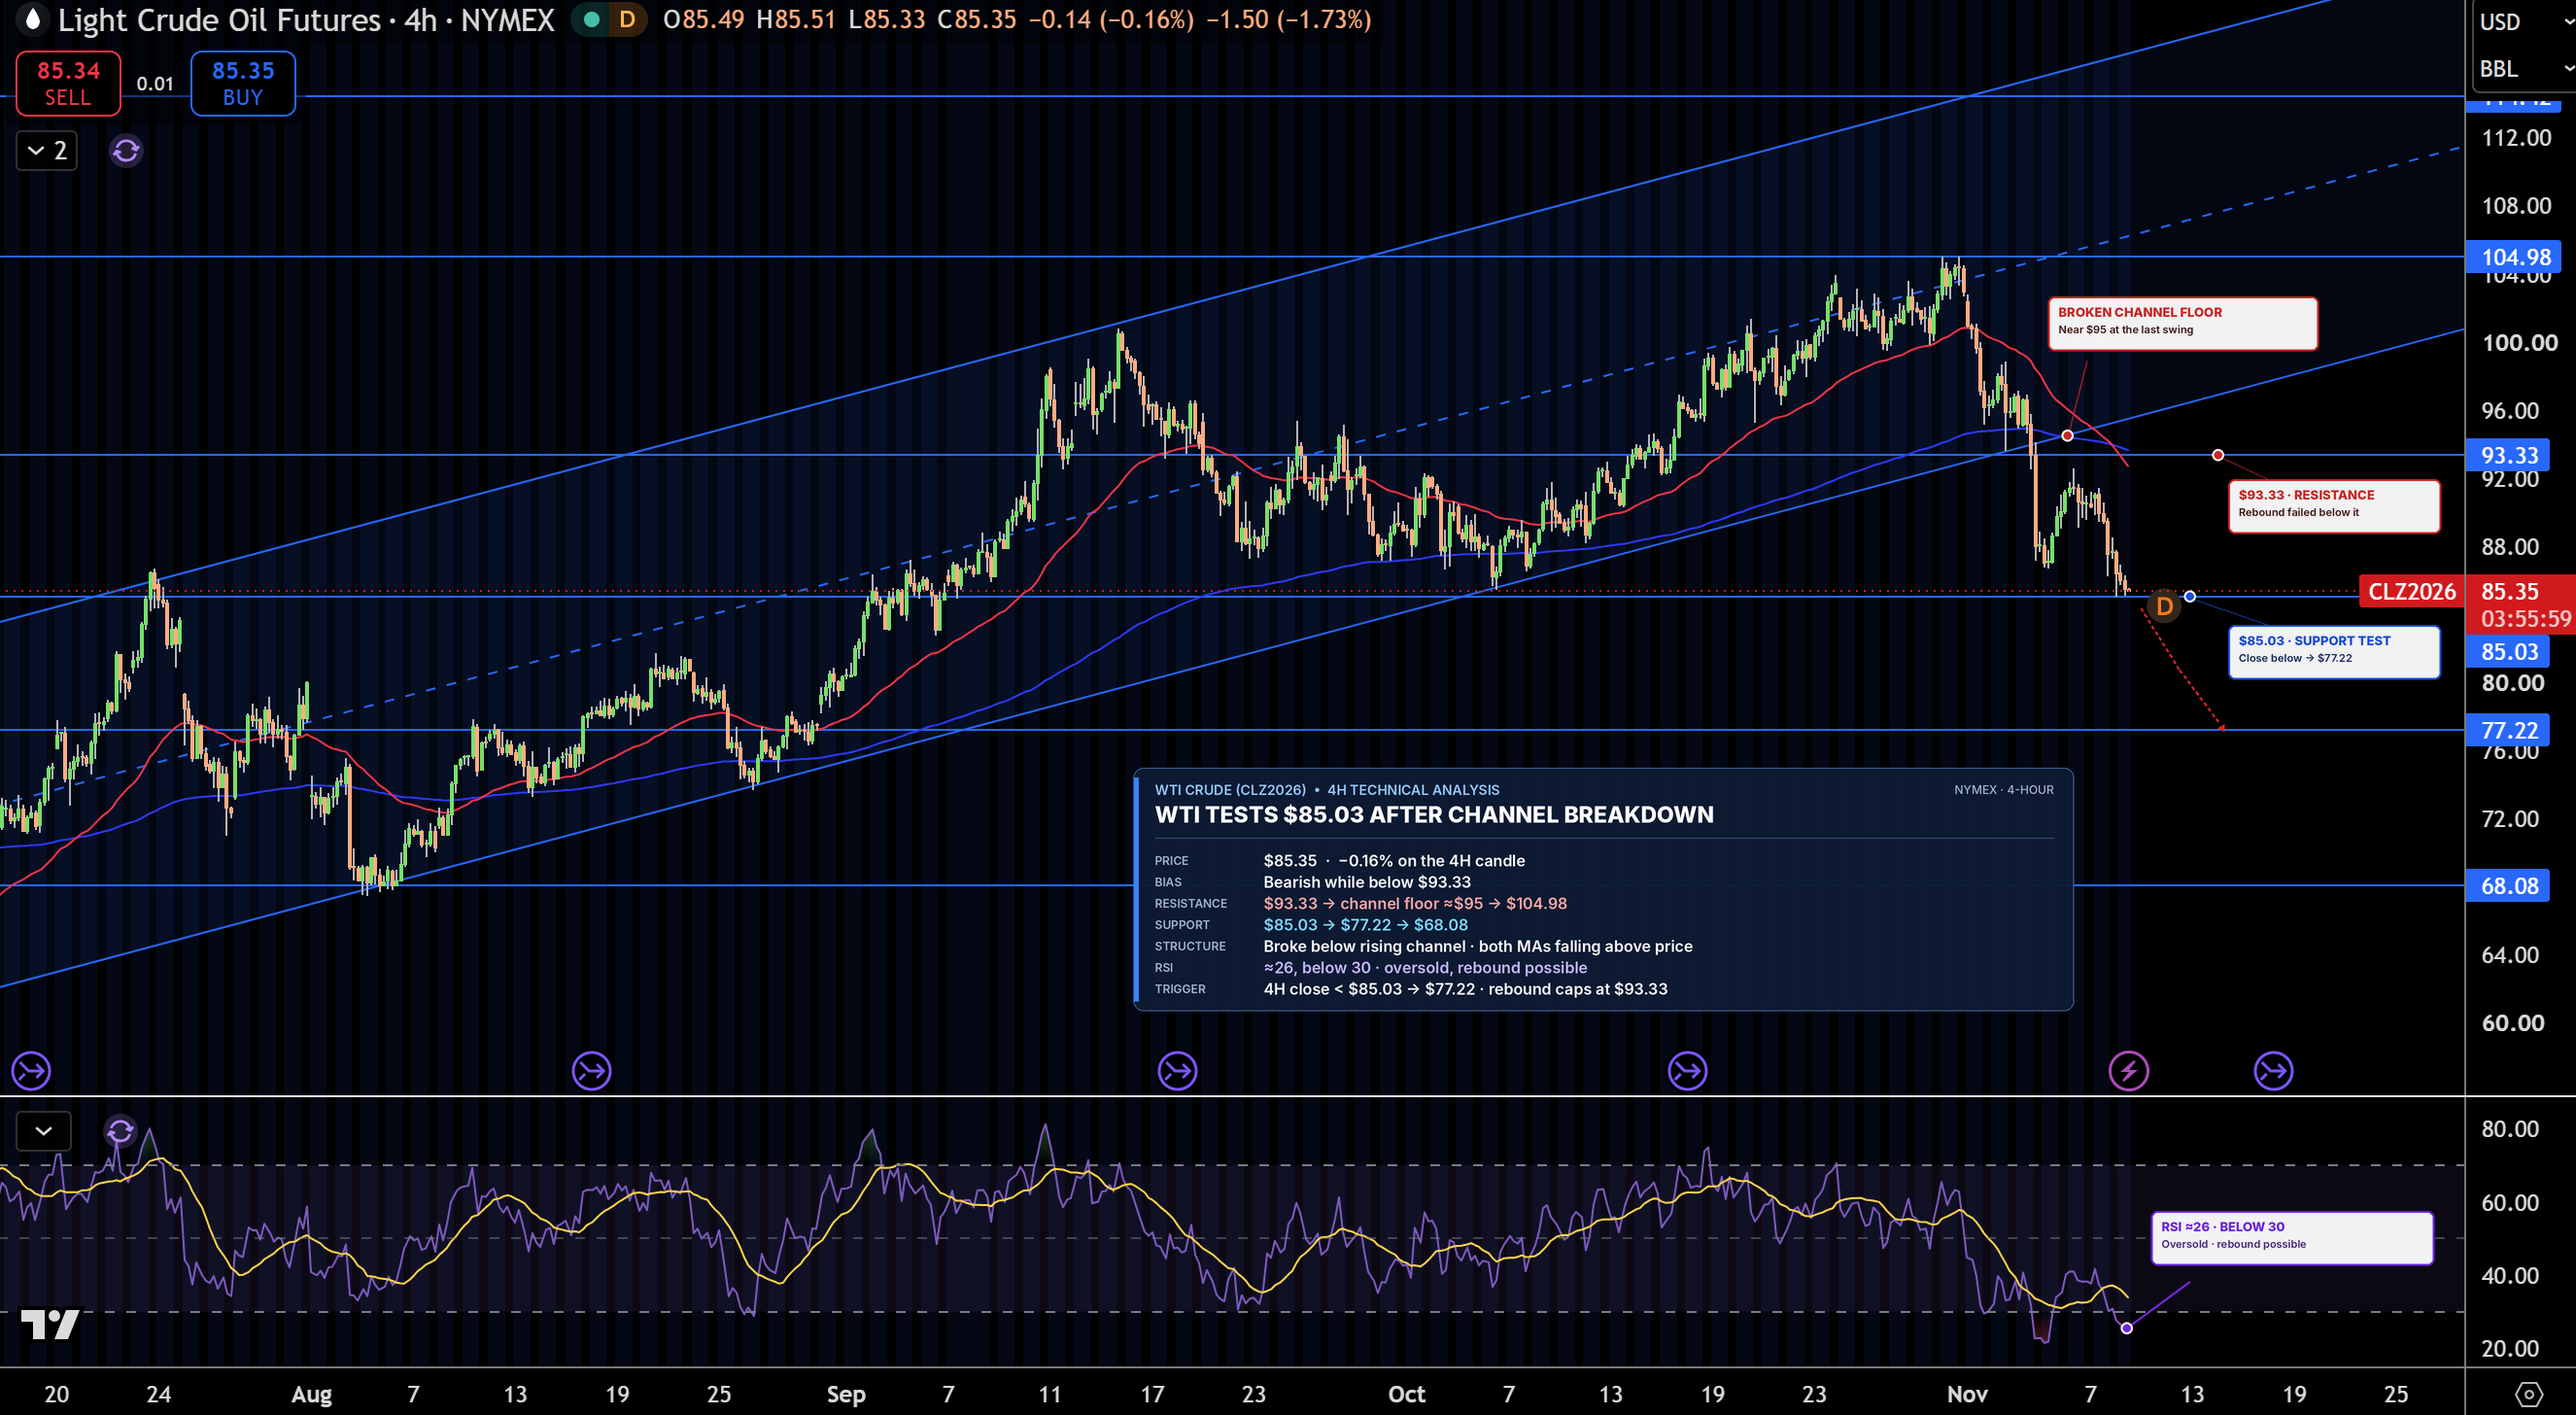
WTI is trading near $85.35 on the 4-hour chart after breaking below its rising channel, the parallel lines that had guided prices higher since July. A rebound toward $92 failed, and prices are now testing $85.03. Both moving averages, which track average prices over time, are falling above price.
Support, where buyers may step in, is $85.03, then $77.22. Resistance, where sellers may return, is $93.33, then the broken channel floor near $95. RSI, a 0 to 100 gauge of buying and selling strength, is near 26, in oversold territory, meaning prices fell very fast, so a short bounce is possible. My bias stays bearish while WTI holds below $93.33. A close below $85.03 would open $77.22.
Brent Crude Oil Technical Analysis: Oil Breaks Below $93.28 as $84.28 Comes Into Focus
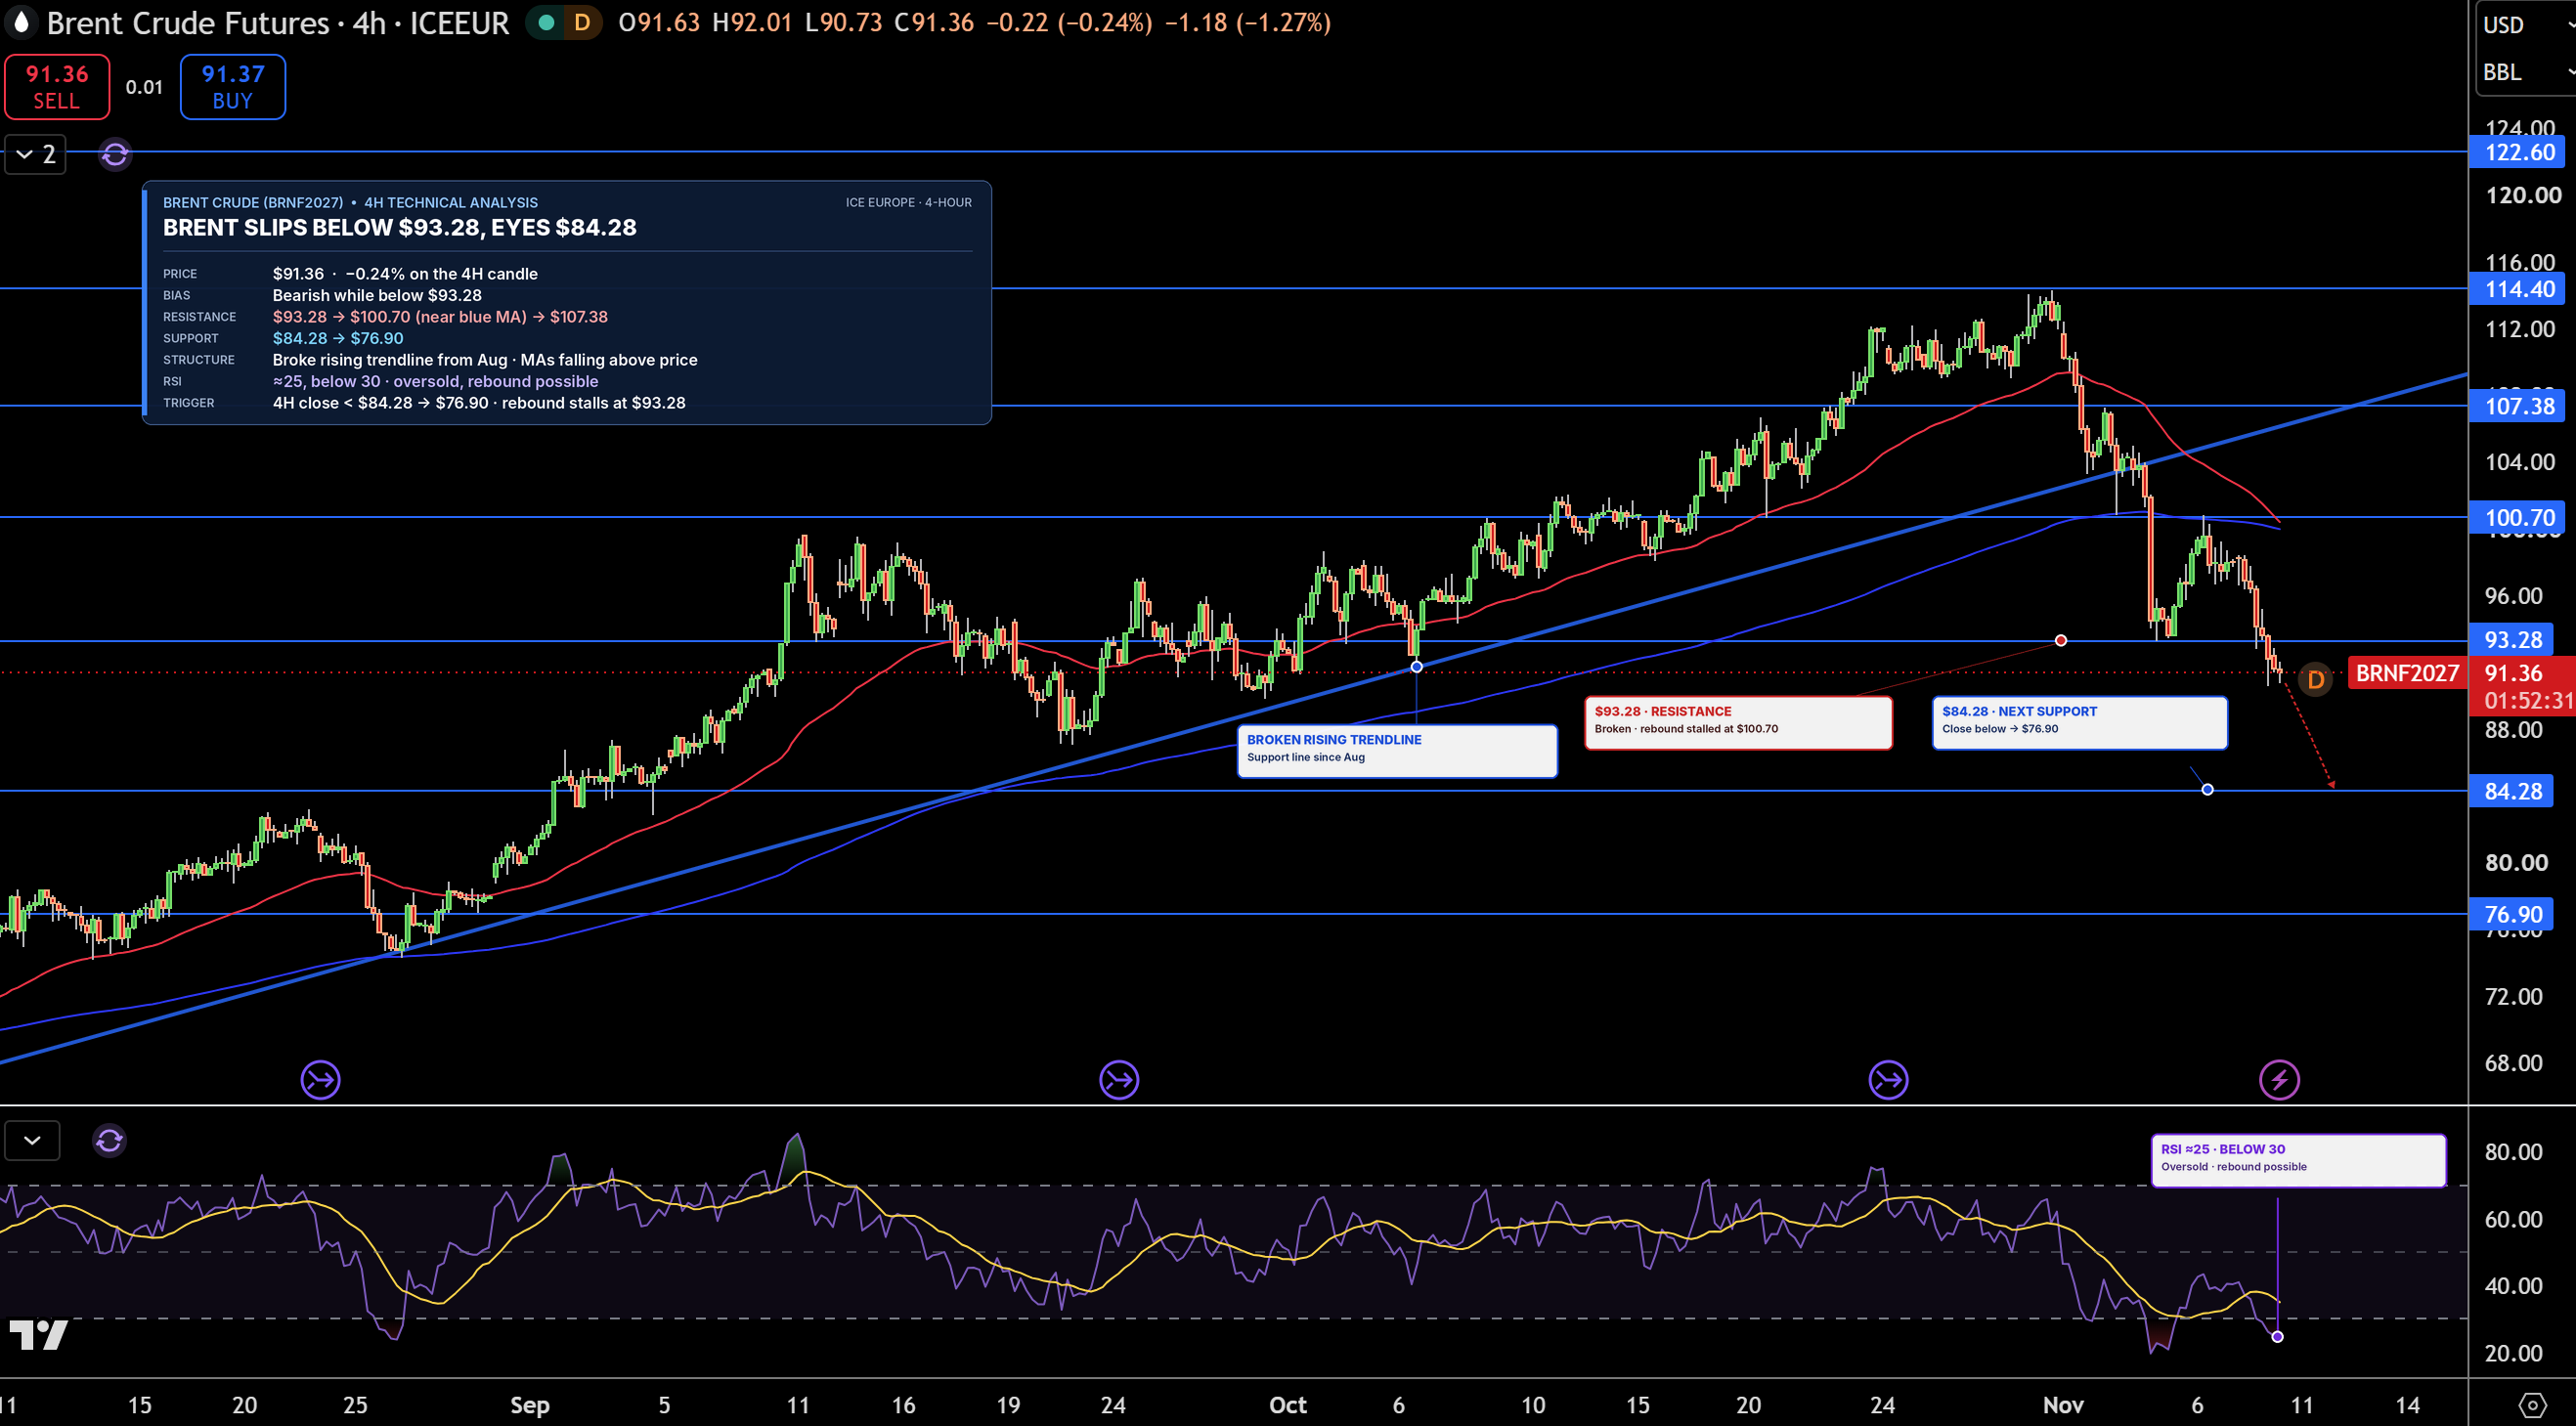
January Brent futures are trading near $91.36 on the 4-hour chart after breaking below the rising trendline, a line connecting higher lows since August. A rebound stalled at $100.70, near the slower moving average, and prices have since slipped below $93.28.
Support is $84.28, then $76.90. Resistance is $93.28, now a ceiling after the break, then $100.70. RSI is near 25, even deeper in oversold territory than WTI. I lean bearish while Brent stays below $93.28, even if a relief bounce toward that level comes first. A close below $84.28 would open $76.90.
Natural Gas Technical Analysis: NG Breaks Above $3.19 Pivot as $3.34 Comes Into Focus
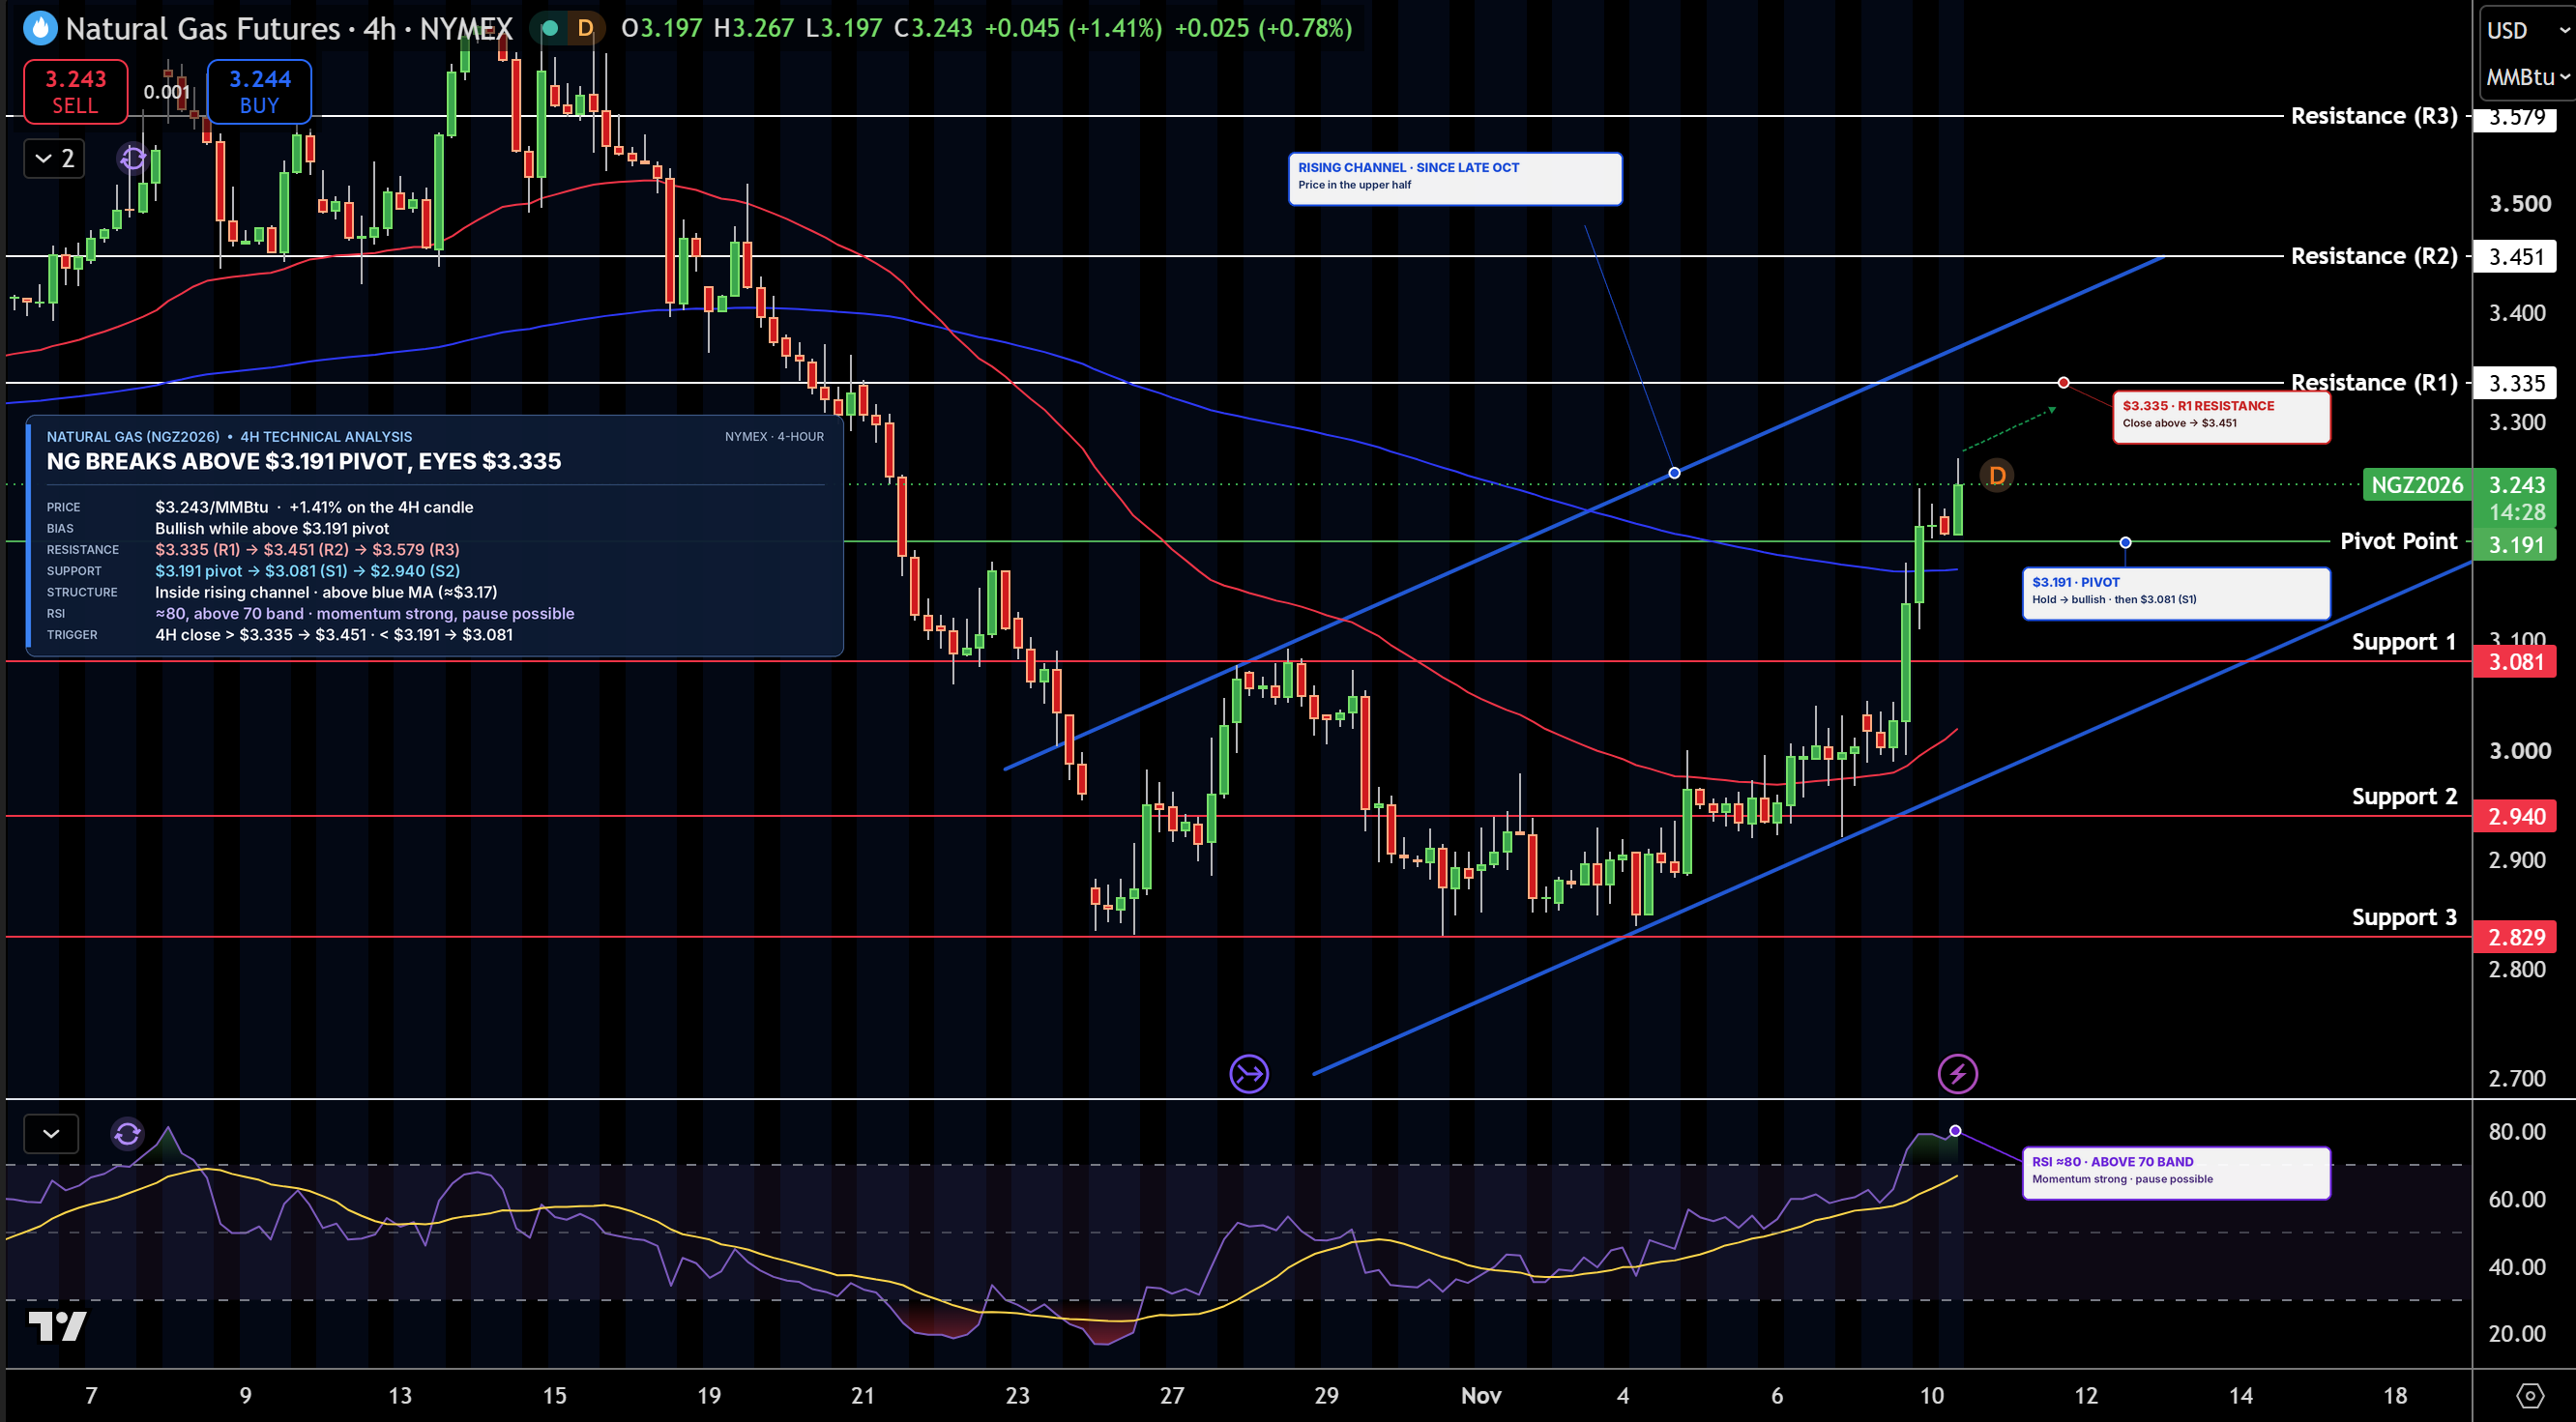
Natural gas is trading near $3.24/MMBtu on the 4-hour chart, climbing inside a rising channel that has guided prices since late October. Prices have pushed above $3.19, the pivot point, a level calculated from the previous period’s high, low and close that traders use to judge direction, and above the slower moving average.
Resistance is $3.34, then $3.45. Support is $3.19, then $3.08. RSI is near 80, which is overbought, meaning prices rose very fast, so a pause would not surprise me. The bias stays bullish while gas holds $3.19, and a close above $3.34 would open $3.45.