



Oil Heads for Second Weekly Drop as Trump Sticks With Iran Blockade
Crude was mixed on Friday but set for a second straight weekly decline after President Trump signaled the US will keep its blockade on Iran in place, Reuters reported. Brent was little changed at $95.41 and WTI slipped 0.25% to $88.52 at 02:42 GMT, while a surprise build in US crude stocks added to the pressure.
Brent: Blockade Over Bombs
Trump said on Truth Social that a deal with Iran was not necessary to end the war, signaling that the US will keep its blockade on oil shipments along with trade and economic sanctions. Reuters said that reduces the chance of renewed large-scale fighting, though attacks on shipping remain a risk. In my view, that means less of a risk premium for oil, the extra price traders pay for the chance of a supply disruption.
The attacks have not stopped. On Thursday, the Houthis said they attacked a pumping station on Saudi Arabia’s East-West pipeline, a facility in Yanbu and an Aramco building in Riyadh. Iran’s military said four tankers were hit by explosions in the Strait of Hormuz after ignoring warnings, though Reuters could not verify the claim. “I think the oil market is priced to perfection at this point,” said Chris Brankin, global advisor at Melbourne-based brokerage MiTrade.
WTI: Stocks Build Against Expectations
US crude stocks rose 4.7mn barrels to 414.4mn in the week ended November 6, the EIA’s Weekly Petroleum Status Report showed, against expectations in a Reuters poll for a 1.1mn-barrel draw. The EIA attributed the rise in crude and fuel stocks to softer demand for refined products and a jump in oil imports, Reuters reported. Net crude imports rose by 544,000 barrels per day.
Fuel stocks rose too. Gasoline inventories climbed 1.8mn barrels and distillates, which include diesel and heating oil, rose 4.1mn barrels, though distillates remain 8% below the five-year average. Refinery utilization rose 0.7 percentage point. In my view, builds across crude and fuels are a near-term headwind for WTI.
Natural Gas Price Forecast
Every new Natural Gas analysis as it publishes, today's technical signal and key levels, live price — on one page.
See all Natural Gas forecastsNatural Gas: Short Squeeze Meets a Brief Chill
December natural gas futures were up 2% at $3.353/MMBtu, or per million British thermal units, during Wednesday’s session, Reuters reported. Analysts said some of the week’s gain came from short-covering, when traders who bet on falling prices buy back contracts, after speculators lifted their net short position to the highest level since March 2020 the week before, according to CFTC data.
Futures rebounded early Thursday after Wednesday’s sharp reversal, supported by colder forecasts and declining production, NGI reported, though the prospect of renewed warmth later in November raised questions about whether the gains could last. LSEG said Lower 48 output has fallen to 112.3bn cubic feet per day so far in November, while flows to LNG export plants stayed near record levels. The EIA’s storage report, delayed by the Veterans Day holiday, arrives on Friday, November 13.
Brent Crude Oil Technical Analysis: Oil Breaks Out of Falling Channel as $98.75 Comes Into Focus
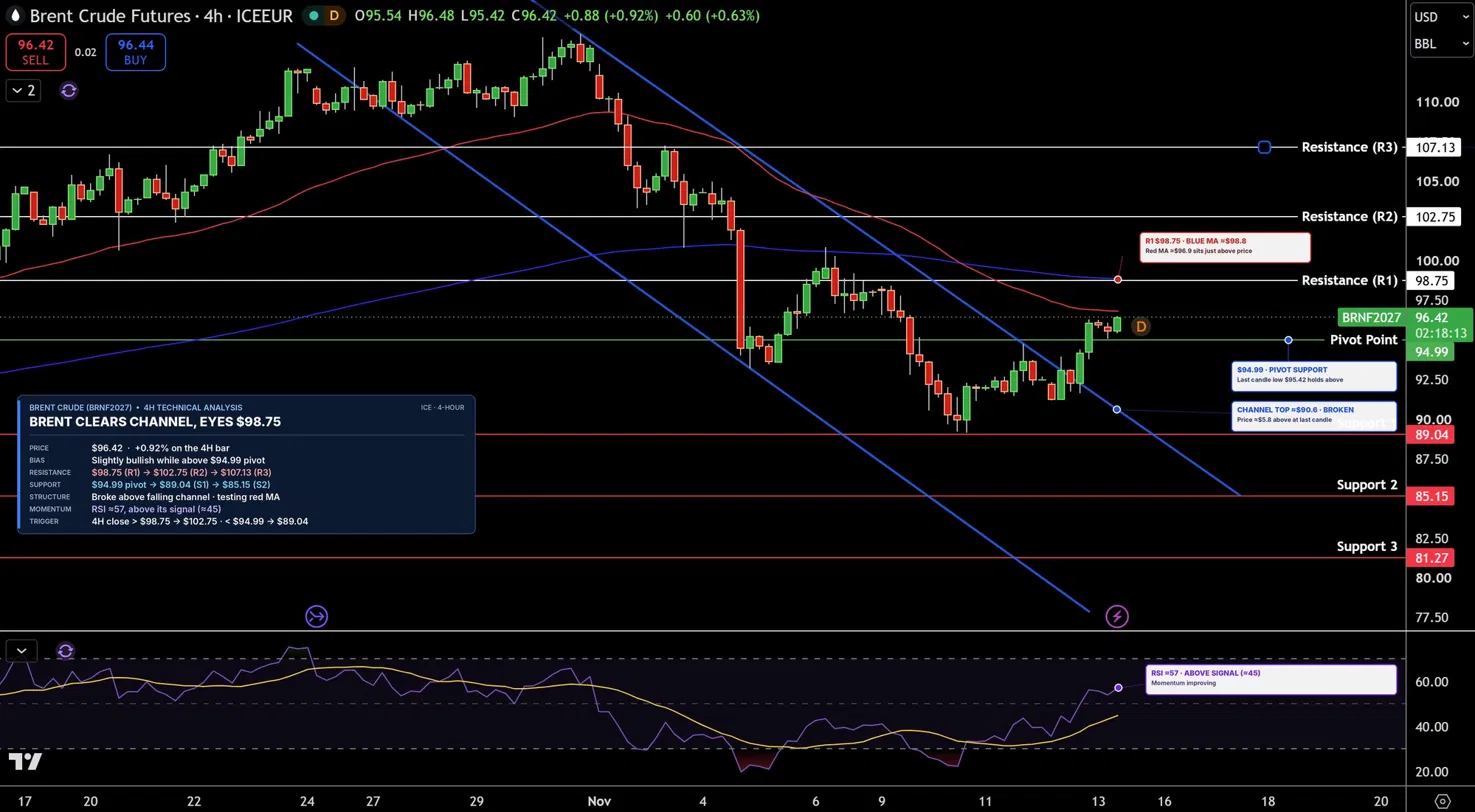
January Brent futures are trading near $96.42 on the 4-hour chart after breaking above the falling channel, two parallel lines that had guided prices lower since late October. Brent has also climbed above $94.99, the pivot point, a level calculated from the previous period’s high, low and close that traders use to judge direction, and is now testing the faster moving average, which tracks the recent average price.
Resistance, where sellers may return, is $98.75, then $102.75. Support, where buyers may step in, is $94.99, then $89.04. RSI, a 0 to 100 gauge of buying and selling strength, is near 57 and above its signal line, a slower average of RSI, so buyers have the edge. I lean slightly bullish while Brent holds $94.99. A close above $98.75 would open $102.75.
Natural Gas Technical Analysis: NG Stalls Below $3.40 Inside Rising Channel
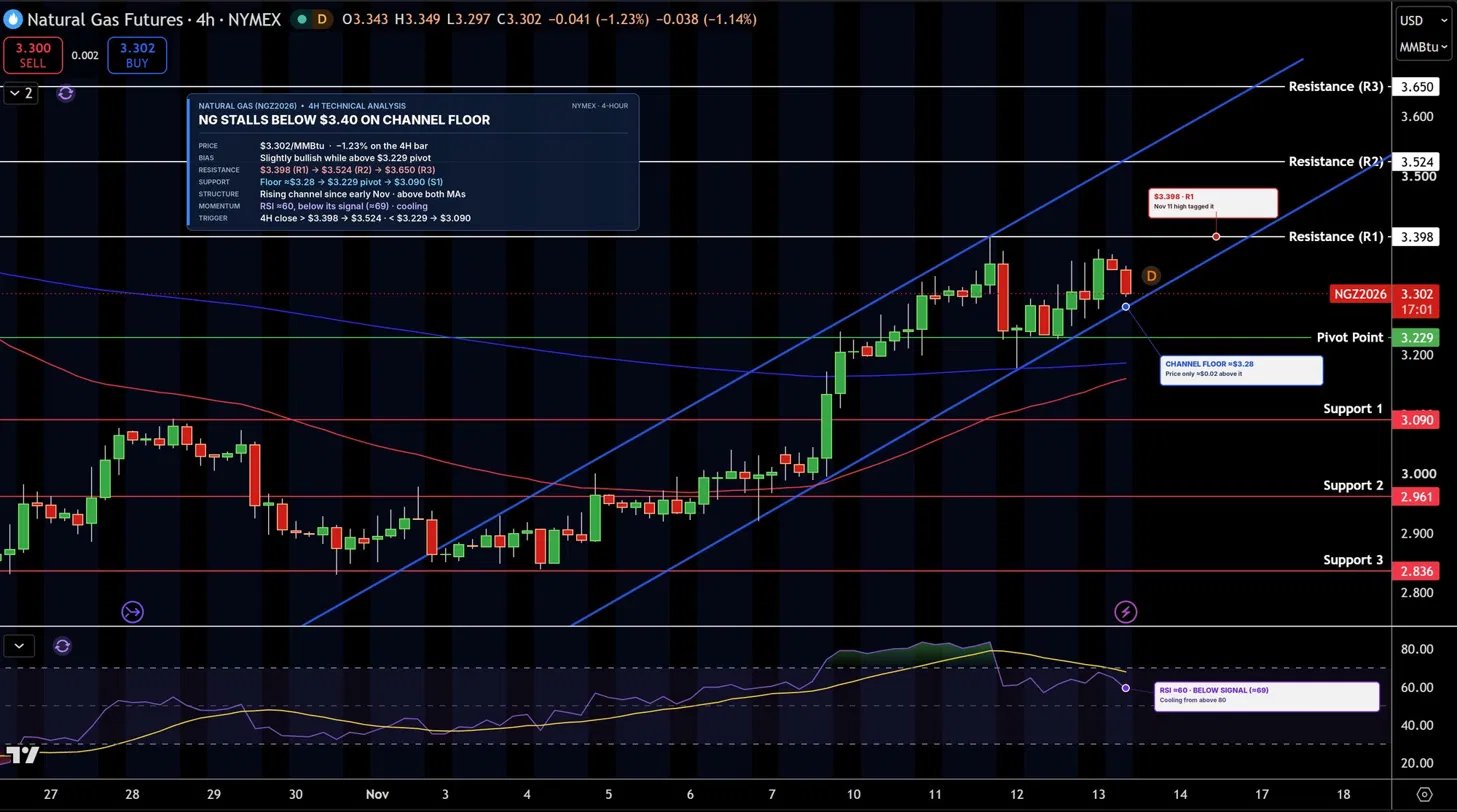
December natural gas is trading near $3.30/MMBtu on the 4-hour chart, still inside a rising channel from early November. Sellers have stopped rallies just below $3.40 twice this week, so that level is becoming a firm ceiling. Gas remains above its $3.23 pivot and both moving averages.
Resistance is $3.40, then $3.52. Support is $3.23, then $3.09. RSI is near 60 but below its signal line, so momentum is cooling. The bias is a slight bullish lean while gas holds $3.23, and a close above $3.40 would open $3.52.
WTI Crude Oil Technical Analysis: Oil Bounces From $85.22 but Stays Below $92.53
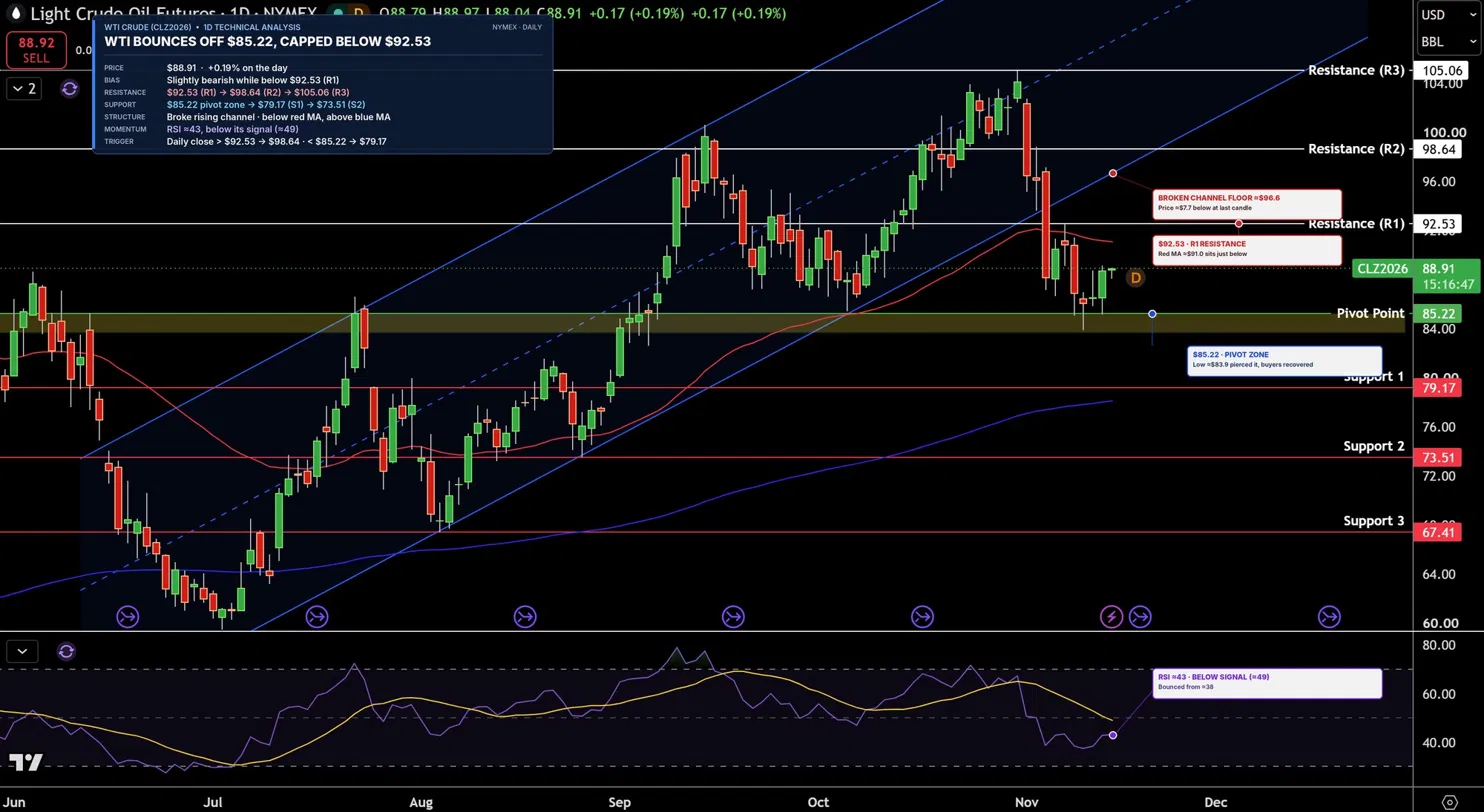
December WTI is trading near $88.91 on the daily chart after dipping to about $83.90 and recovering above the $85.22 pivot zone. Oil is still below its broken rising channel, though, and below the faster moving average, while holding above the slower one.
Resistance is $92.53, then $98.64. Support is $85.22, then $79.17. RSI is near 43 and below its signal line. In my view, WTI keeps a slight bearish lean while it stays below $92.53. A close above that level would favor buyers, while a drop below $85.22 would open $79.17.