



Brent: Escalation Returns
Both benchmarks settled higher on Tuesday after the US and Iran traded strikes. Iranian drones attacked a US military radar system in Bahrain, and the US responded by striking a missile launch site on Iran’s Qeshm Island, even as talks continued between Iran and mediators Oman and Qatar. On Wednesday, Bahrain’s defense force said it intercepted Iranian aerial attacks on the country, which hosts the US Navy’s Fifth Fleet.
Shipping and pipeline risks also persist. An LPG tanker was struck by a projectile in the Strait of Hormuz off Oman on Monday, forcing its crew to evacuate, and Yemen’s Houthis said they launched five drones at two pumping stations on Saudi Arabia’s East-West pipeline, which carries crude to Yanbu to bypass Hormuz. LSEG analysts said vessel data suggests “normalization of flows through Hormuz is still not possible under current conditions.” In my view, this escalation is the main reason Brent has not followed last week’s IEA surplus forecast lower in a straight line.
WTI: Inventories Swell
US crude stocks rose by 5.28mn barrels in the week ended November 13, market sources said, citing American Petroleum Institute figures. Gasoline inventories jumped by 5.12mn barrels and distillates, which include diesel and heating oil, rose by 351,000 barrels. In my view, builds that large point to softer near-term demand for WTI.
The EIA’s official figures in the Weekly Petroleum Status Report are due later on Wednesday and will show whether the build is confirmed. December WTI futures expire on Friday, November 20, so the WTI chart below tracks the January contract.
Natural Gas Price Forecast
Every new Natural Gas analysis as it publishes, today's technical signal and key levels, live price — on one page.
See all Natural Gas forecastsNatural Gas: Mild Weather Meets Heavy Shorts
December natural gas futures fell to $3.08/MMBtu, or per million British thermal units, on Tuesday morning, their lowest since November 9, as forecasts turned milder, Reuters said. LSEG’s two-week heating degree day forecast, a measure of expected heating demand, dropped to 216 from 275 a day earlier, and the firm expects demand, including exports, to ease from 122.9bn cubic feet per day (bcfd) this week to 119.6 bcfd next week.
Futures later bounced off that one-week low to settle higher, Reuters reported. Speculators added 7,962 contracts to their net short position in the week to November 10, taking it to 227,227, according to CFTC data. In my view, that leaves room for short-covering if the weather turns colder. Commerzbank said lower US demand would mainly push US storage higher, offering Europe only limited relief. Analysts estimate storage likely climbed to 2.4% above normal in the week ended November 13, ahead of Thursday’s EIA storage report.
Brent Crude Oil Technical Analysis: Oil Stays Below $94.18 as $91.27 Support Comes Into Focus
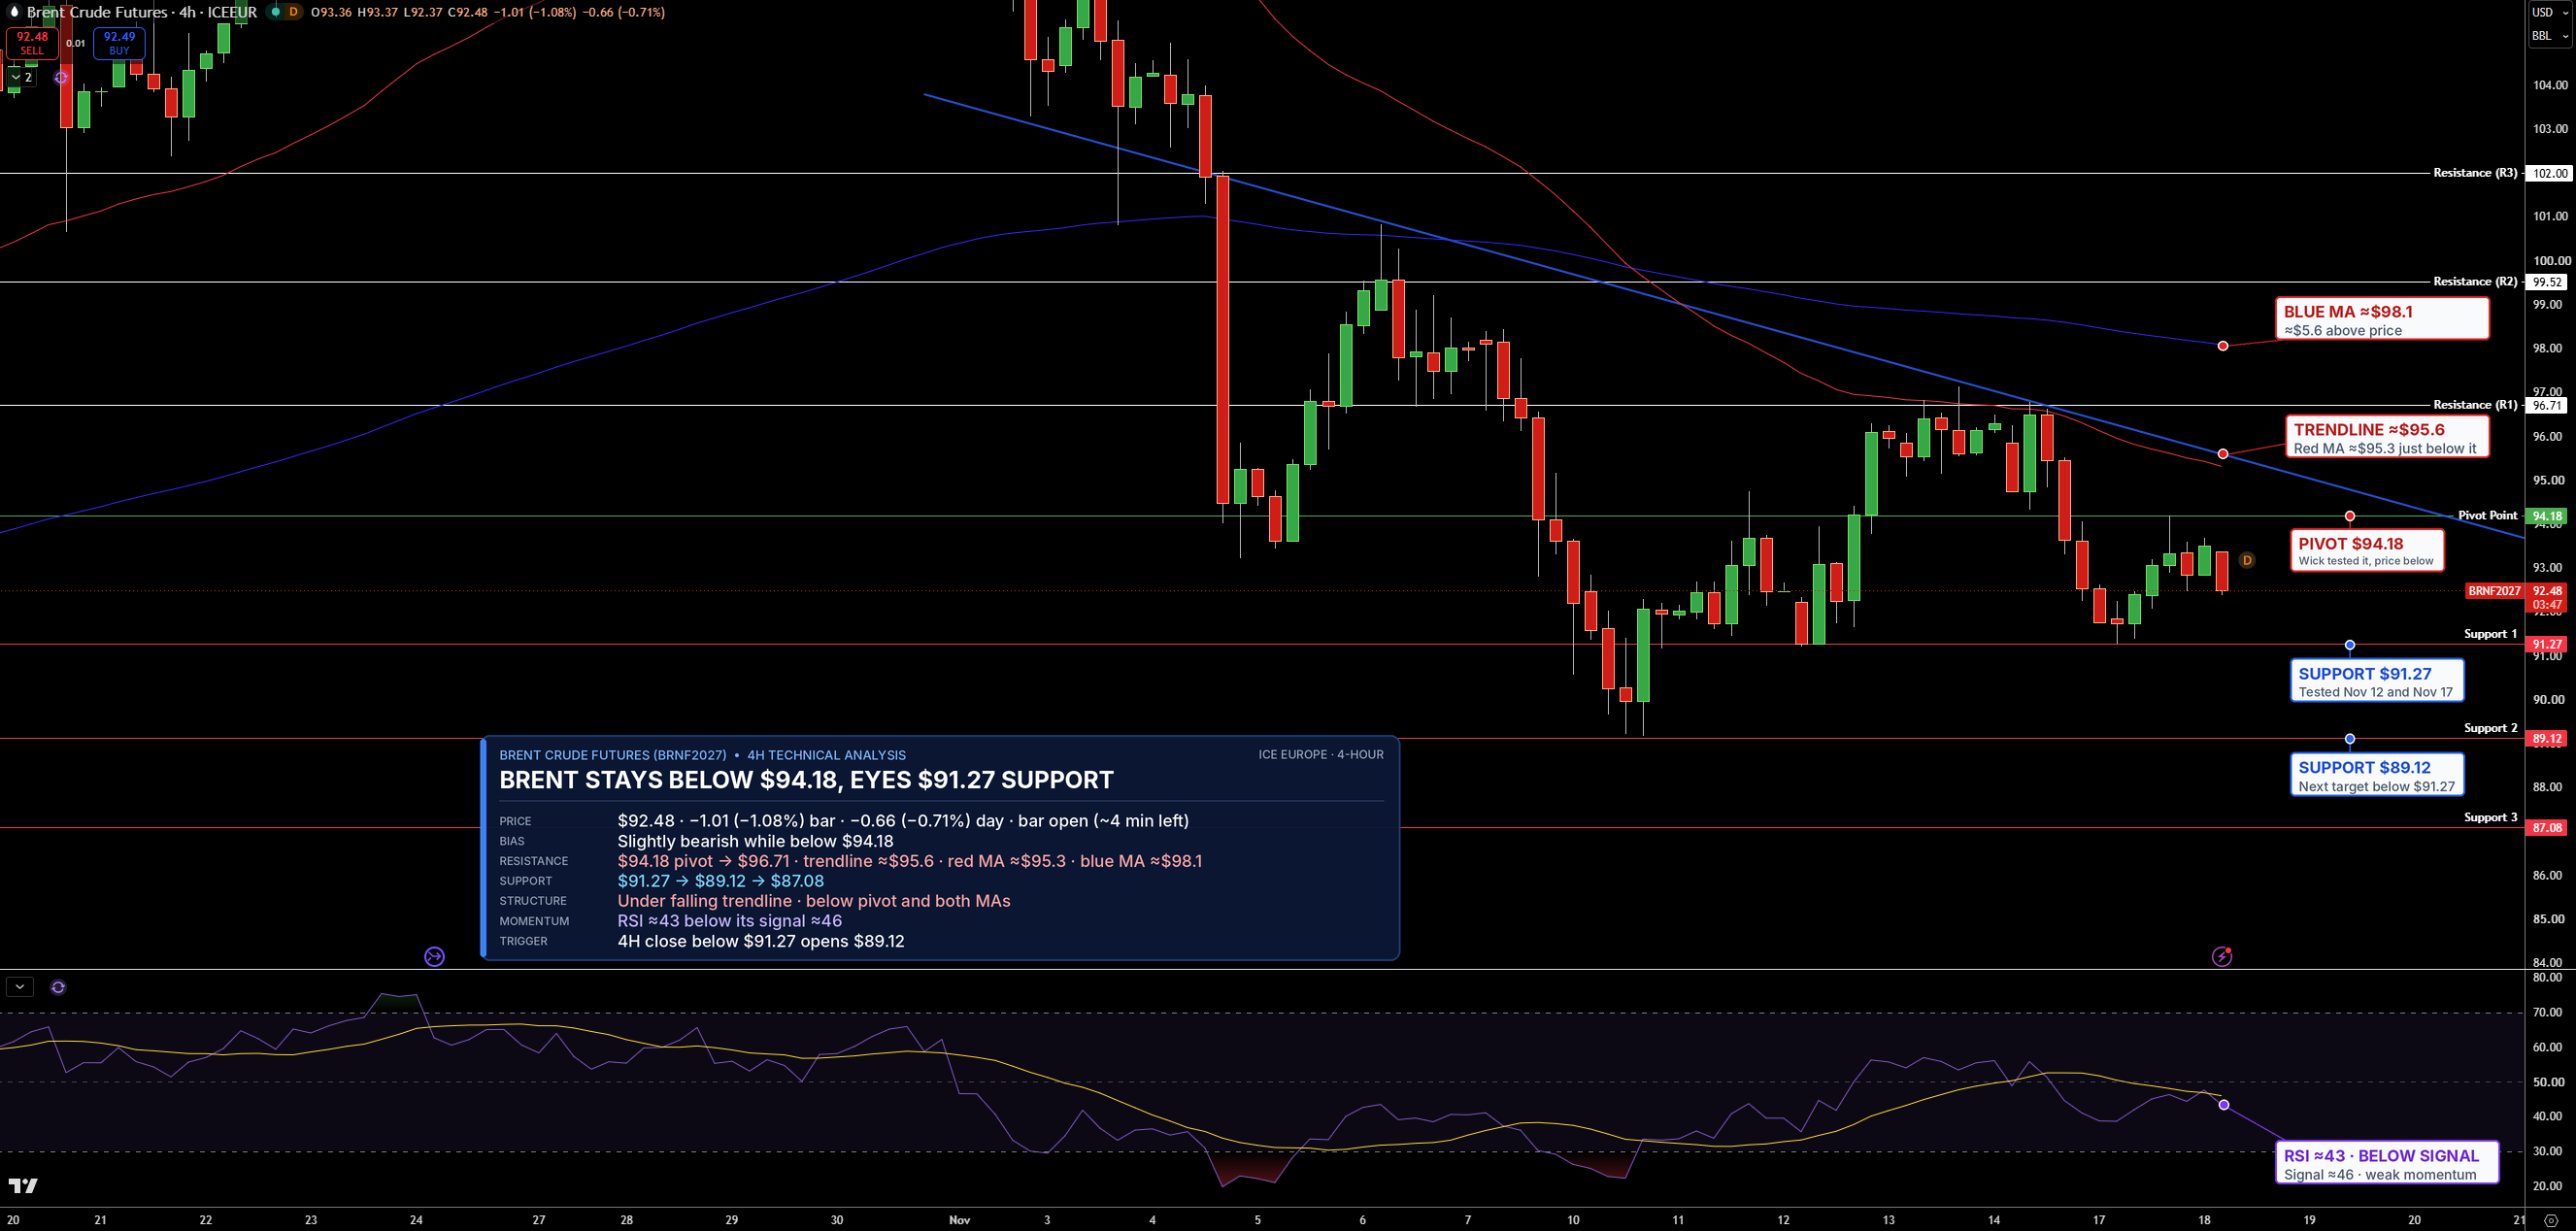
January Brent futures are trading near $92.48 on the 4-hour chart. A bounce from $91.27 this week stalled below $94.18, the pivot point, a level calculated from the previous period’s high, low and close that traders use to judge direction. Brent remains under a falling trendline, a line connecting lower highs since early November, and below both moving averages, which track average prices over time.
Support, where buyers may step in, is $91.27, then $89.12. Resistance, where sellers may return, is $94.18, then $96.71. RSI, a 0 to 100 gauge of buying and selling strength, is near 43 and below its signal line, a slower average of RSI. I lean slightly bearish while Brent stays below $94.18. A close below $91.27 would open $89.12.
Natural Gas Technical Analysis: NG Rejected at $3.21 Pivot as Trendline Support Holds
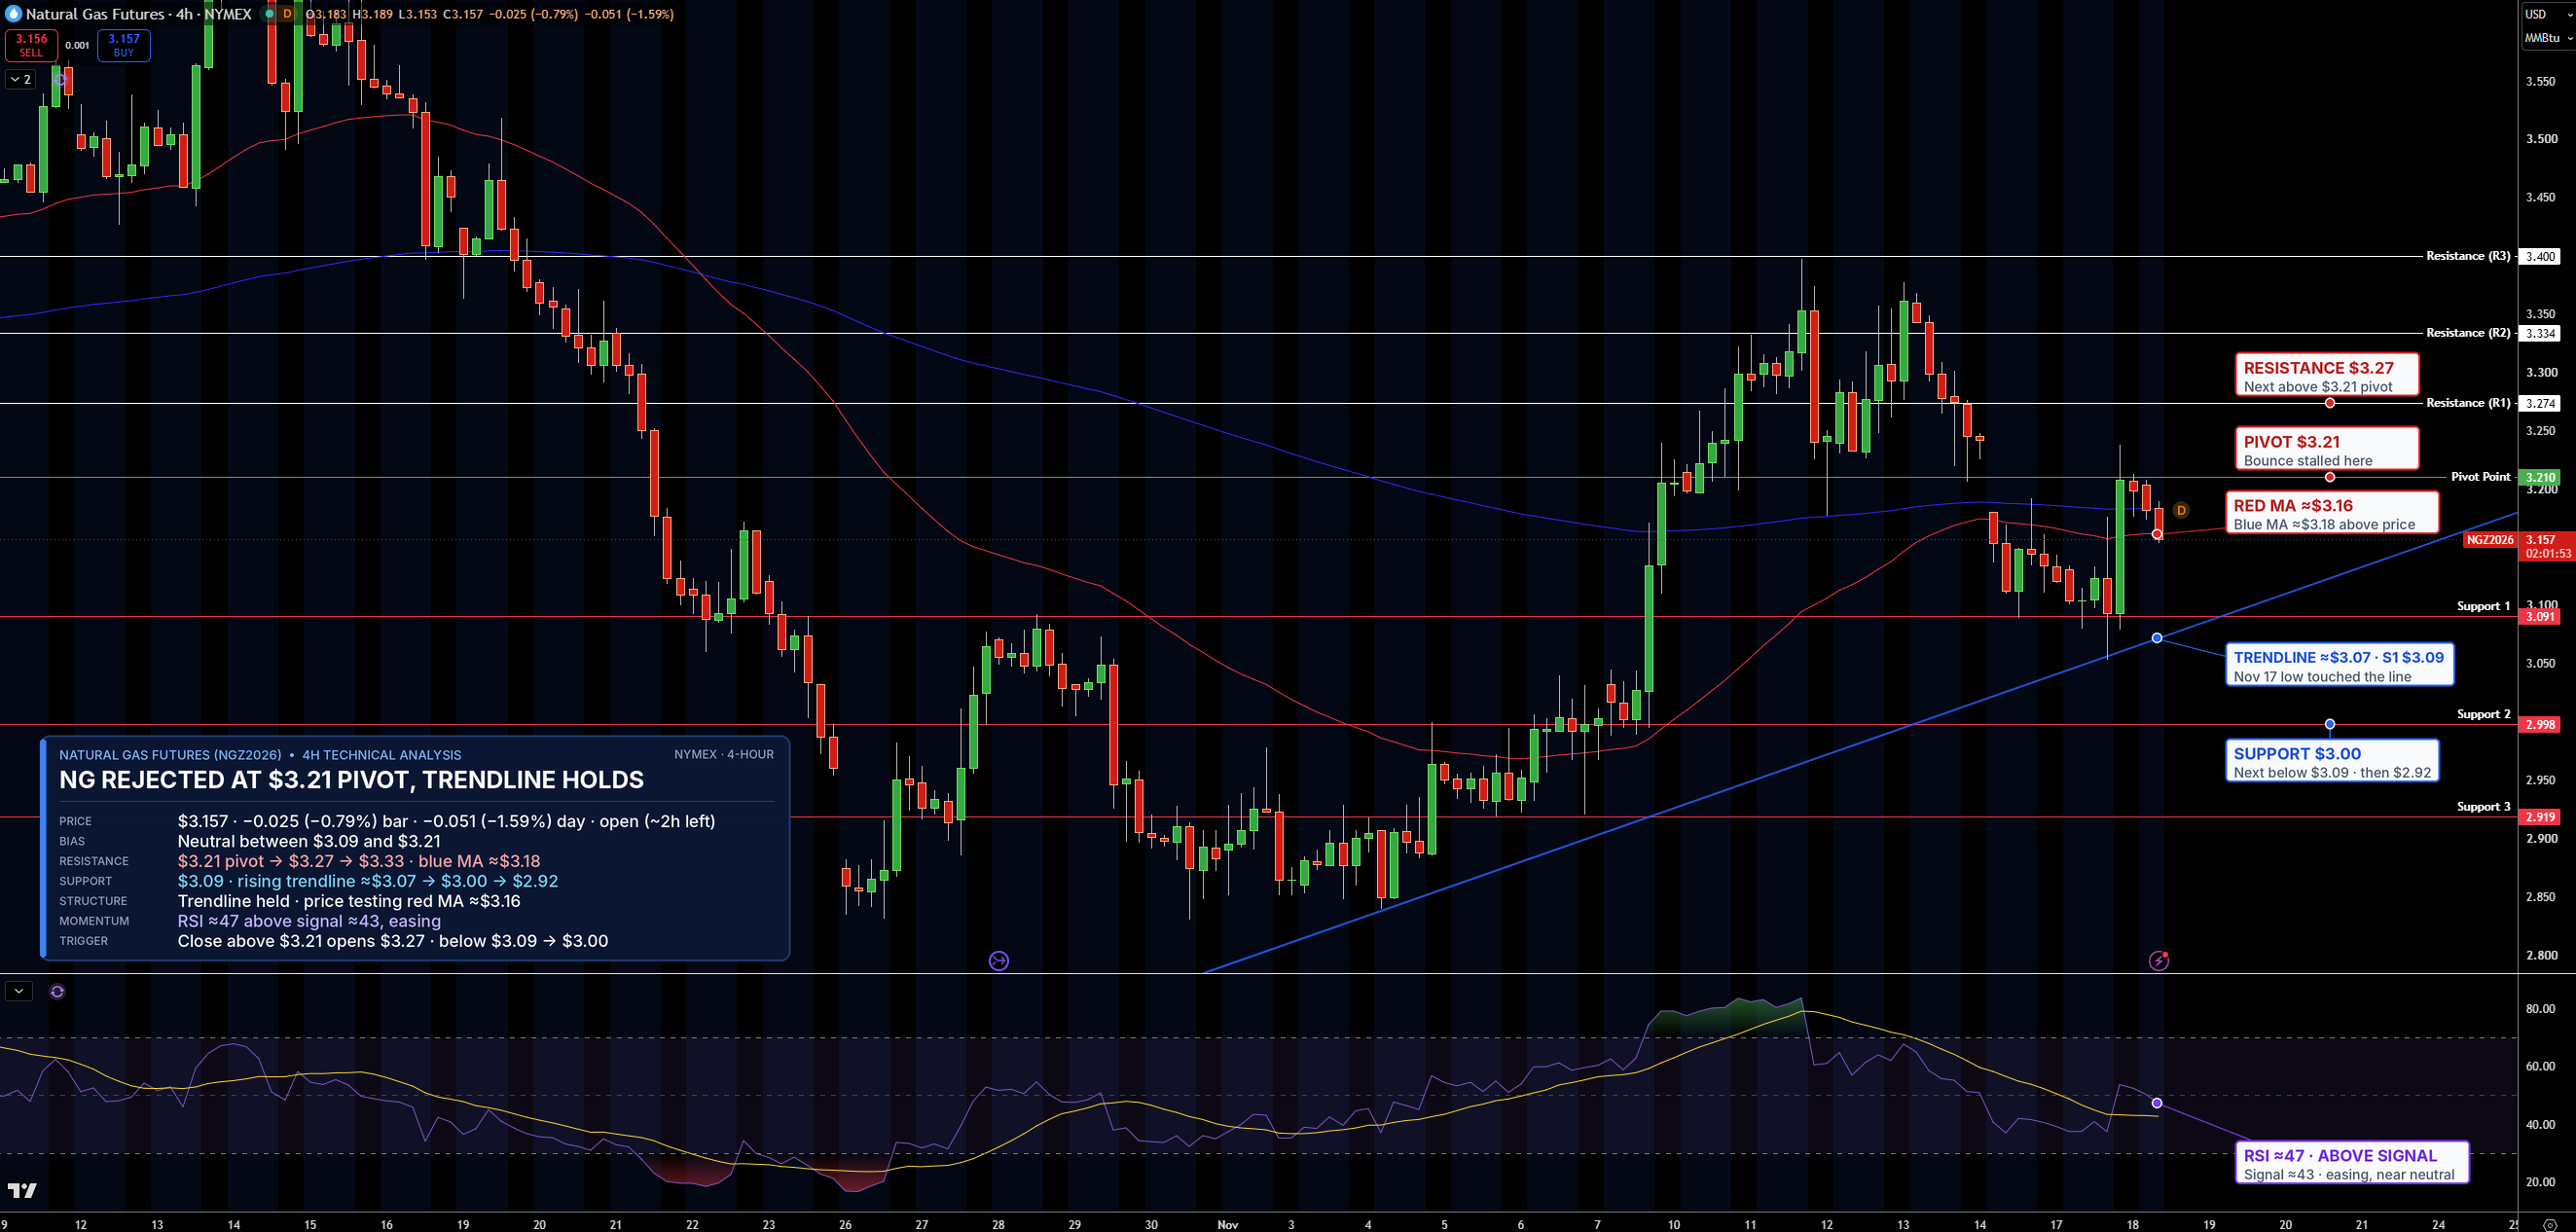
December natural gas futures are trading near $3.16/MMBtu on the 4-hour chart. Buyers defended a rising trendline from early November, but the bounce stalled at the $3.21 pivot, and gas is now testing its faster moving average.
Support is $3.09, then $3.00. Resistance is $3.21, then $3.27. RSI is near 47 and easing, close to neutral. The bias is neutral while gas trades between $3.09 and $3.21. A close above $3.21 would open $3.27, while a drop below $3.09 would point to $3.00.
WTI Crude Oil Technical Analysis: Oil Slips Toward $82.67 Below Falling Trendline
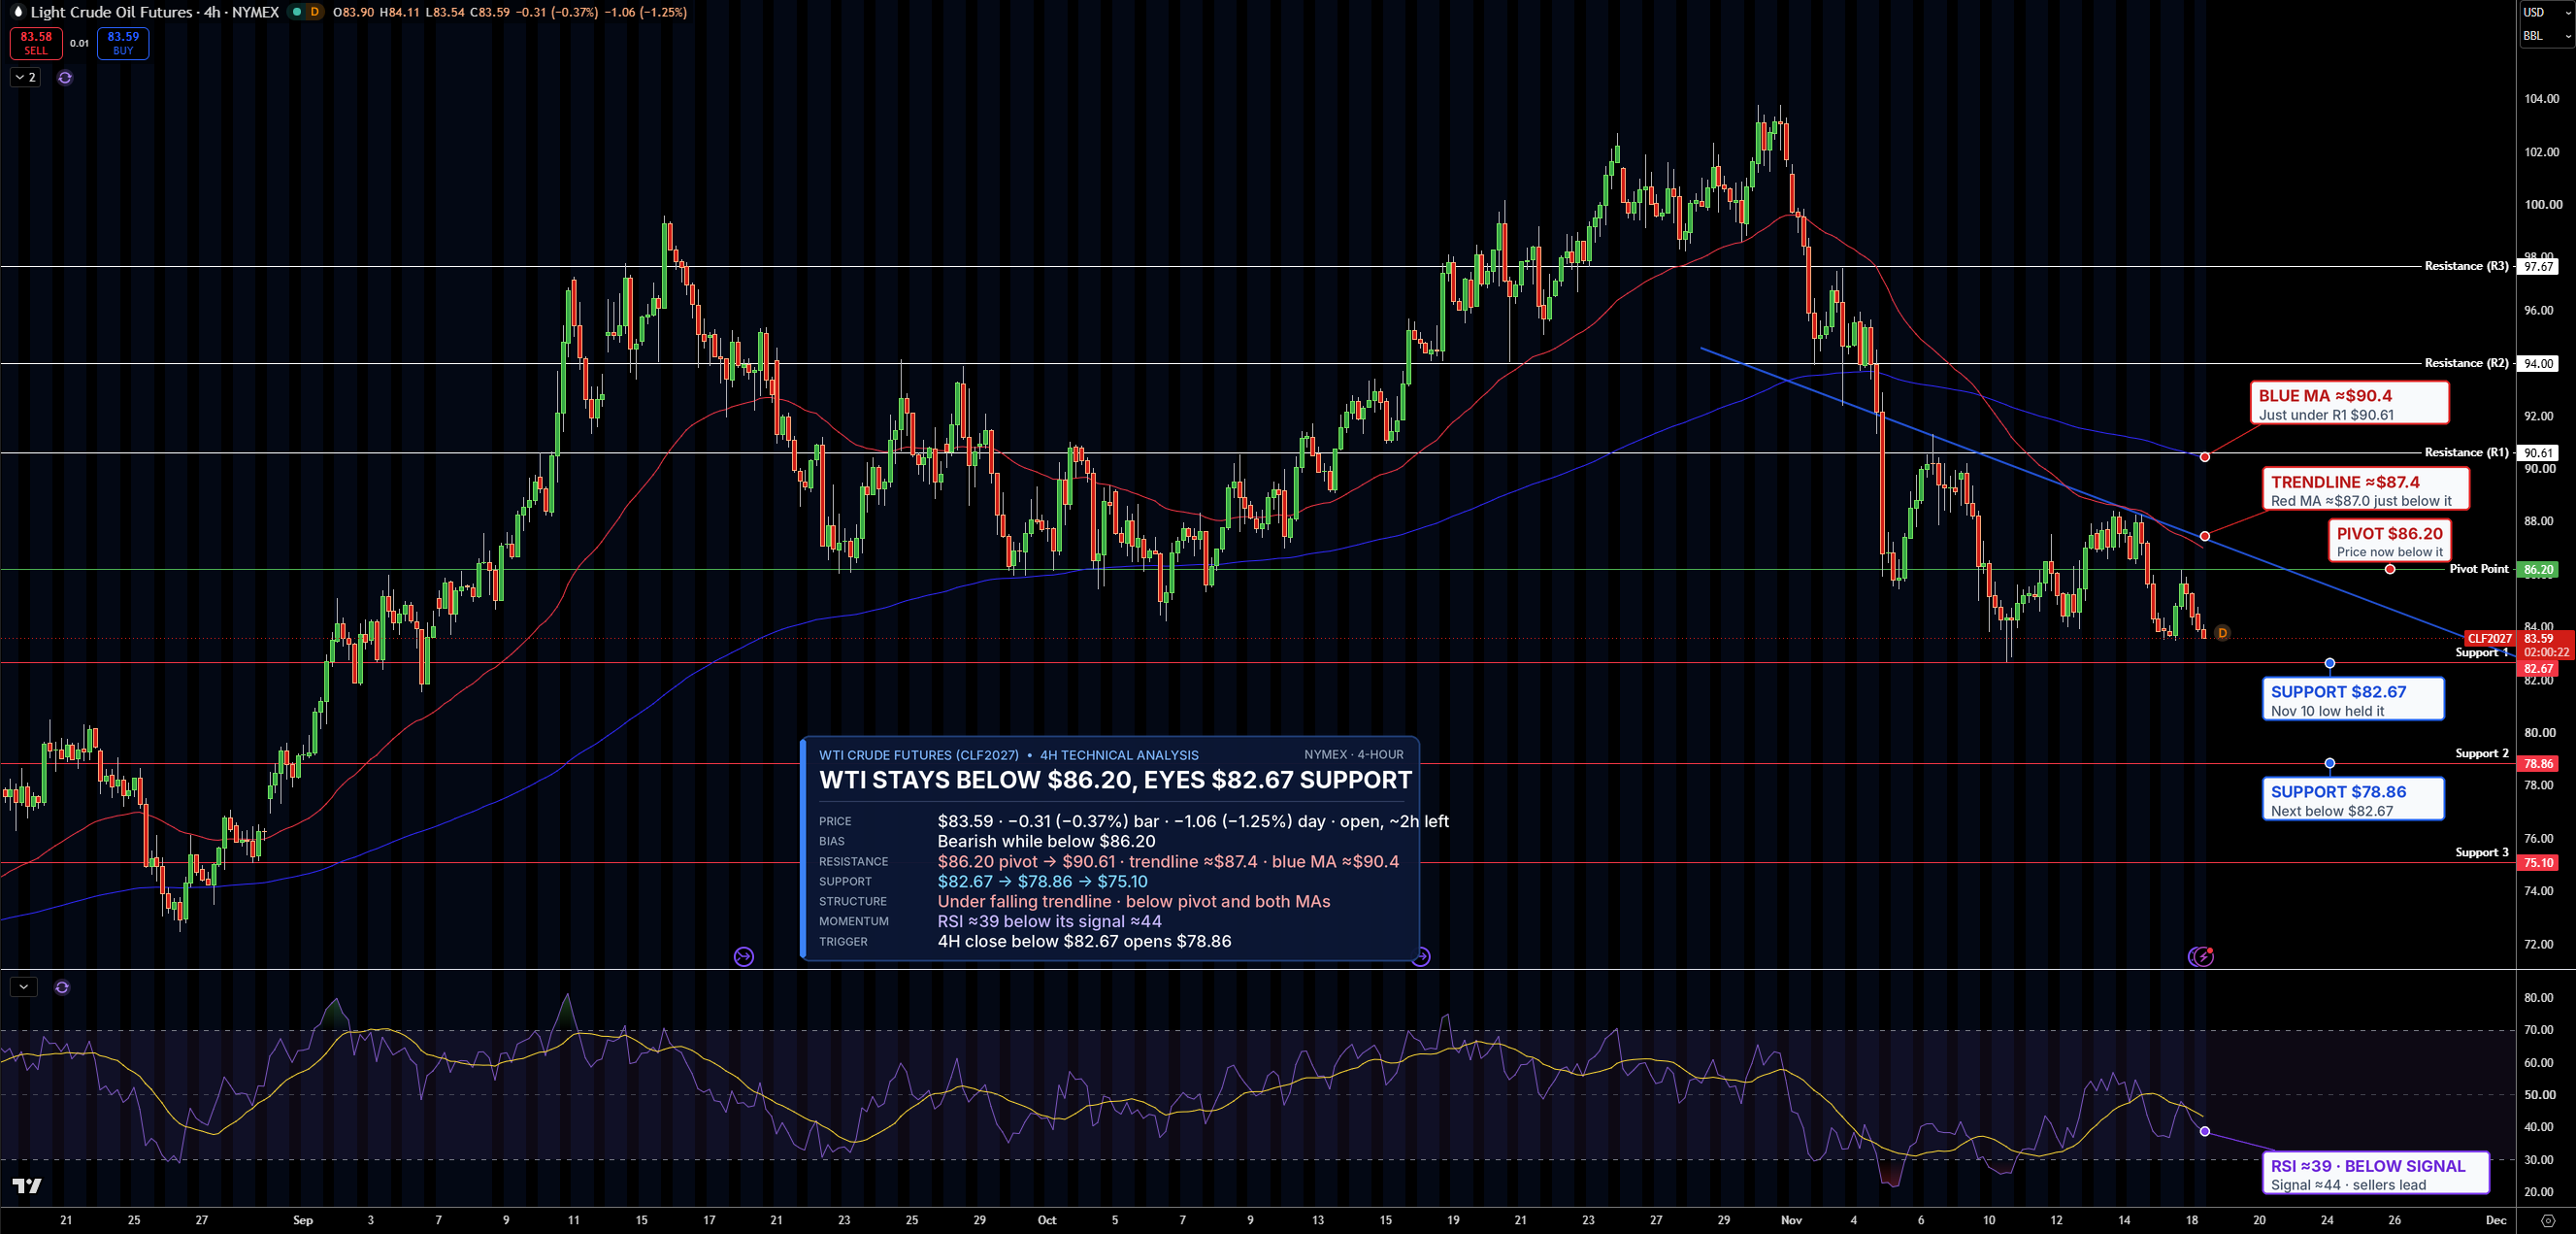
January WTI futures are trading near $83.59 on the 4-hour chart. Oil was turned back at a falling trendline from early November and remains below its $86.20 pivot and both moving averages.
Support is $82.67, then $78.86. Resistance is $86.20, then $90.61. RSI is near 39 and below its signal line. The bias stays bearish while WTI holds below $86.20, and a close below $82.67 would open $78.86.