
Geopolitical tensions, including Ukraine’s drone strikes on Russian oil facilities and Israel’s conflict with Hamas and potential clash with Hezbollah, also supported oil prices.
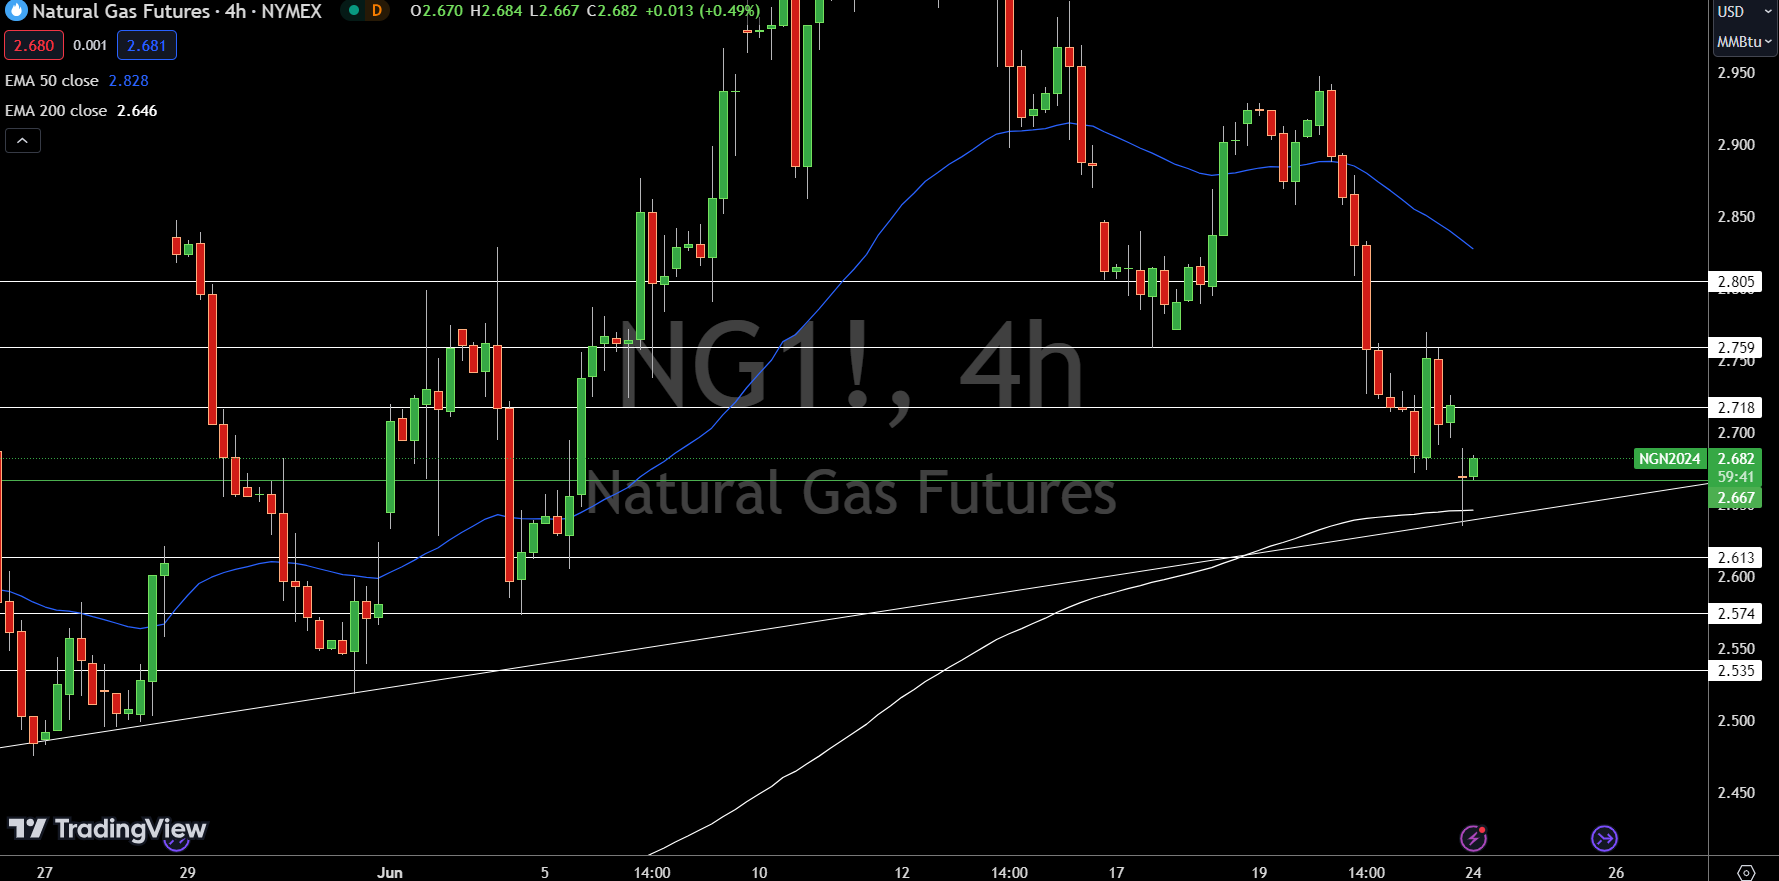
Natural Gas (NG) is trading at $2.68, down 0.78%. The key pivot point is $2.67, marked by the green line. Immediate resistance levels are $2.72, $2.76, and $2.81, indicating potential upward movement.
On the downside, immediate support is found at $2.61, with further support at $2.57 and $2.54. The 50-day Exponential Moving Average (EMA) is at $2.83, and the 200-day EMA is at $2.65. These technical indicators suggest a cautious bullish sentiment.
Maintaining above $2.67 is crucial for a bullish outlook; a break below this level could trigger a sharp selling trend.
WTI Oil Price Forecast
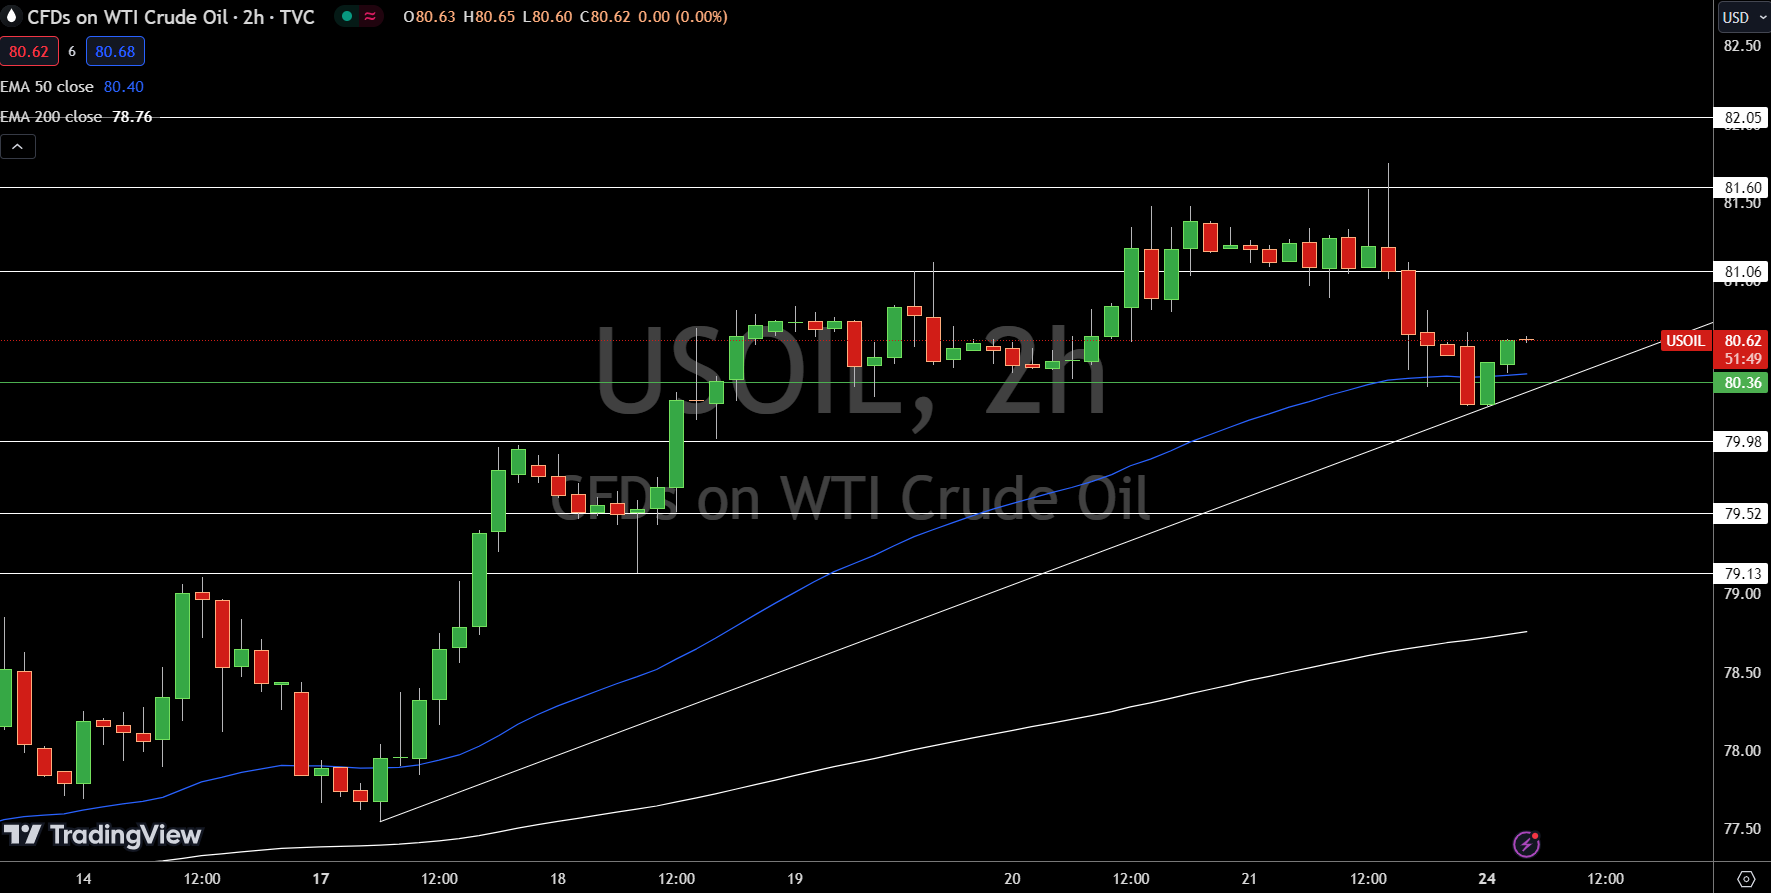
USOIL is currently trading at $80.62, up 0.13%. The pivot point, marked by the green line, is at $80.36. Immediate resistance levels are $81.06, $81.60, and $82.05, indicating potential upward momentum.
On the downside, immediate support is found at $79.98, with further support at $79.52 and $79.13. The 50-day Exponential Moving Average (EMA) is at $80.40, while the 200-day EMA is at $78.76.
These indicators suggest a cautious bullish sentiment. Maintaining above $80.36 is crucial for a bullish outlook; a break below this level could trigger a sharp selling trend.
Brent Oil Price Forecast
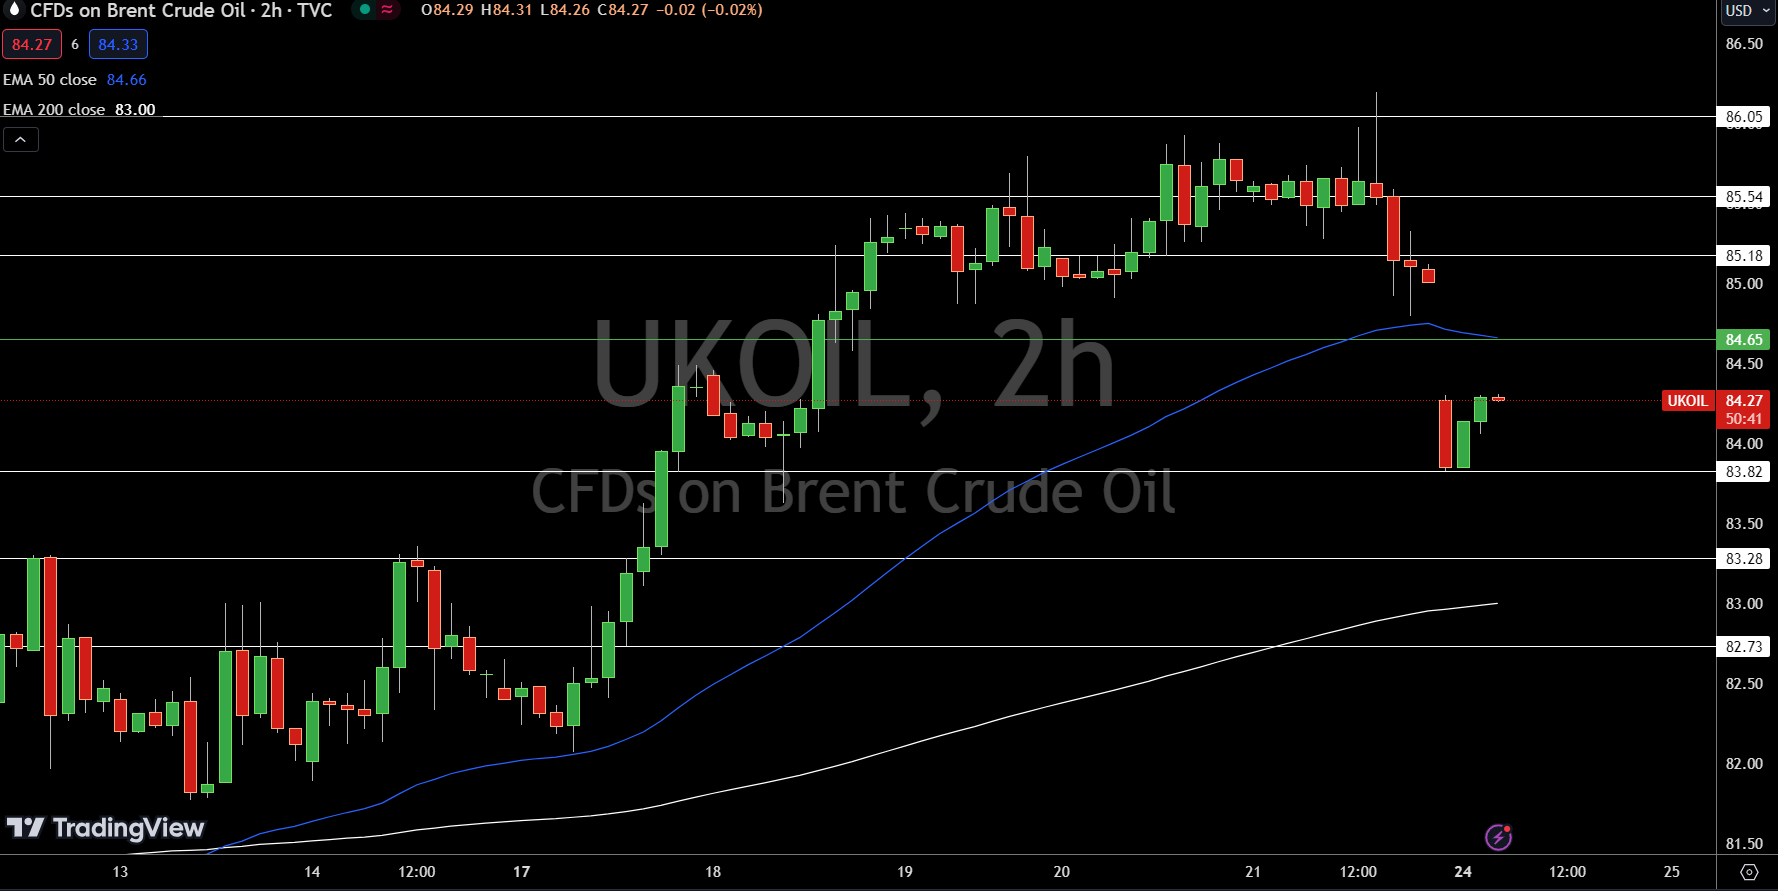
UKOIL is trading at $84.27, down 0.85%. The pivot point, indicated by the green line, is at $84.65. Immediate resistance levels are $85.18, $85.54, and $86.05, suggesting potential upward momentum.
Immediate support is found at $83.82, with further support at $83.28 and $82.73. The 50-day Exponential Moving Average (EMA) stands at $84.66, while the 200-day EMA is at $83.00.
These technical indicators suggest a cautious bearish sentiment. Trading below $84.65 supports a bearish outlook; breaking above this level could indicate a shift towards bullish bias.
For a look at all of today’s economic events, check out our economic calendar.