
Energy Markets Navigate Uneven Recovery in Middle East Supply
Crude oil fundamentals continue to be shaped by the weak and incomplete recovery of flows through the Strait of Hormuz. Tanker traffic and production in the Gulf continue to fall short of pre-conflict levels despite some progress in diplomacy and partial reopenings during the summer. Tensions that disrupted the recovery of flows have further hampered global oil supply when compared to the pre-war levels of supply and production. Reports from the International Energy Agency and several market analysts confirm that global supply remains significantly constrained.
Global inventories have sustained the supply that was previously available, and the Strategic Petroleum Reserves of most major consuming countries have been drawn down with little oil being supplied in other regions. Demand has been somewhat elastic with lower imports in parts of Asia, most notably China and other regions, and less demand for fuel, which has balanced the market. Non-OPEC supply and greater exports from the Atlantic Basin have lessened the impact of OPEC+ increased production quotas. Actual production recovery in the Gulf has lagged supply and security problems and the time needed to start production in fields that are operational.
Natural gas markets are experiencing the same issues. Qatar and United Arab Emirates LNG exports, which usually have a large share in global throughput, are severely limited by constrained transit through the Strait. The IEA expects global LNG supply to be level by 2026 given the higher production from North America, African and Australian continents, which will offset the production losses from the Gulf Cooperation Countries. Demand has lagged in Asia with a fuel switch to coal and cuts in industrial production. In Europe, there has been competition to fill seasonal storage, and this has led to slower than normal LNG supply.
In the U.S., the combination of vigorous domestic production and adequate storage continues to provide insulation to the Henry Hub market from the impact of global market tightness, although significant LNG export levels are drawing gas from the system. The outlook for oil and gas in the short term depends on the speed and sustainability of the transit normalization in the Middle East and the further demand responses in the large importing countries.
Natural Gas Technical Analysis: Price Consolidation Continues with Price Remaining Above the Rising Channel Support
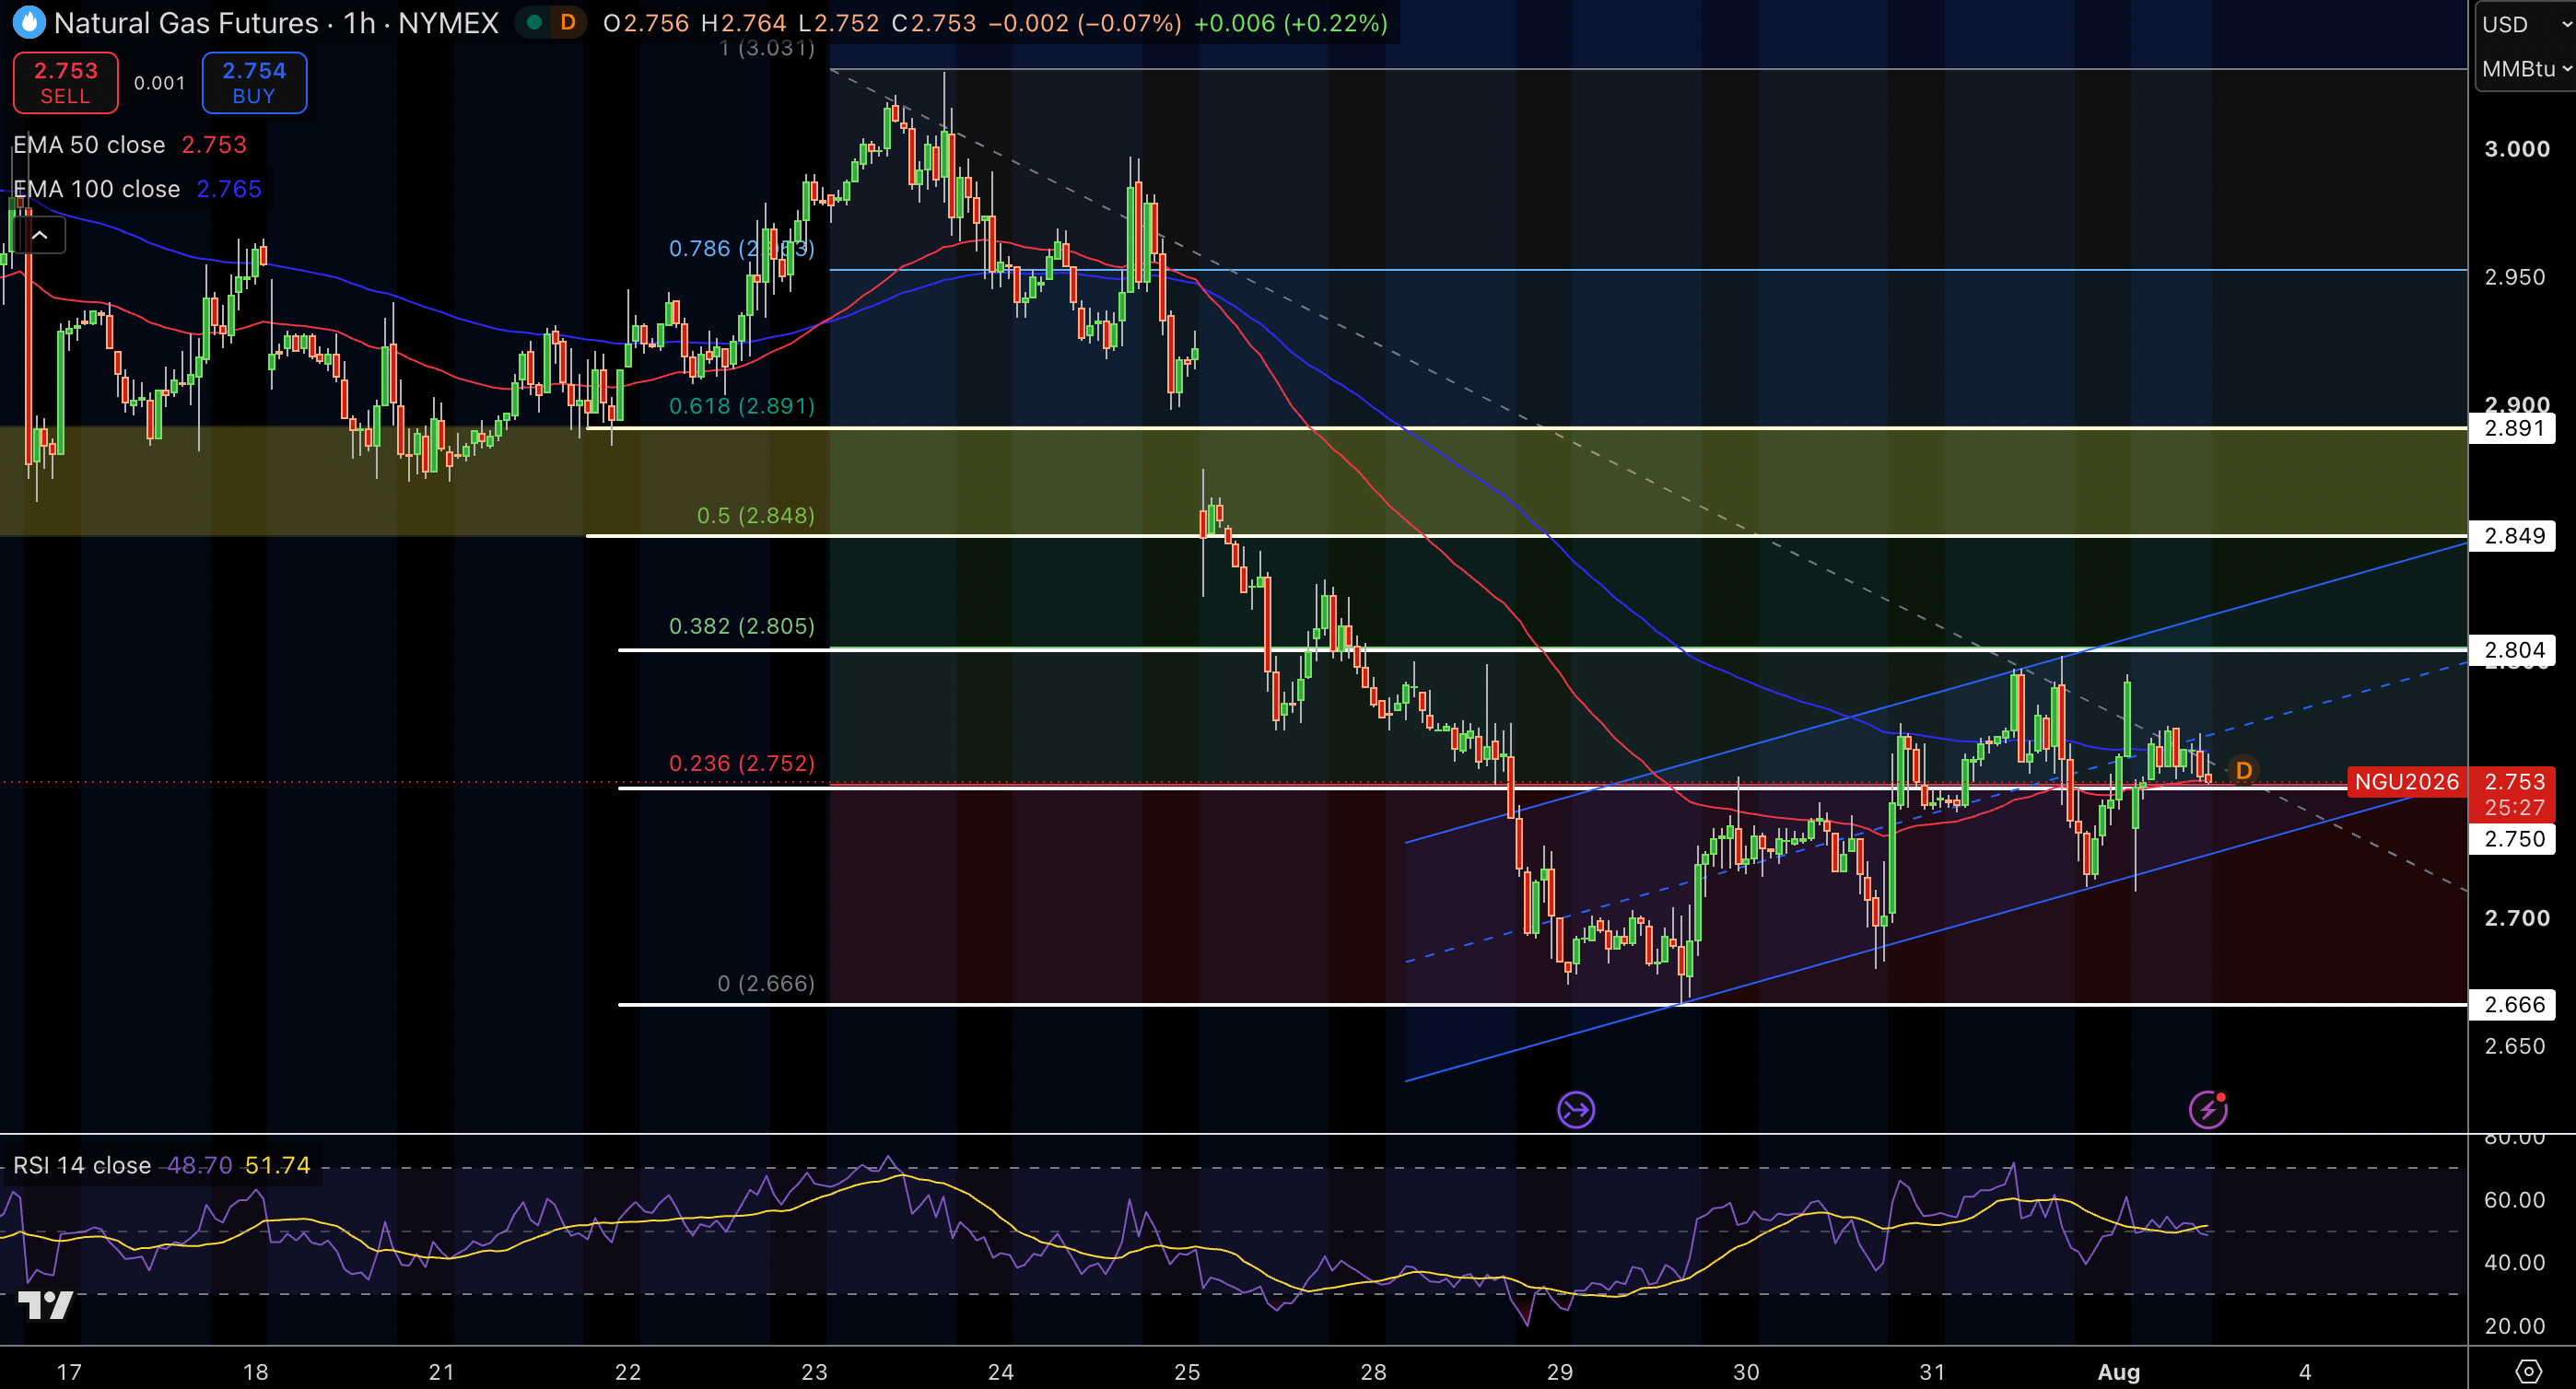
Natural gas is consolidating at the $2.75 level (the 23.6% Fibonacci retracement level) and the lower boundary of the rising channel. Natural gas price is being supported by this level. Natural gas price remains below the 50-EMA ($2.753) and 100-EMA ($2.765) and indicates that there is no significant price movement in either direction.
Typically, compression of the rising channel and Fibonacci levels results in a breakout. The RSI is neutral indicating there is no price movement in either direction.
The immediate resistance price level is $2.805 with subsequent resistance levels at $2.849 and $2.891. The initial support price level is $2.752, with stronger support at $2.666 in the case of a bearish move.
If price remains below the $2.752 level, further price moves to the support level at $2.67 will be expected. Price above $2.805 will Bullish price action is expected at the $2.85–$2.89 levels.
Natural Gas Price Forecast
Every new Natural Gas analysis as it publishes, today's technical signal and key levels, live price — on one page.
See all Natural Gas forecastsWTI Oil Price Forecast
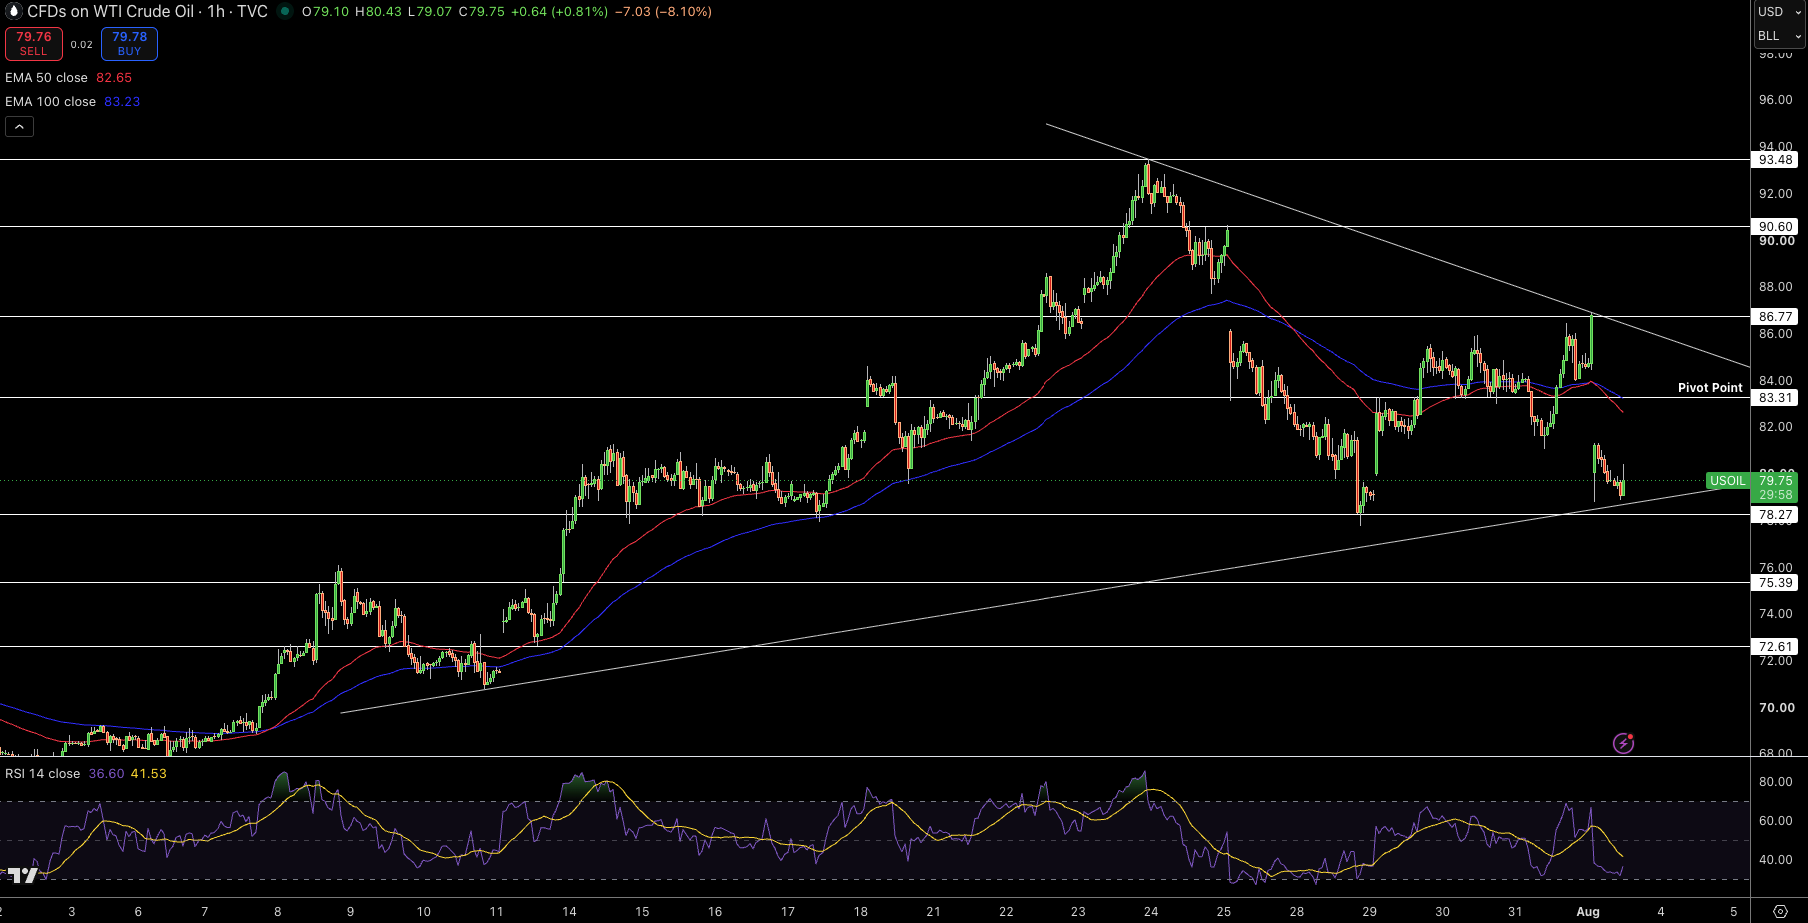
WTI crude has started to bounce back with a small rally after approaching the $78.30 area of support. Most of the rest of the technicals are still showing bearish sentiments. The price is still trading far below the 50-EMA ($82.65) and the 100-EMA ($83.23). The sellers are still in control after the break of the ascending channel. The old support area around $83.30 is now a major resistance area. The descending trendline of the most recent highs is still forcing a cap on the price for potential recoveries.
The RSI has slightly improved, but is still showing no real signs of buying bullish momentum, as it is still under the 50 level. The primary support is at $78.27 with the second support at $75.39. On the other hand, resistance is at $80.60 and $83.31, but a descending trendline is expected to contain recovery resistance with the most selling pressure.
The current recovery lacks any bullish sentiment as long as $83.30 is not reclaimed. The bearish move is expected to retest $78.30 with a higher target of $75.40.
Brent Crude Oil Technical Analysis: Resistance at the Fibonacci and EMA

Brent crude is also showing a bullish recovery after hitting the support of $80.60, but like WTI, is also showing a weak recovery. Prices are still contained below the 50-EMA ($86.15) and the 100-EMA ($86.93) Lower prices pushed Brent below the 23.6% Fibonacci retracement level ($85.68) and bearish sentiment is expected despite the bounce.
Price is nearing the 38.2% Fibonacci level at $88.80. This corresponds with moving average resistance, with unsuccessful moves below this zone reinforcing the downtrend. The RSI has not only recovered from the oversold level, but moved above this level. However, the RSI level being below the 50 mark indicates that the bearish sentiment is still greater than bullish.
An $83.80 price level marks the first support level. The next support level is $80.60. The resistance price levels are $85.68, $88.80, and $91.33 in that order.
The outlook will be deemed bearish if Brent remains below $85.68. There will be an opportunity to sell if buyers do not move above the moving averages.