
The U.S. Federal Reserve’s decision to hold interest rates steady and delay rate cuts until December tempered the price rally. The International Energy Agency (IEA) projected oil demand peaking by 2029 at 106 million barrels per day.
Geopolitical tensions, including ongoing Gaza ceasefire talks, continue to influence market dynamics.
Natural Gas Price Forecast
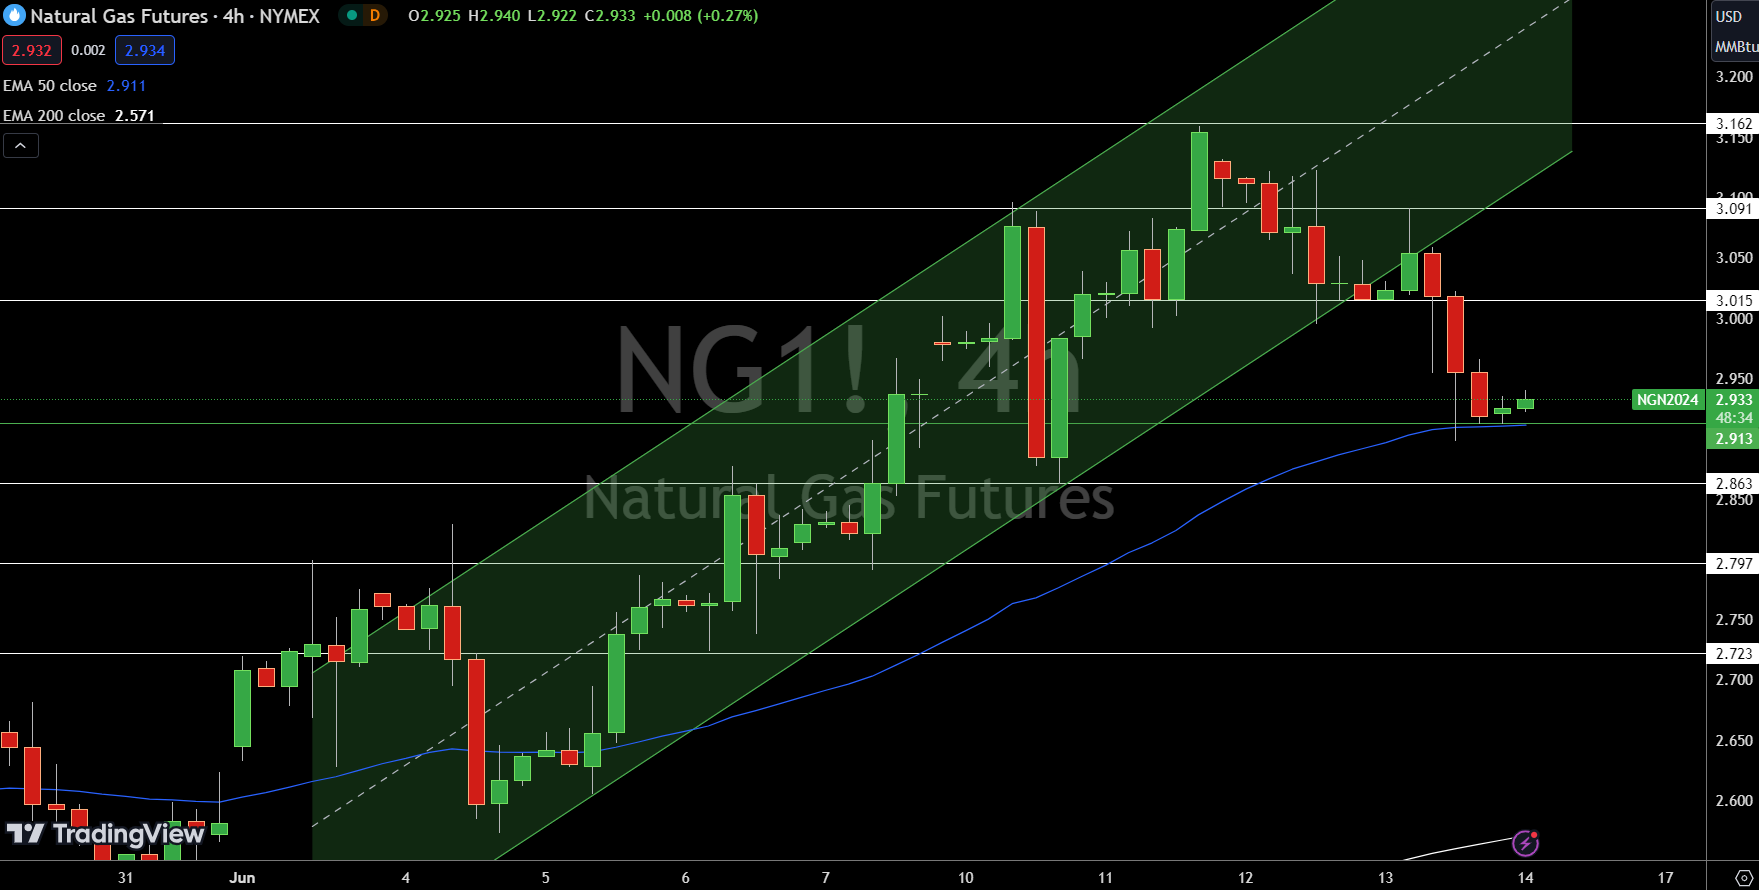
Natural Gas (NG) is currently trading at $2.93, up 0.61%. The chart timeframe is 4 hours. Key levels to watch include a pivot point at $2.91.
Immediate resistance levels are $3.02, $3.09, and $3.16. Support levels are at $2.86, $2.80, and $2.72.
The 50-day Exponential Moving Average (EMA) is at $2.91, while the 200-day EMA is at $2.57. The Relative Strength Index (RSI) stands at 55, indicating moderate momentum.
NG is bullish above $2.91, but a break below this level could trigger a sharp selling trend.
WTI Oil Price Forecast
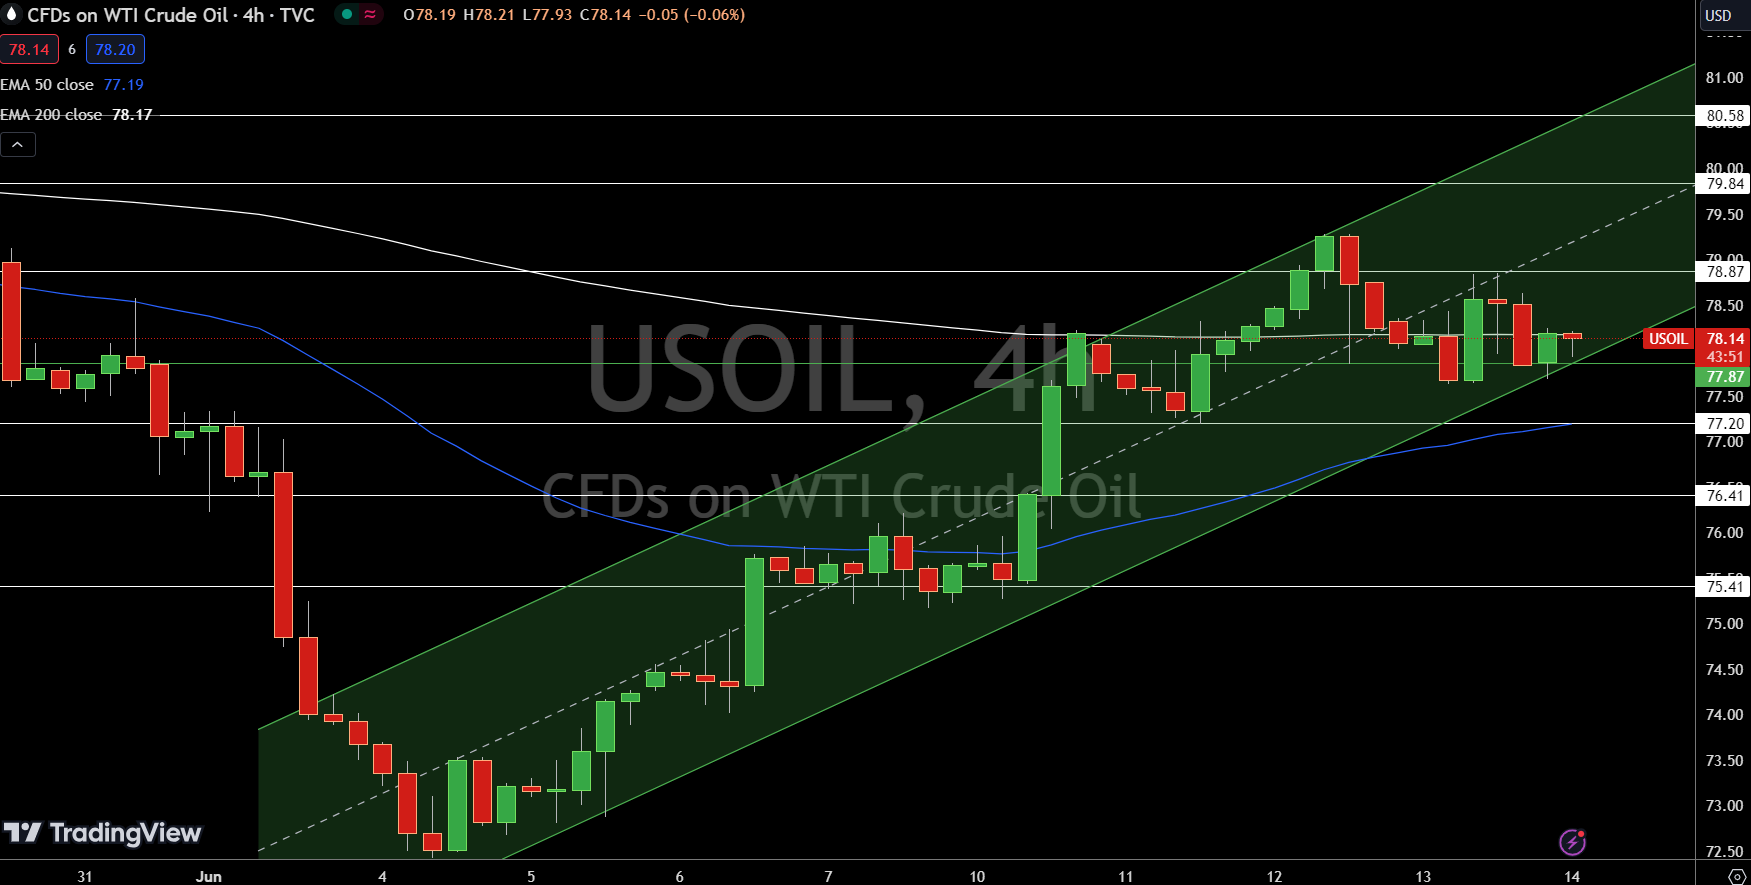
WTI Crude Oil (USOIL) is currently trading at $78.14, up 0.34%. The chart timeframe is set to 4 hours. Key levels to watch include a pivot point at $77.87. Immediate resistance levels are $78.87, $79.84, and $80.58. On the downside, support levels are at $77.20, $76.41, and $75.41.
The 50-day Exponential Moving Average (EMA) stands at $77.19, while the 200-day EMA is at $78.17. The Relative Strength Index (RSI) is at 55, indicating moderate momentum. USOIL is bullish above $77.87, but a break below this level could trigger a sharp selling trend.
Brent Oil Price Forecast
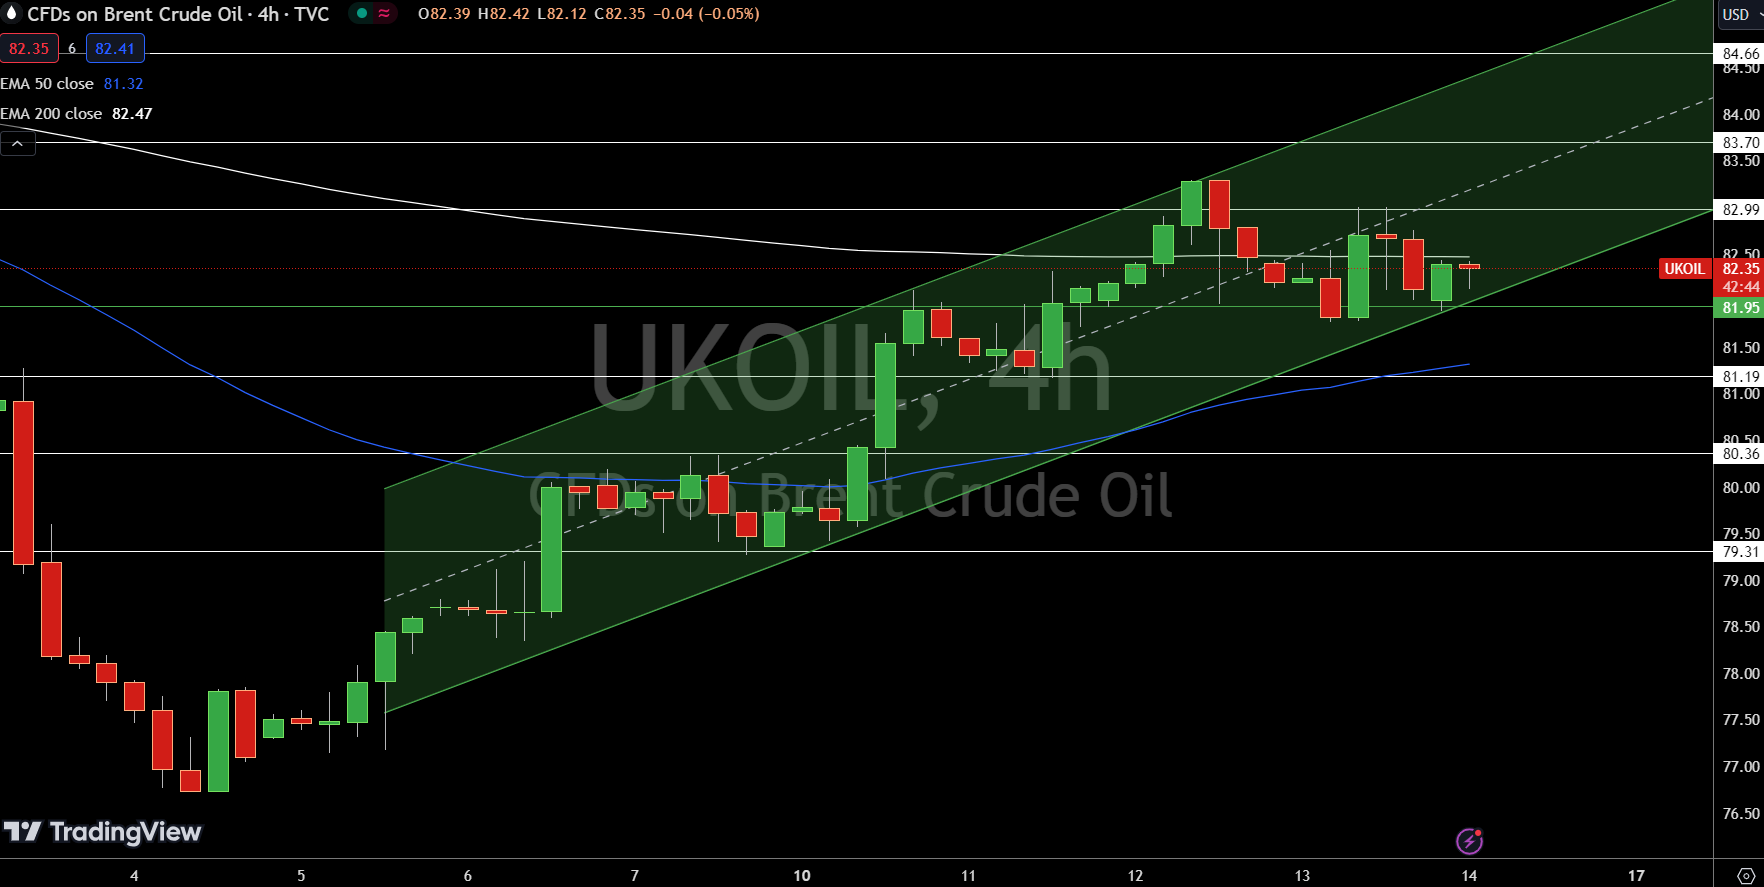
Brent Crude Oil (UKOIL) is currently trading at $82.35, up 0.26%. The chart timeframe is 4 hours. Key levels to monitor include a pivot point at $81.95. Immediate resistance levels are $82.99, $83.70, and $84.66. On the downside, support levels are at $81.19, $80.36, and $79.31.
The 50-day Exponential Moving Average (EMA) is at $81.32, while the 200-day EMA is at $82.47. The Relative Strength Index (RSI) stands at 55, indicating moderate momentum. UKOIL is bullish above $81.95, but a break below this level could trigger a sharp selling trend.
For a look at all of today’s economic events, check out our economic calendar.