
Advertisement
Advertisement

Natural Gas and Oil Forecast: WTI Soars Past $76 – More Upside on the Horizon?

By: 
Arslan Ali
Natural Gas and Oil Forecast: WTI Soars Past $76 – More Upside on the Horizon?

Key Points:

  • Oil prices gain 3% weekly, driven by U.S. jobs data and Middle East tensions.
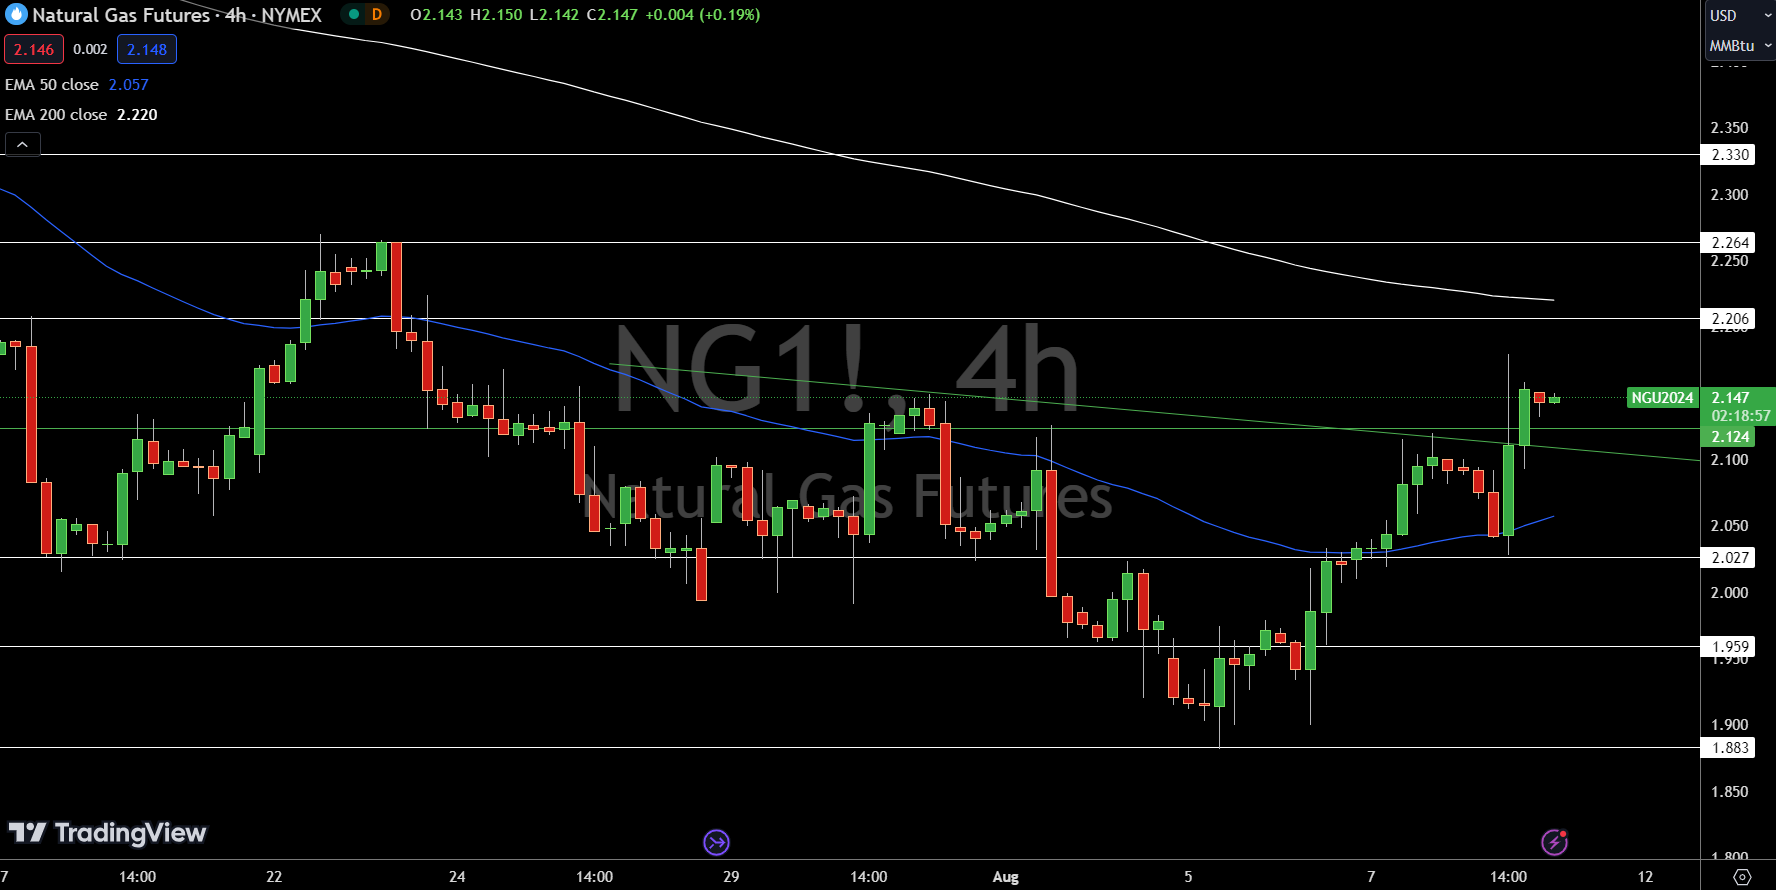
  • Natural gas remains bullish, holding above $2.12 pivot, supported by 50-day EMA.
  • Brent oil maintains bullish momentum above $78.78, facing resistance at $81.50.

Market Overview

Oil prices edged higher on Friday, marking a weekly gain of over 3%, driven by U.S. jobs data that alleviated demand concerns and ongoing geopolitical tensions in the Middle East. Israeli airstrikes and potential retaliatory actions by Iran have fueled fears of supply disruptions.

Additionally, the force majeure at Libya’s Sharara oilfield and tensions in Yemen have added upward pressure on prices. This rise in oil prices is likely to spill over into natural gas markets, supporting forecasts for higher energy prices as geopolitical risks and strong U.S. economic data bolster the outlook.

Natural Gas Price Forecast

Natural Gas (NG) Price Chart
WTI Price Chart
WTI Price Chart

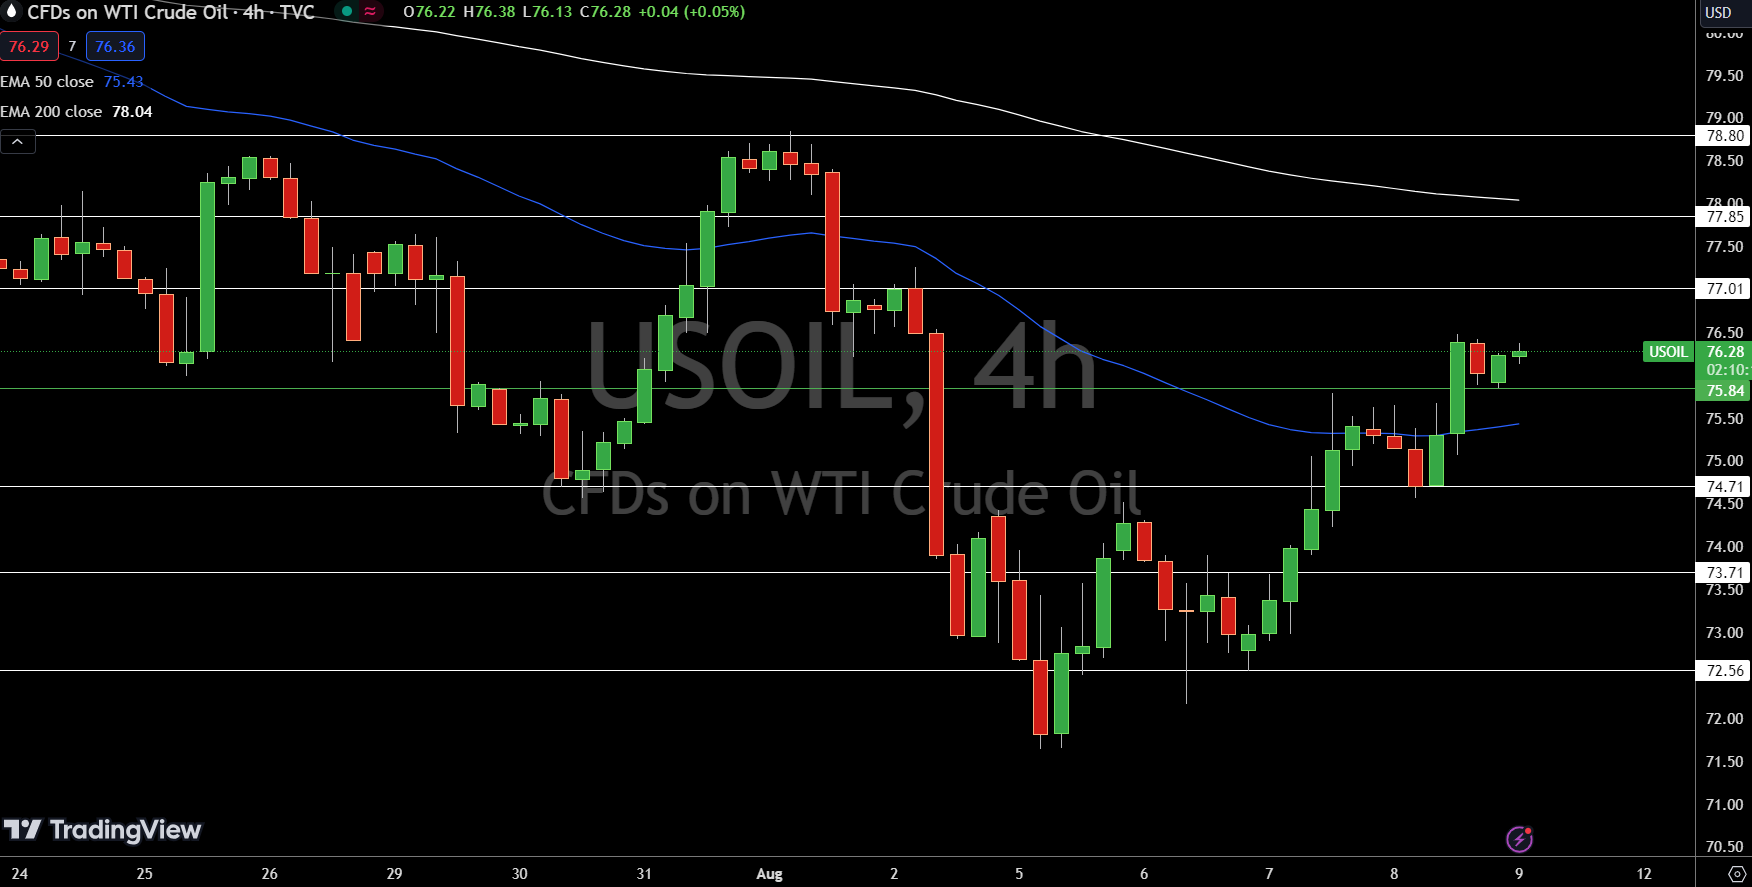
U.S. crude oil futures (USOIL) are trading at $76.28, up 0.37% on the day. The 4-hour chart shows the price holding above the pivot point at $75.8, indicating potential bullish momentum. Immediate resistance is at $77.0, with further resistance levels at $77.9 and $78.8.

On the downside, support is seen at $74.7, followed by $73.7 and $72.6. The 50-day EMA at $75.4 supports the bullish outlook, while the 200-day EMA at $78.0 presents a significant barrier.

A sustained break below $75.8 could trigger a sharp selling trend, shifting the market sentiment.

Brent Oil Price Forecast

Natural Gas Price Forecast

Every new Natural Gas analysis as it publishes, today's technical signal and key levels, live price — on one page.

See all Natural Gas forecasts
Brent Price Chart
Brent Price Chart

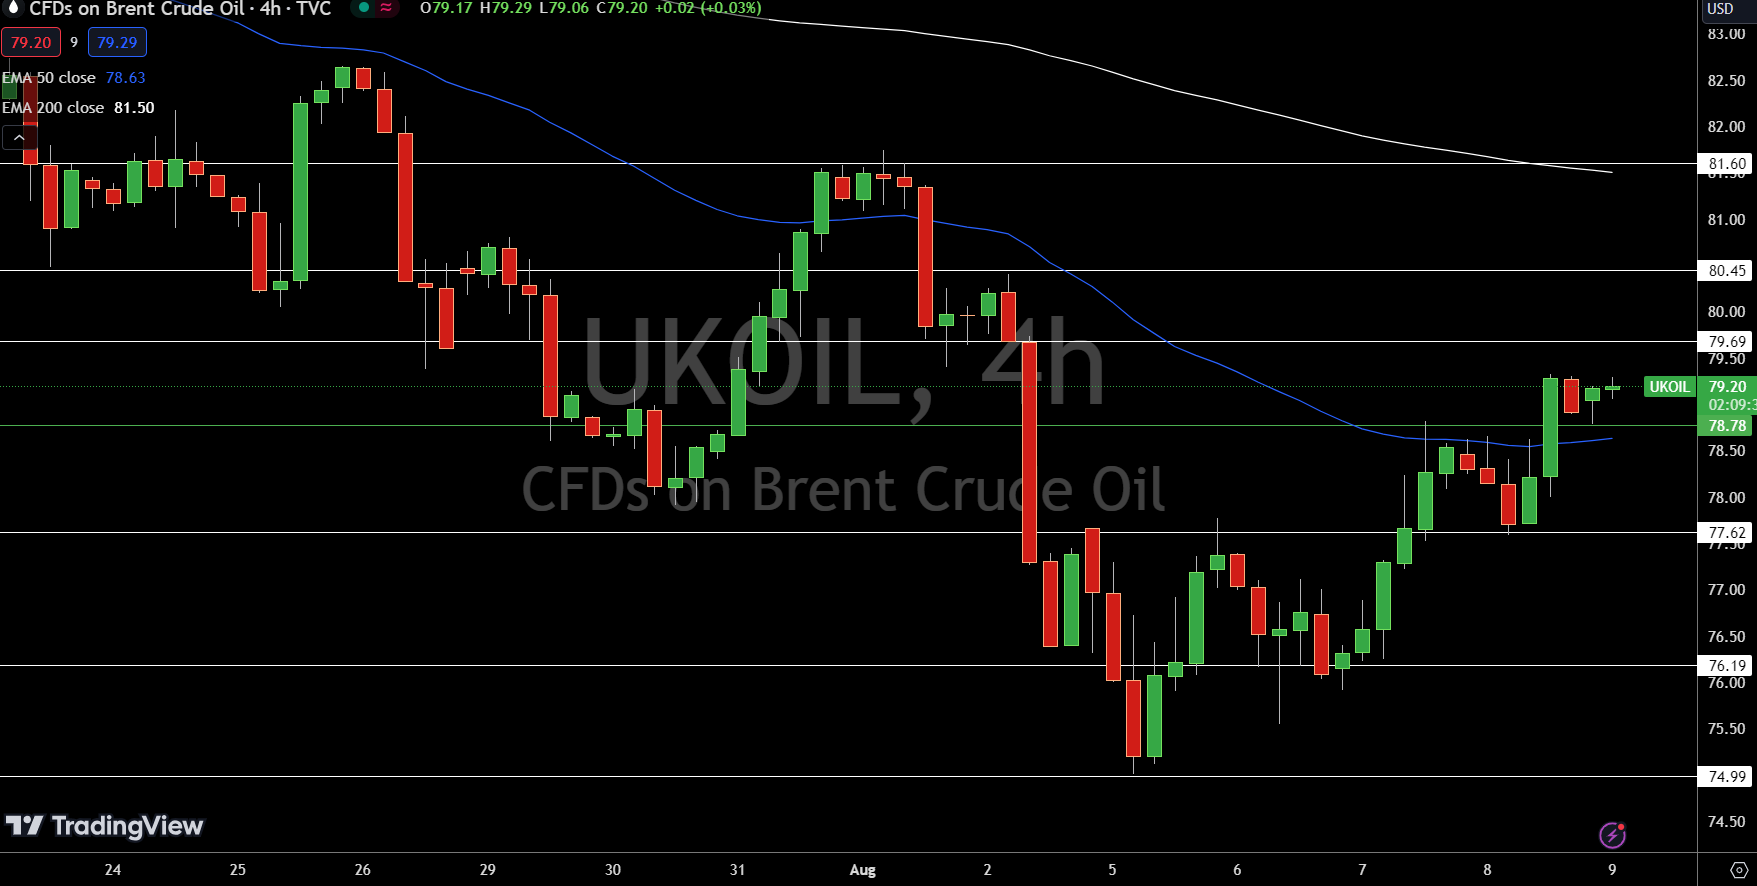
Brent crude (UKOIL) is trading at $79.20, up 0.37%. The 4-hour chart indicates the price is above the pivot point at $78.78, suggesting bullish momentum. Immediate resistance is at $79.69, with further resistance at $80.45 and $81.60.

On the downside, support is seen at $77.62, followed by $76.19 and $74.99. The 50-day EMA at $78.63 aligns with the current bullish trend, while the 200-day EMA at $81.50 could pose a significant hurdle.

A break below the $78.78 pivot point may trigger a sharp selling trend, altering the current market direction.

About the Author

Arslan AliTechnical Analysis Expert

Arslan is a finance MBA and also holds an MPhil degree in behavioral finance. An expert in financial analysis and investor psychology, Arslan uses his academic background to bring valuable insights about market sentiment and whether instruments are likely to be overbought or oversold.

Advertisement