WTI crude oil (CL) prices increased toward $69.00 in the early Tuesday trading session. This price increment was followed by former President Trump’s announcement of secondary tariffs targeting countries that import oil and gas from Venezuela. These sanctions, set to begin in April, aim to pressure Venezuela’s energy trade and could disrupt global supply chains.
The move adds to tensions in oil markets strained by Middle East instability. Israeli airstrikes in Gaza and rising conflict rhetoric from Prime Minister Netanyahu raise fears of further regional disruption. These developments and the Venezuelan sanctions support a bullish outlook for oil in the short term.
However, optimism surrounding Ukraine peace talks could offset upward pressure. US and Russian officials are working toward a ceasefire, which may ease geopolitical risk. A potential Black Sea maritime agreement could restore stability, limiting WTI’s upside momentum.

WTI Crude Oil (CL) Technical Analysis
Oil Daily Chart – Rebound from Support
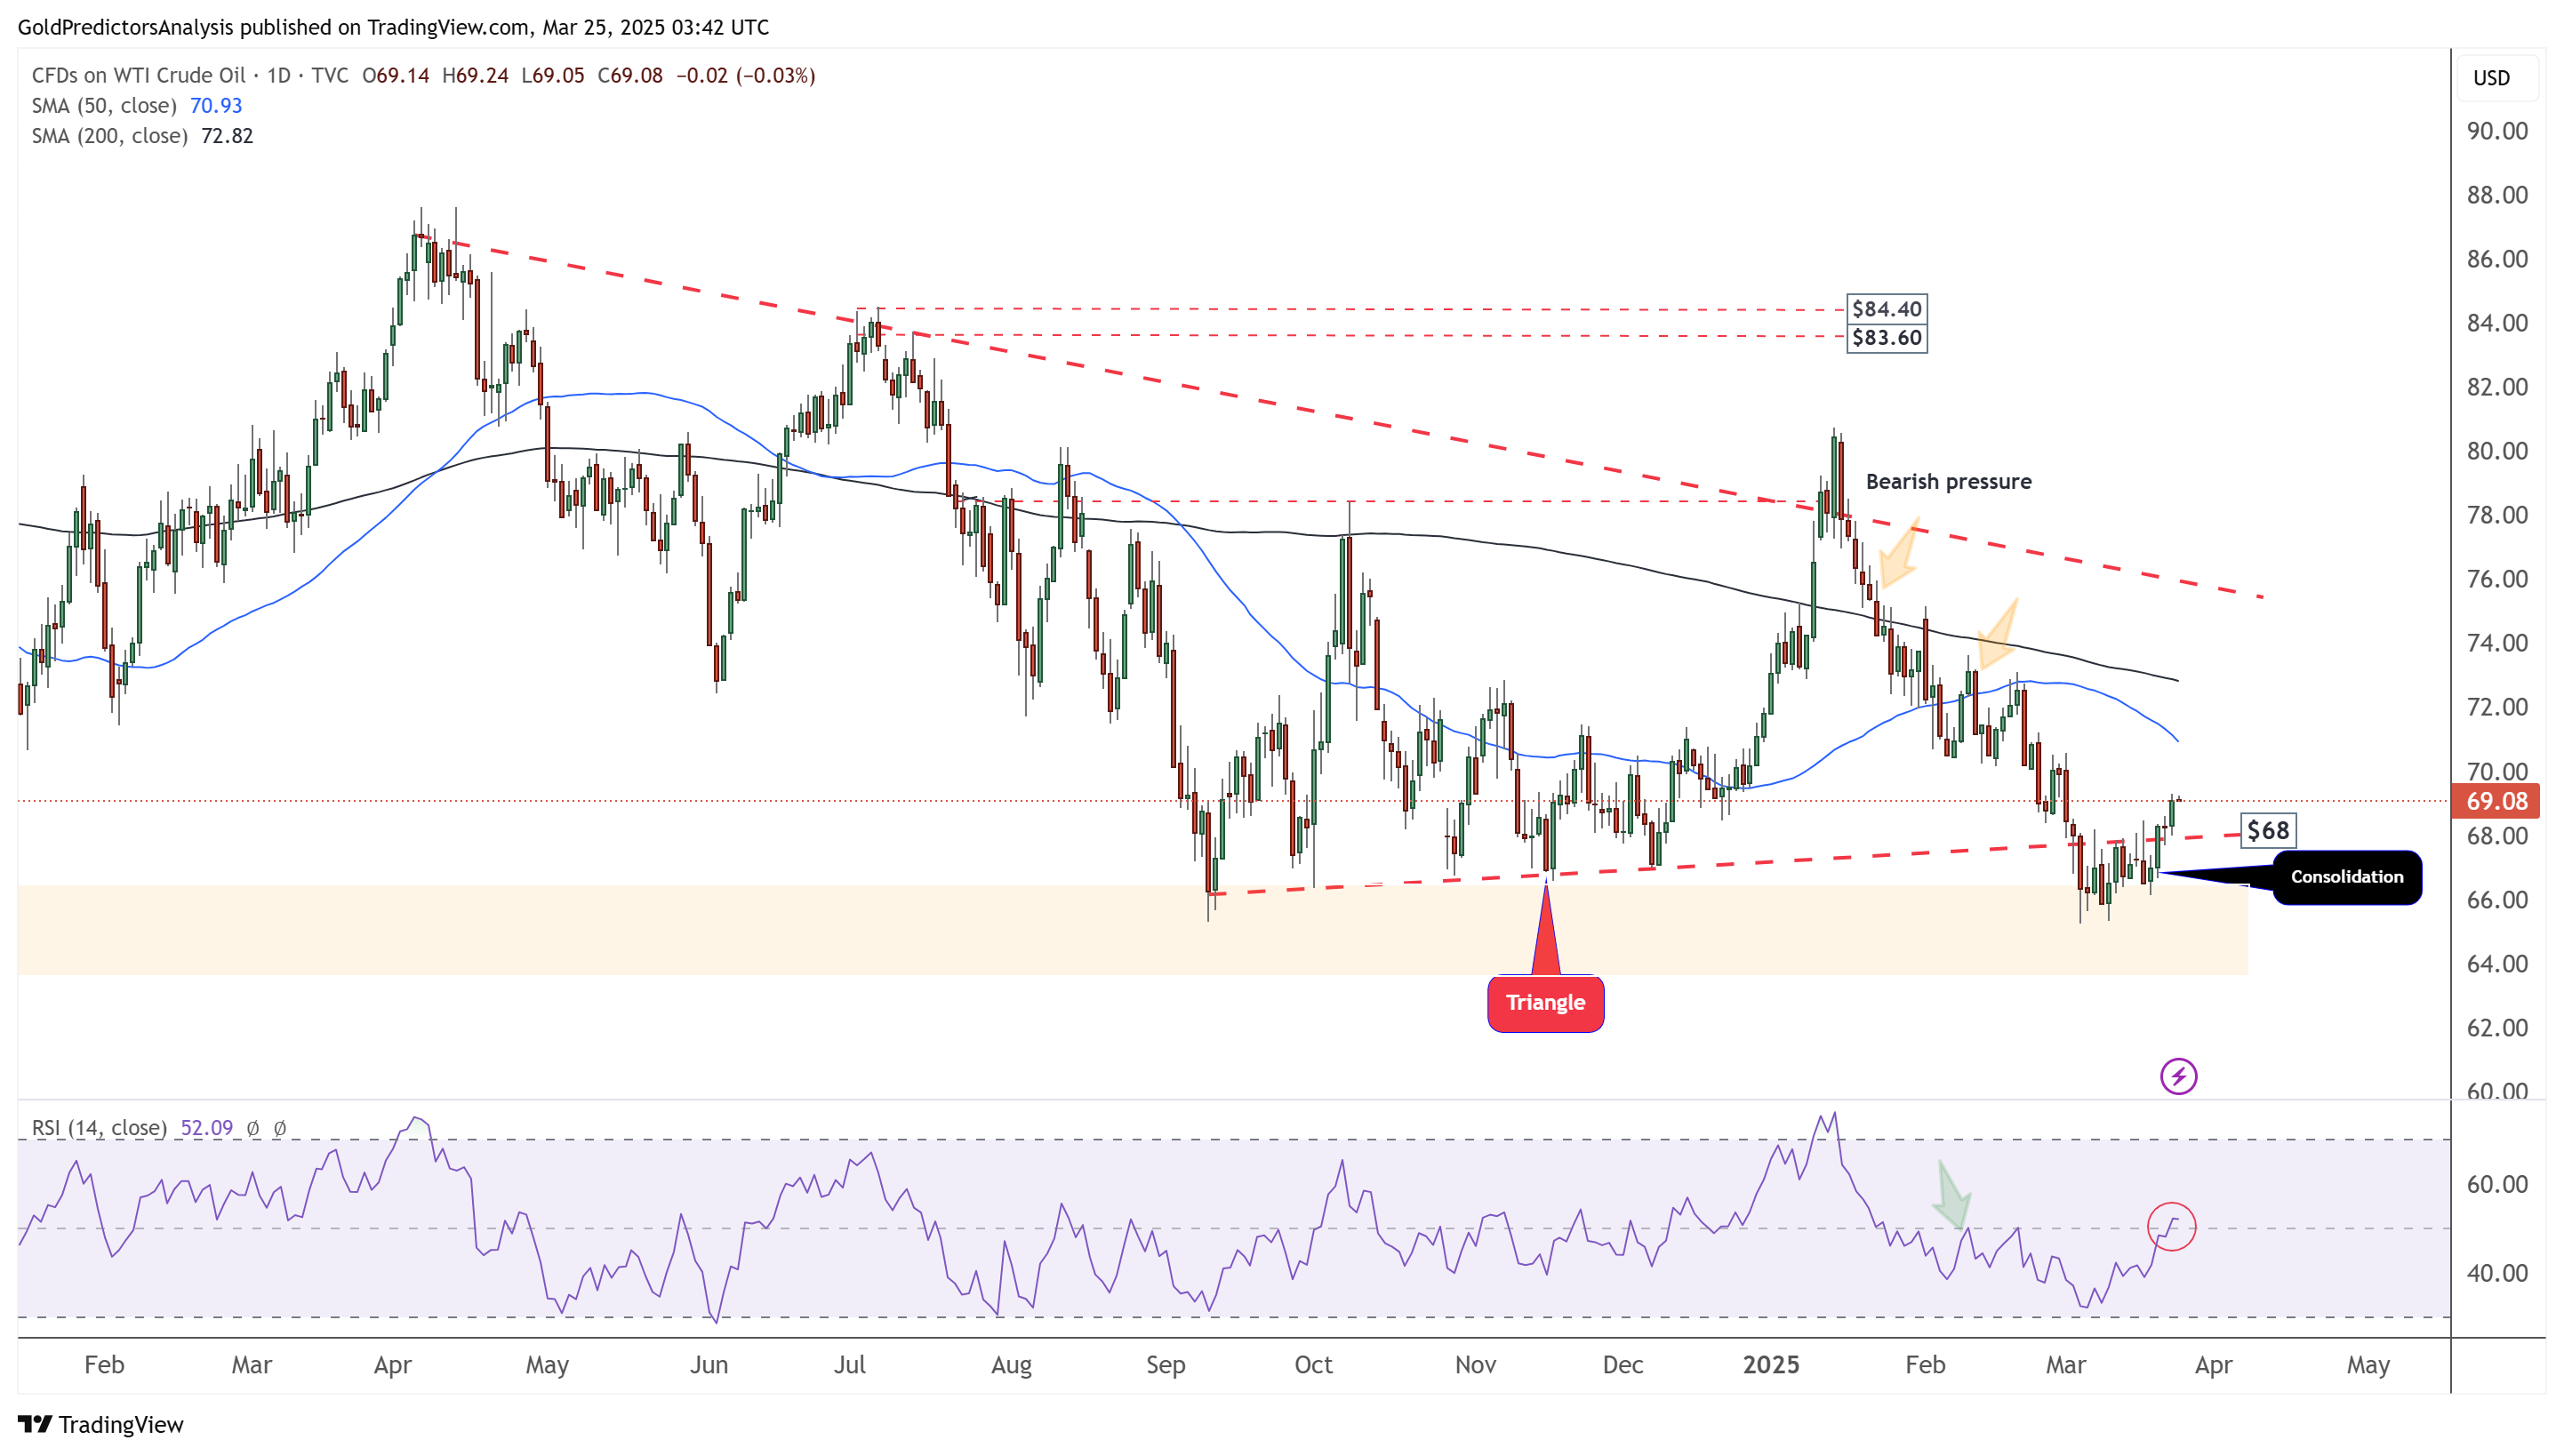
The daily chart for WTI crude oil shows that the price has rebounded from the long-term support zone, highlighted by the orange area. The price has entered a triangle pattern, outlined by the red dotted trend lines. The RSI is pushing above the mid-level, suggesting that the price may continue to increase in the short term. However, the 50-day and 200-day SMAs are turning lower, indicating that this rebound will likely be seen as another selling opportunity, as the overall trend remains bearish.
Oil 4-Hour Chart – Falling Wedge Pattern
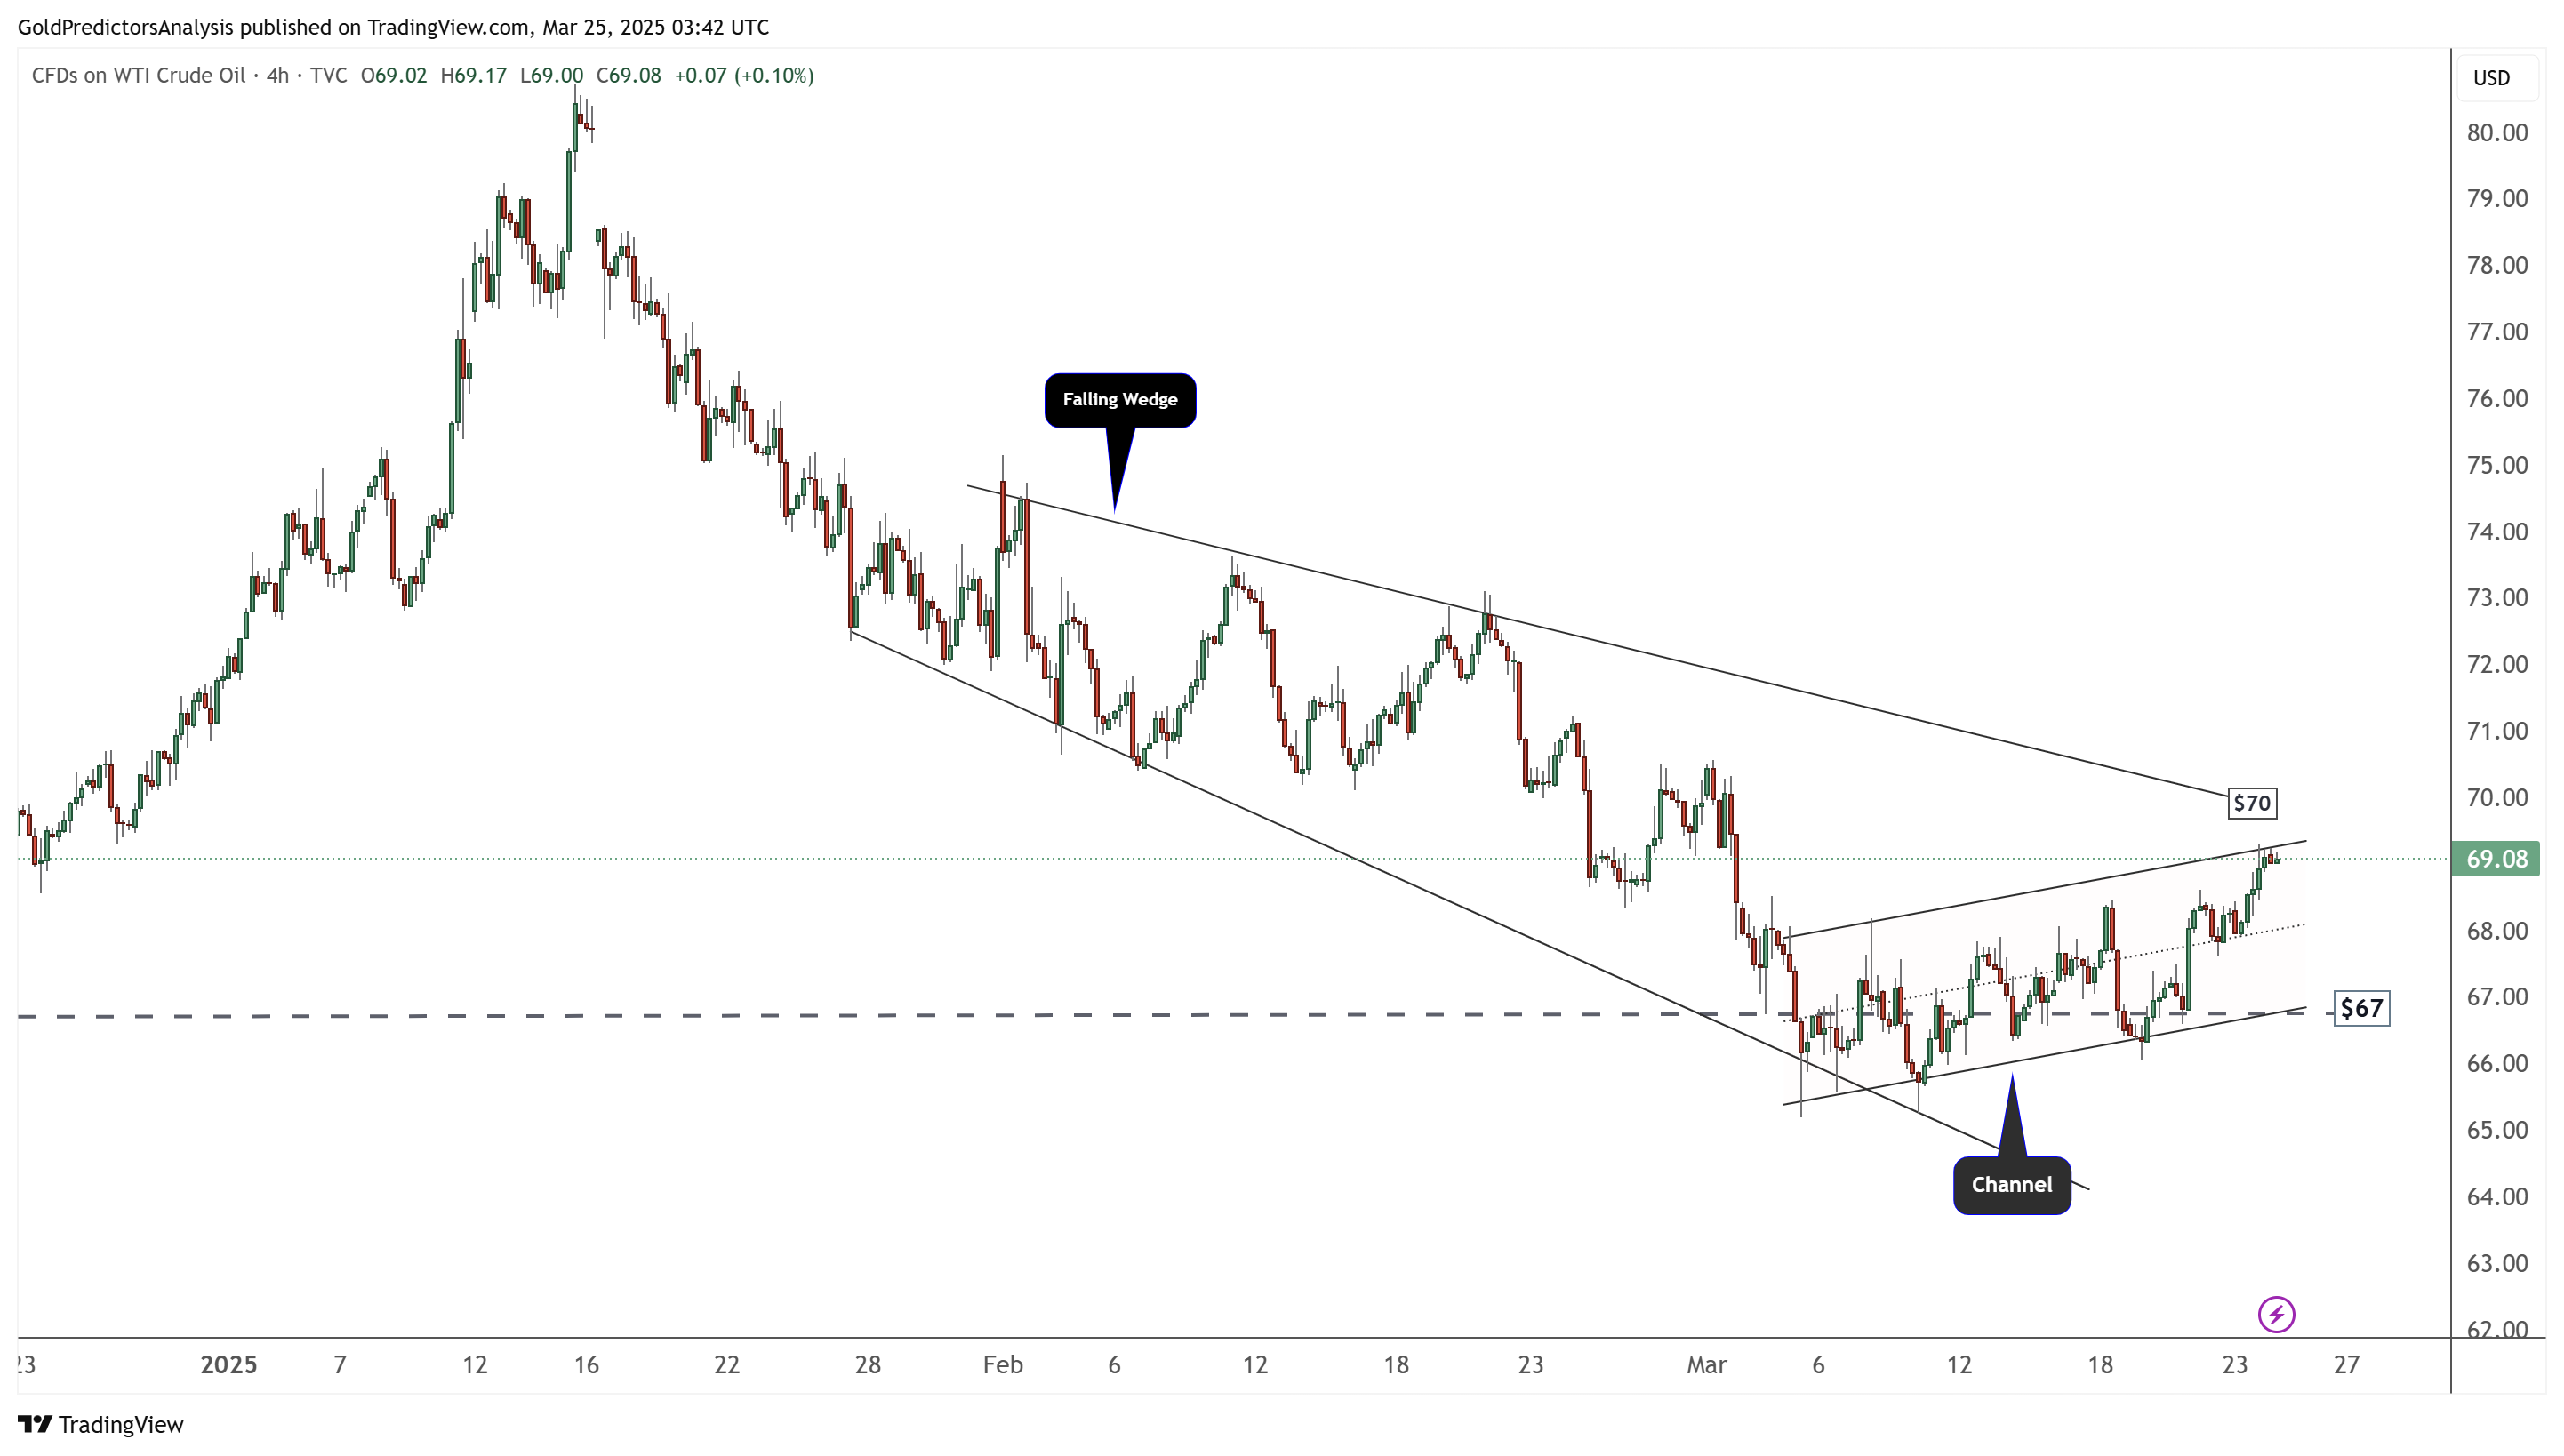
The 4-hour chart for WTI crude oil shows that the price trades within a falling wedge pattern, with the rebound from the long-term support occurring inside the channel formation. The price is approaching the resistance level at $70, and a break above this level may open the door for further gains. However, if the price fails to break above $70 and falls below $65, it would form a bear flag and likely continue moving lower.
Natural Gas Price Forecast
Every new Natural Gas analysis as it publishes, today's technical signal and key levels, live price — on one page.
See all Natural Gas forecastsNatural Gas (NG) Technical Analysis
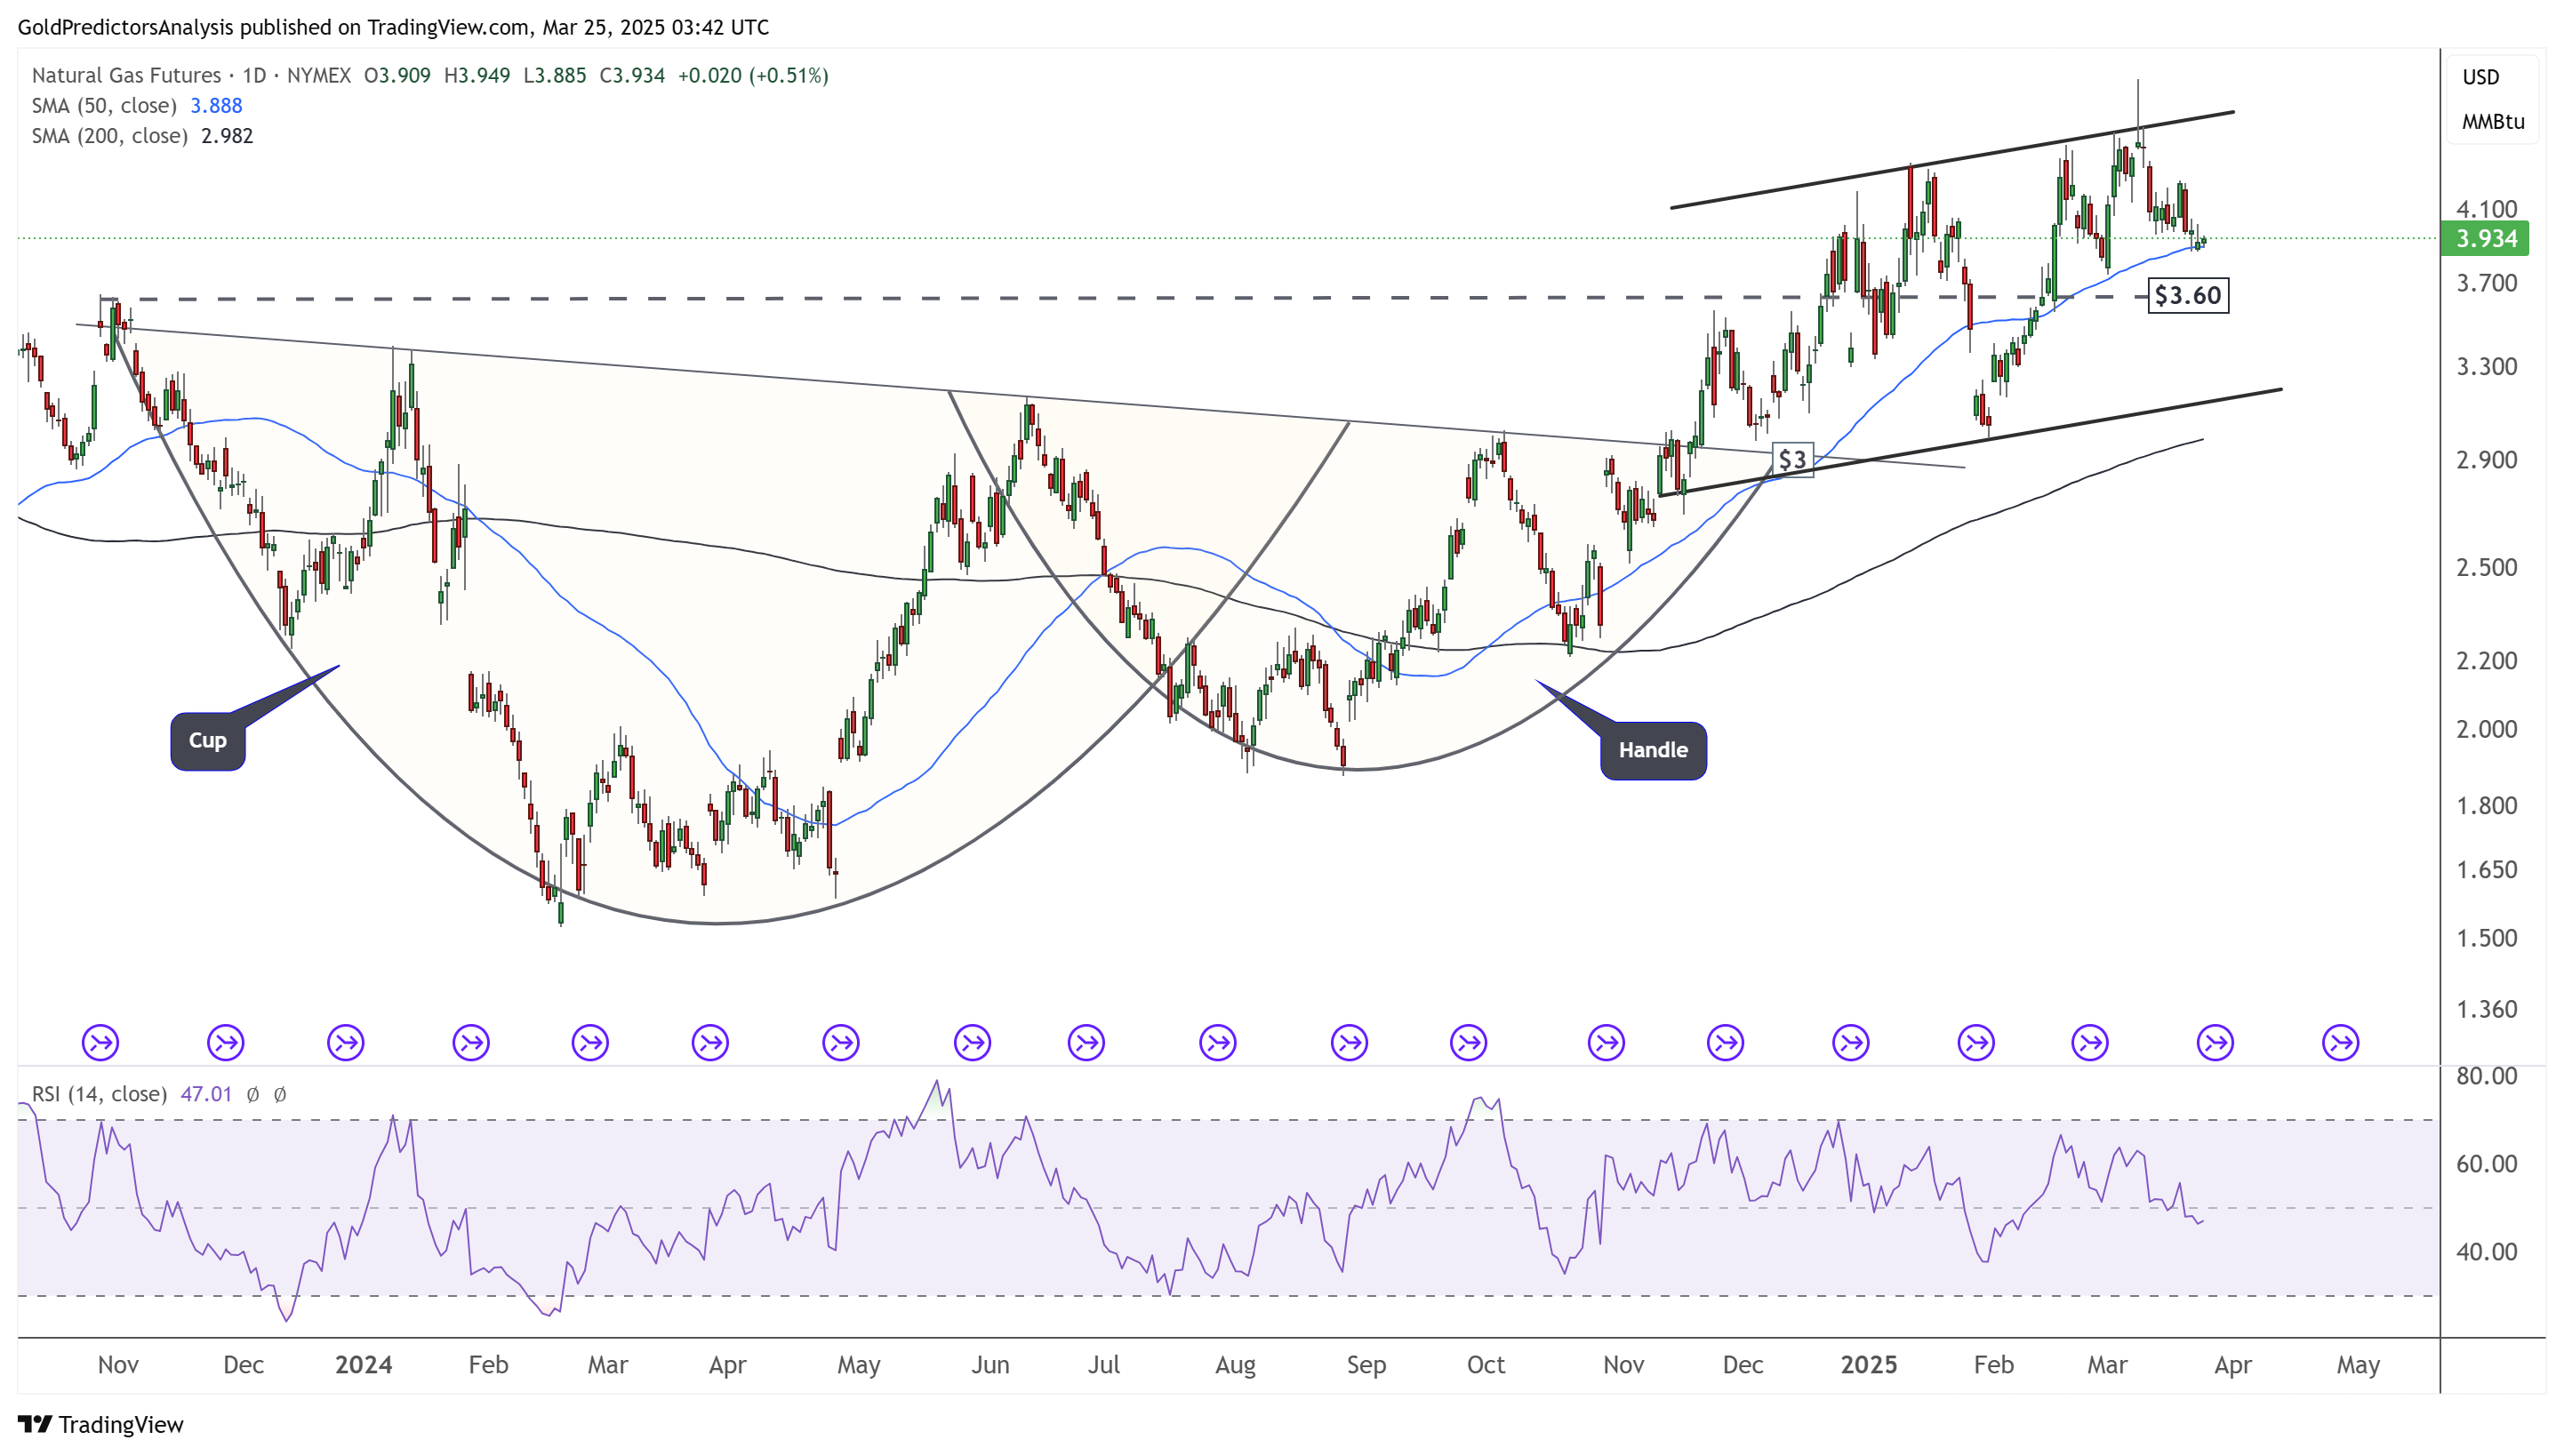
Natural Gas Daily Chart – Ascending Channel
The daily chart for natural gas (NG) indicates a bullish price structure. This structure is formed by a cup and handle pattern, followed by an ascending channel after the breakout. The price trades above the 50-day and 200-day SMAs, signalling a bullish trend. However, the RSI is breaking below the mid-level, suggesting that the price may continue to decline before the next upward move. Despite the expectation of further correction, the overall trend remains positive.
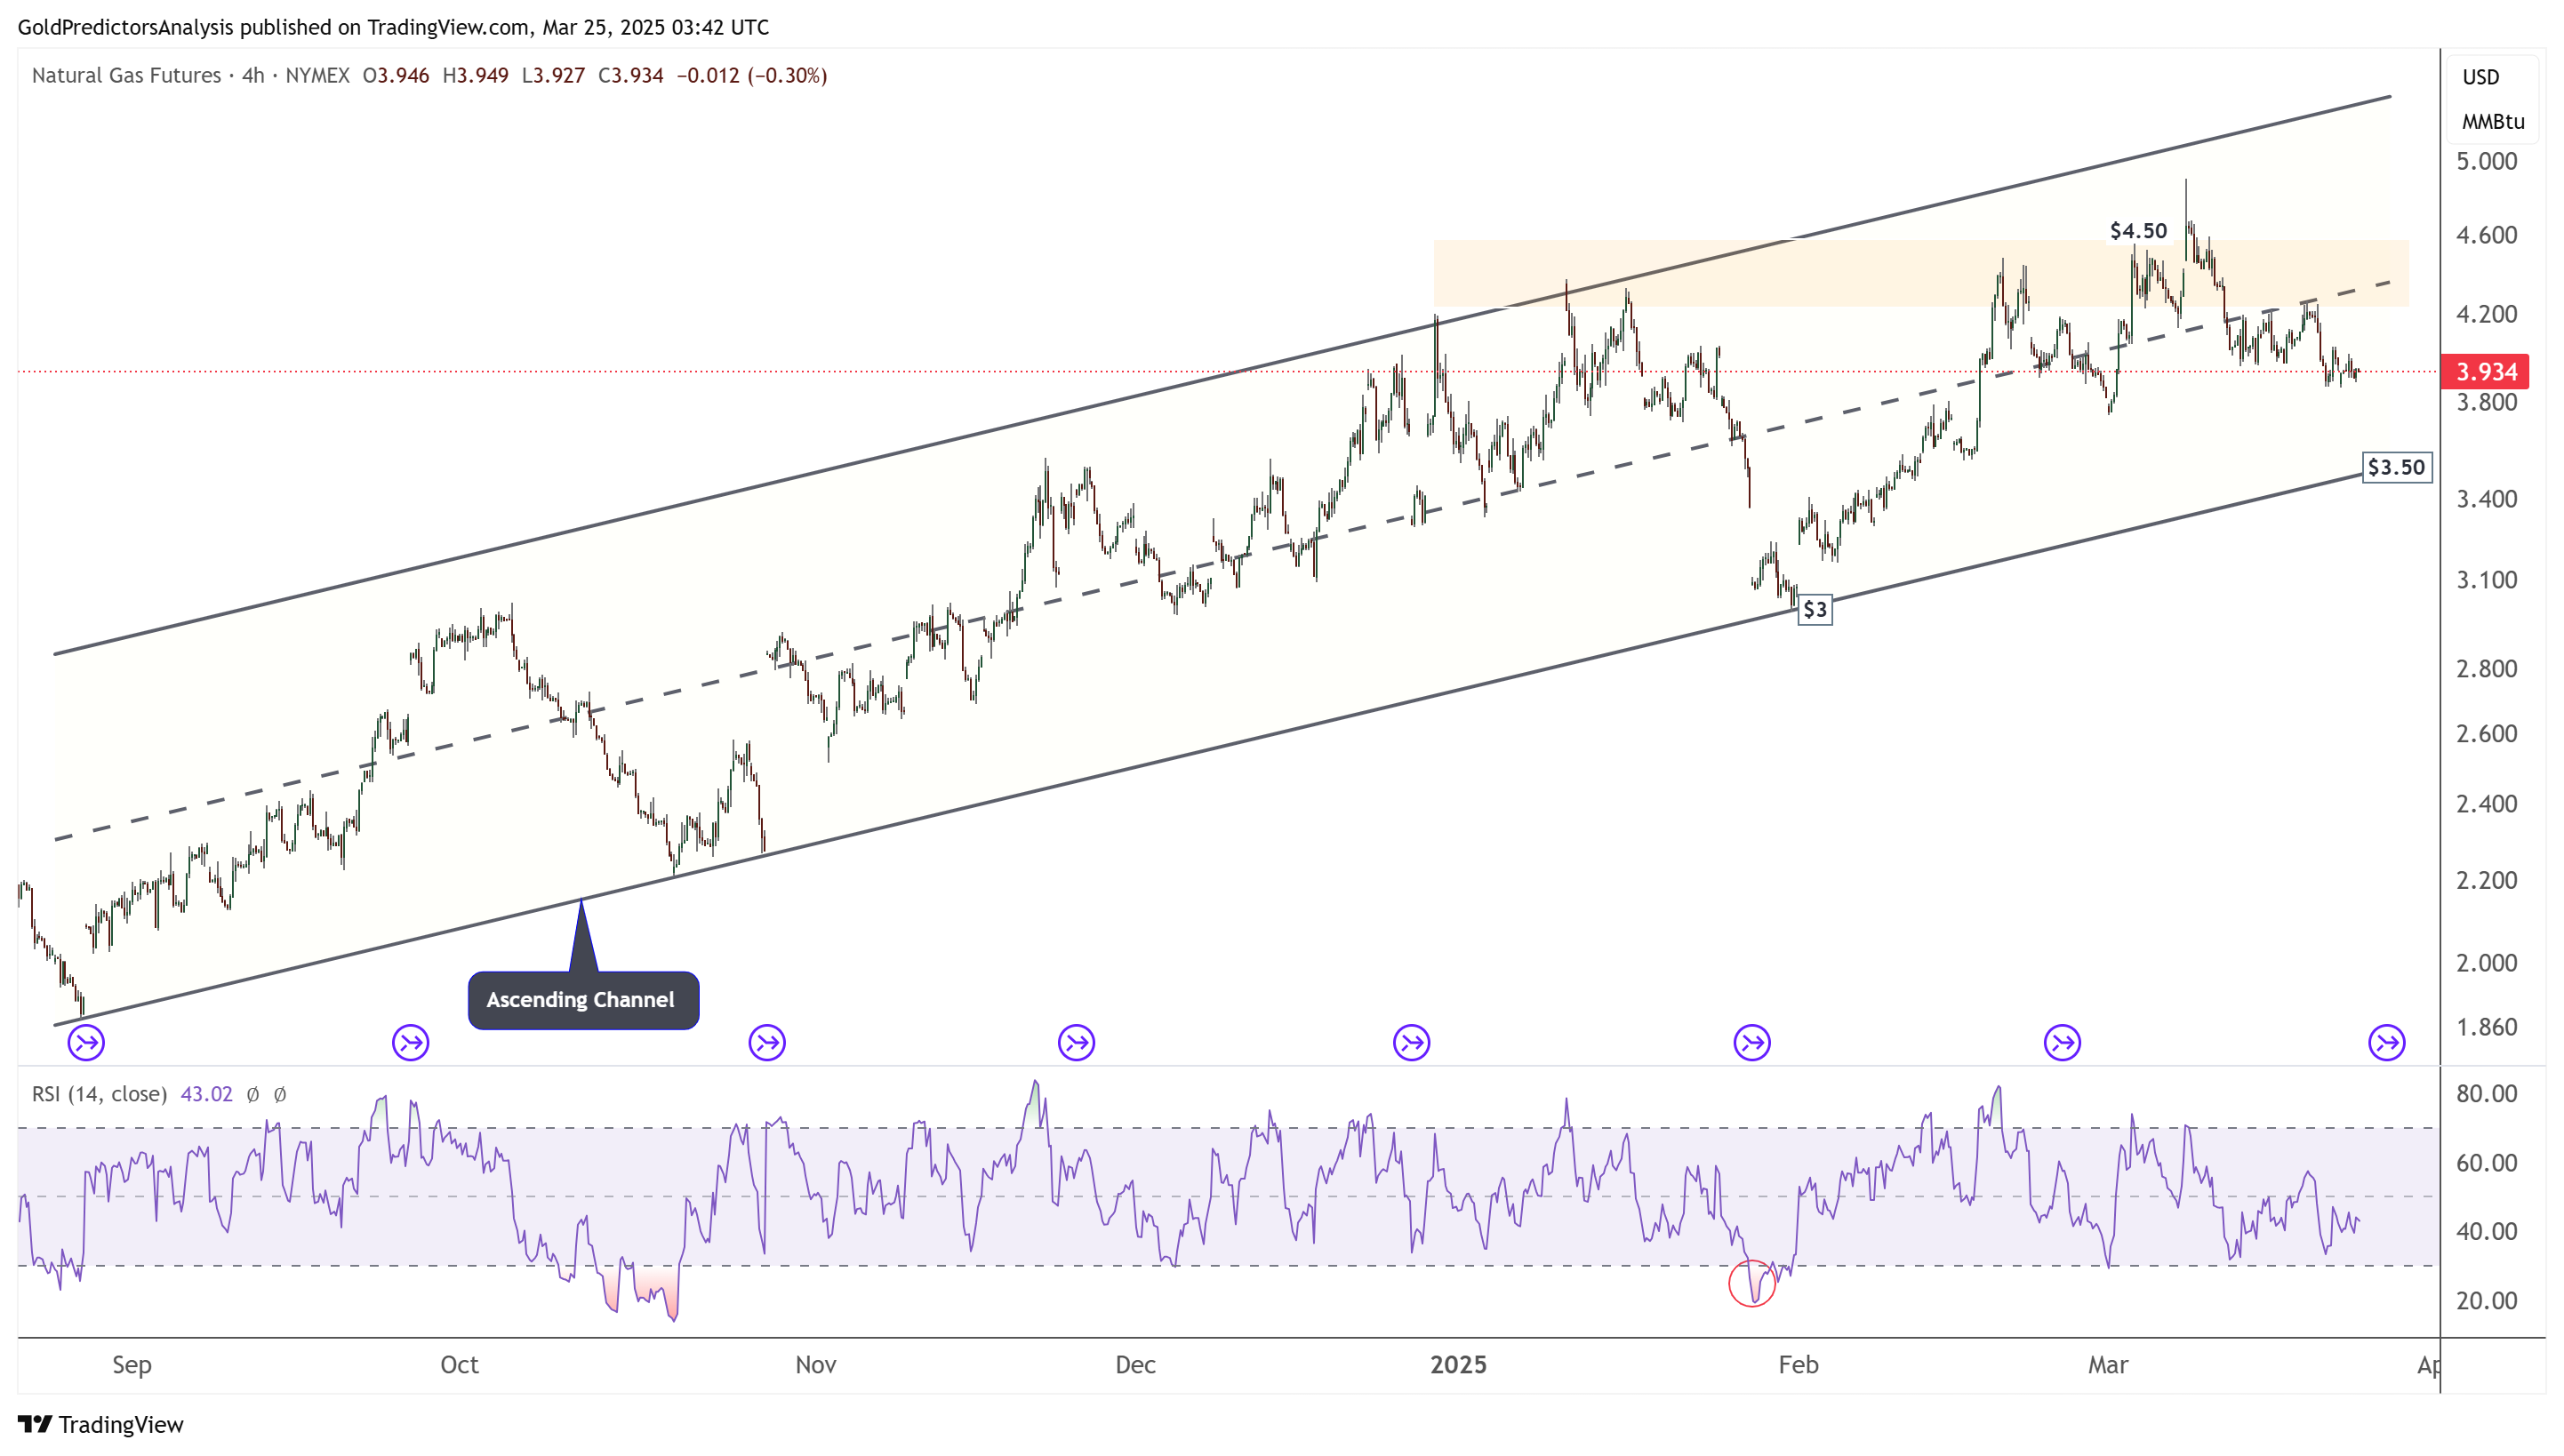
Natural Gas 4-Hour Chart – Correction
The 4-hour chart for natural gas also shows a strong upward trend, with the price signalling a possible correction toward the channel support at $3.50. After this correction, natural gas prices are likely to move higher.
US Dollar Technical Analysis
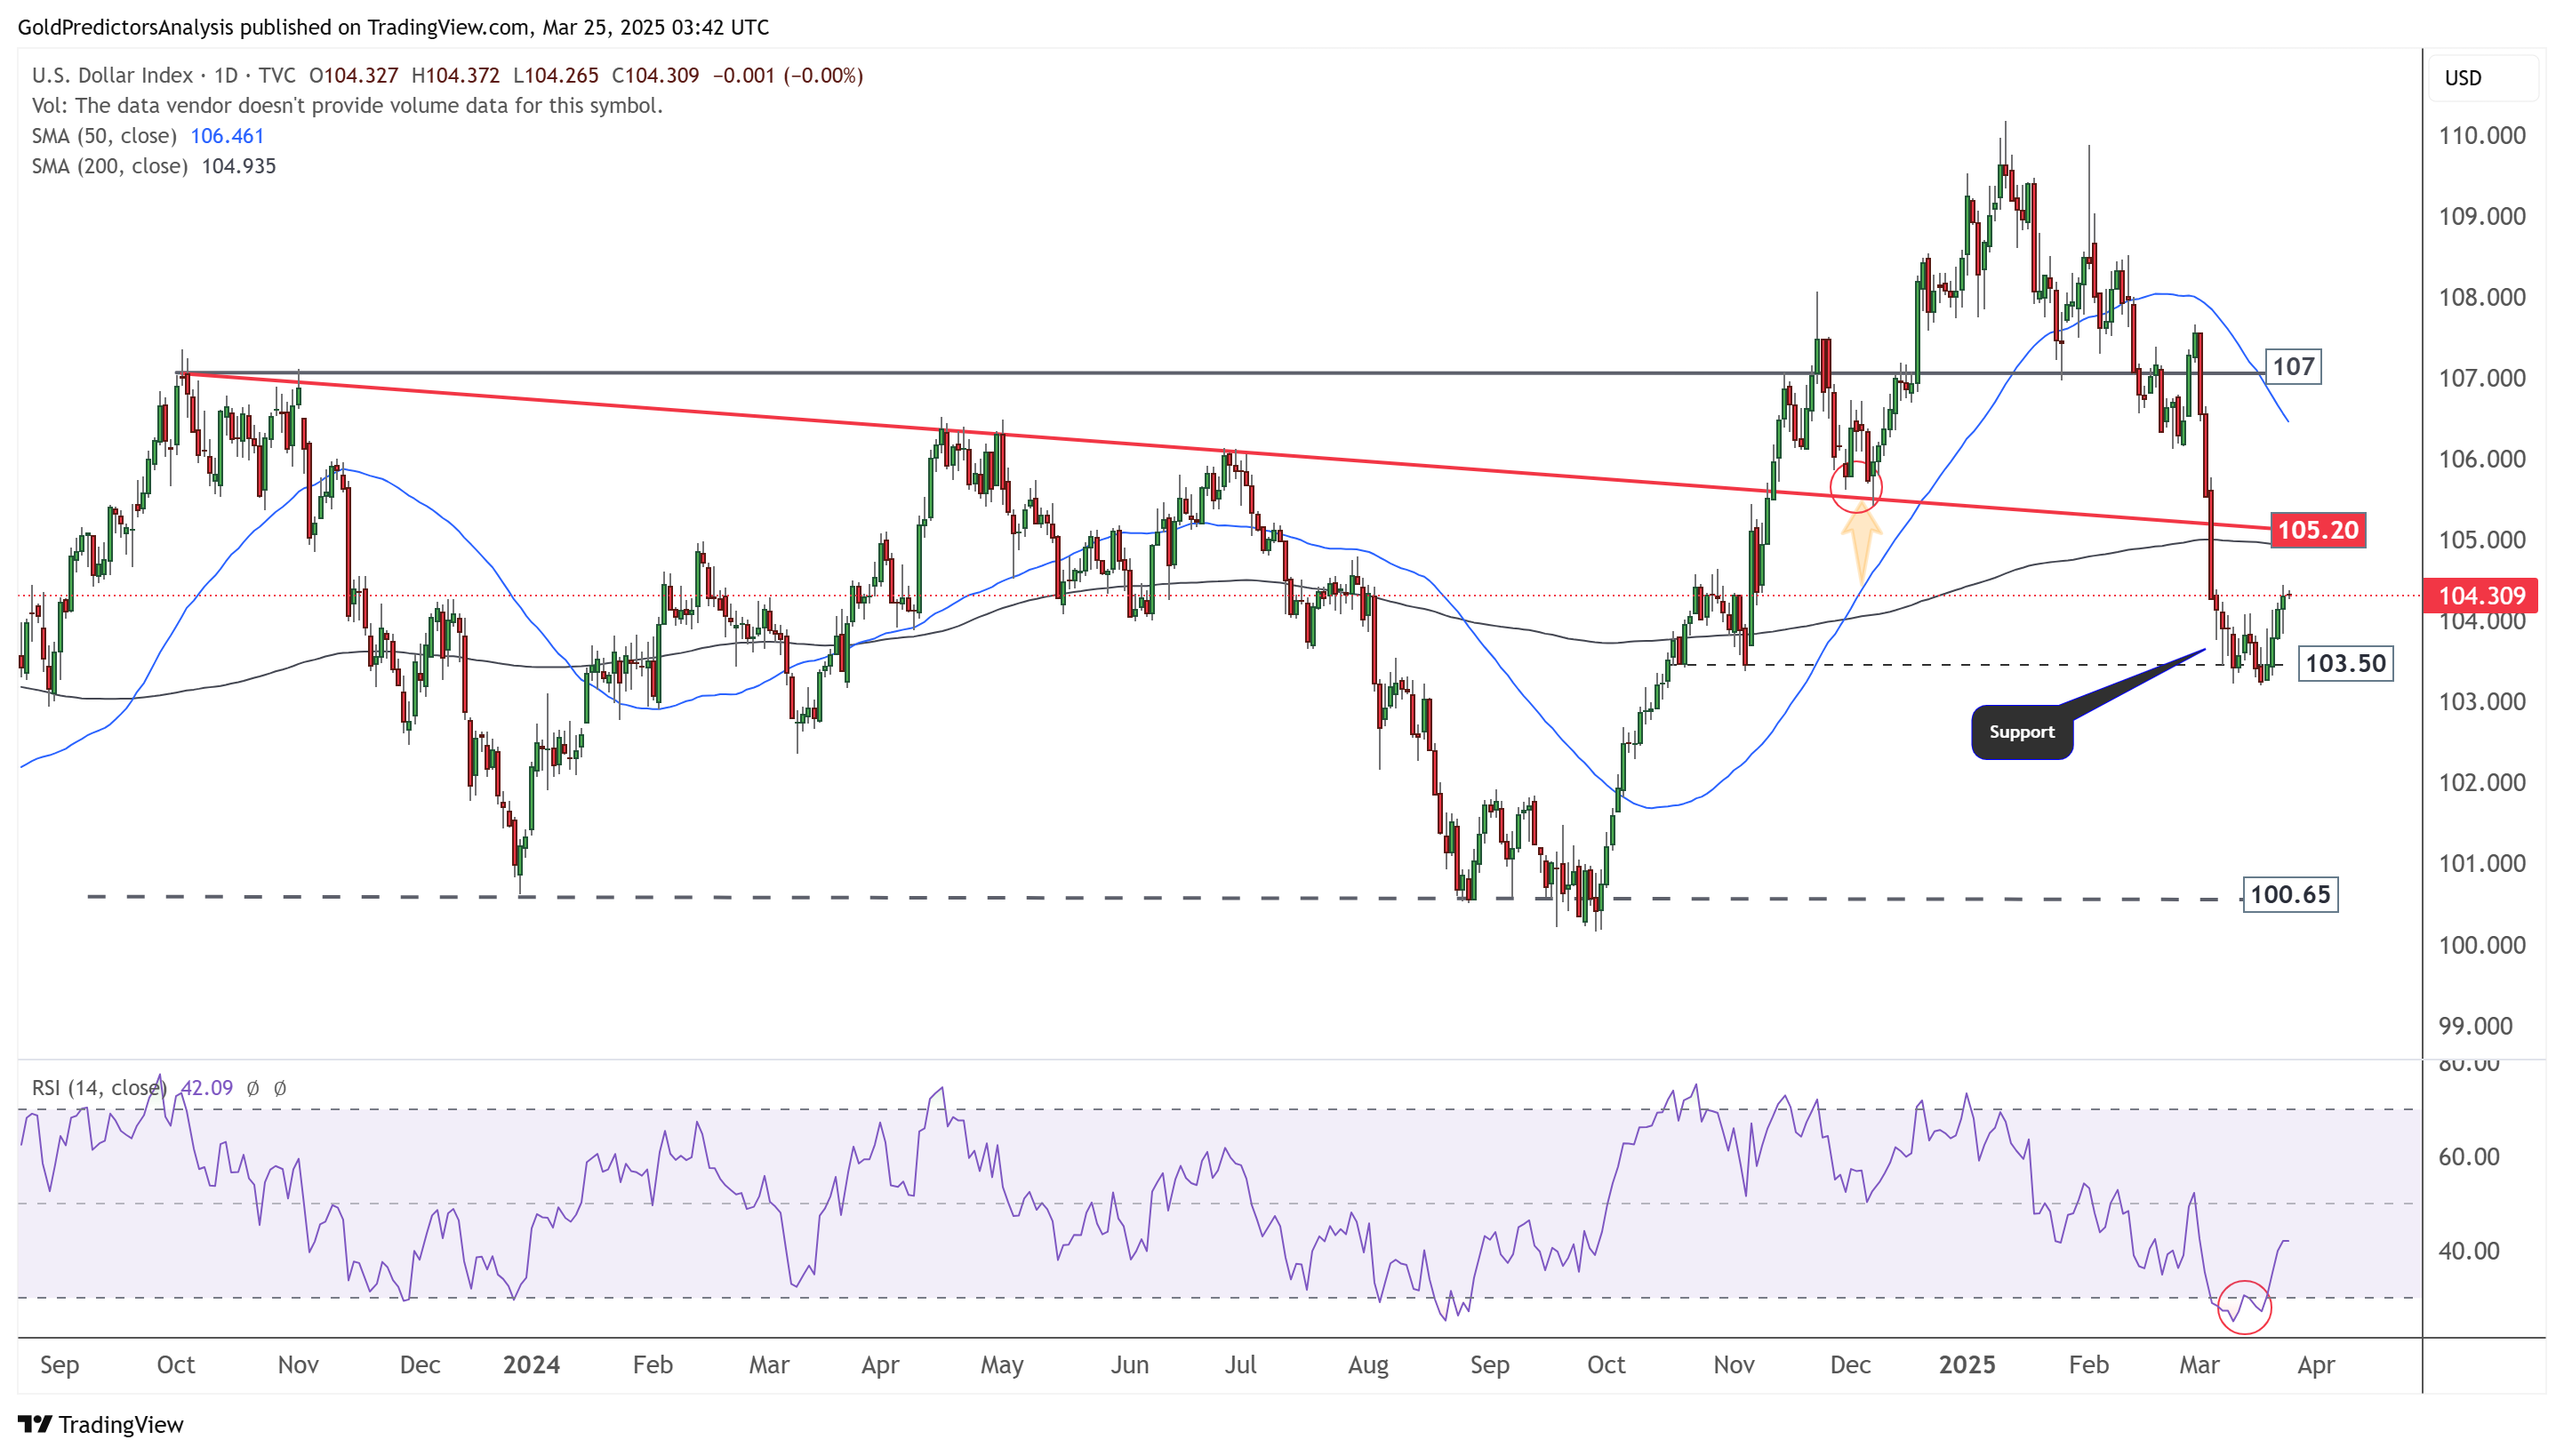
US Dollar Daily – Rebound from Support of 103.50
The daily chart for the US Dollar Index shows that the index is rebounding from the support level at 103.50 and building positive momentum. As the daily chart shows, this rebound has developed due to extreme oversold conditions. However, the 50-day SMA is turning downward, indicating a negative trend. The immediate resistance for this rebound is at 105.20, and a break above this level could take the index to 107. On the other hand, a break below 103.50 would likely push the index toward 100.65.
US Dollar 4-Hour Chart – Rebound
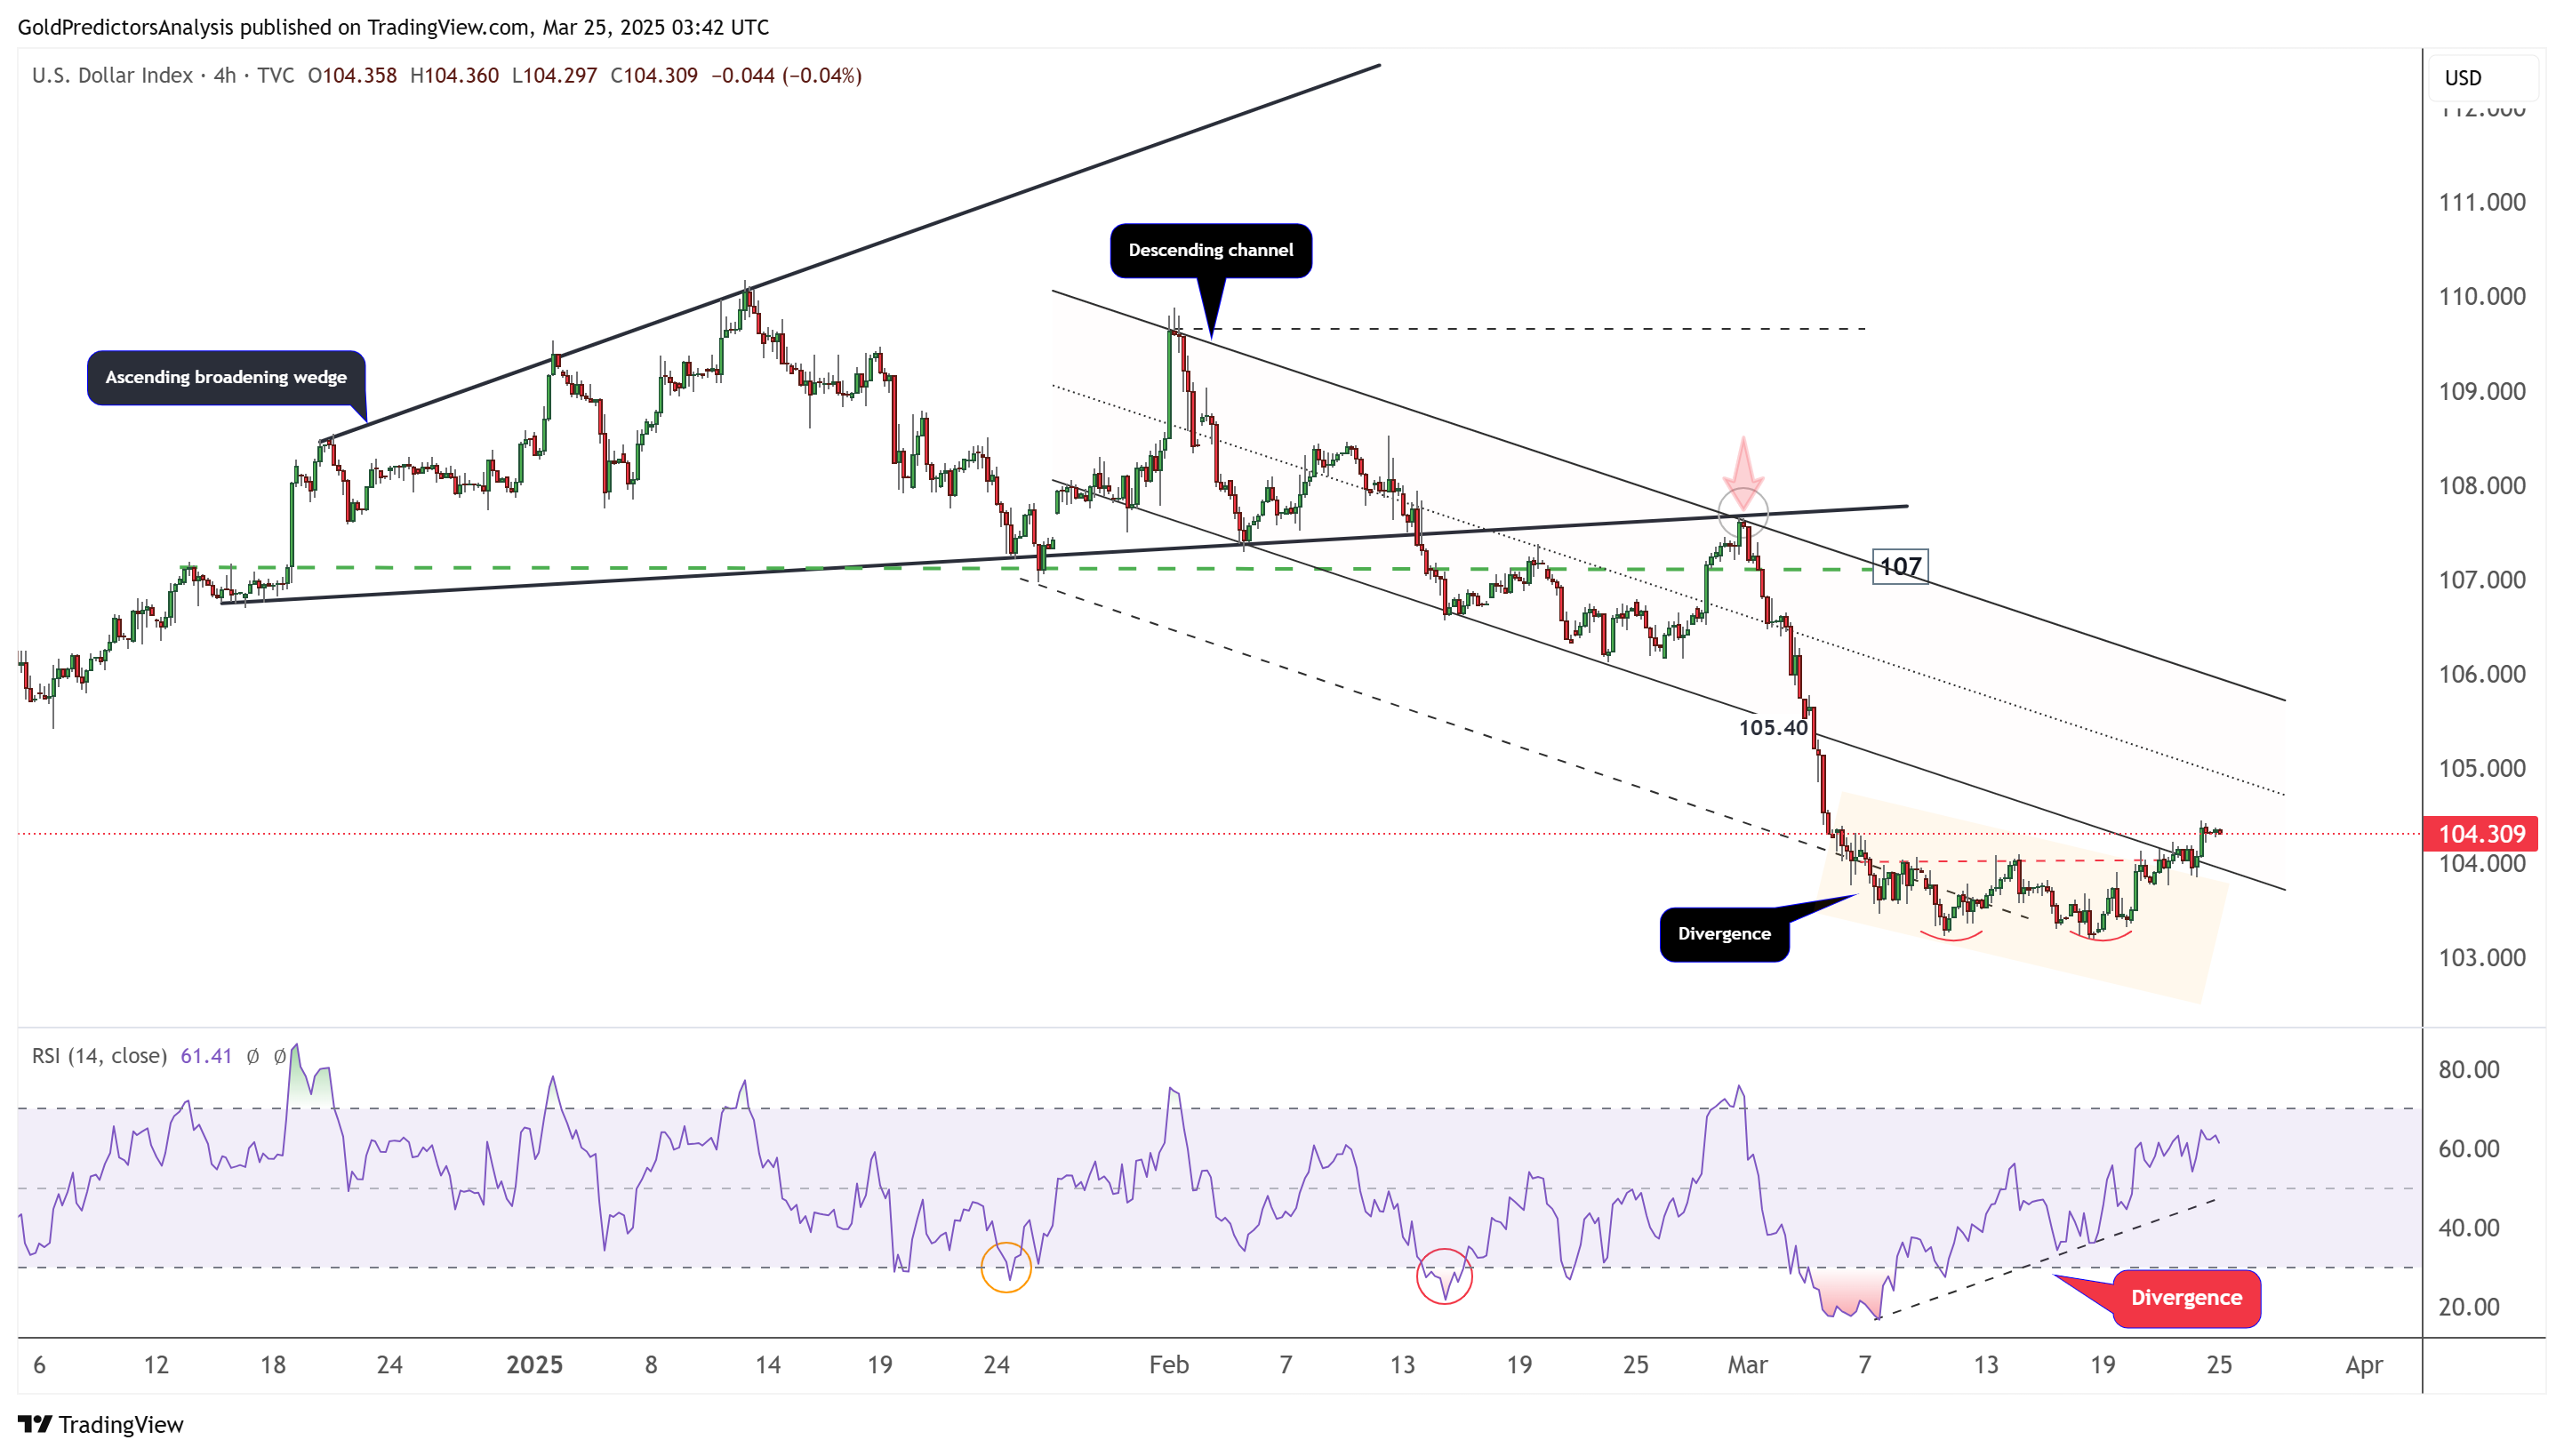
The 4-hour chart for the US Dollar Index shows that the index rebounded after forming a bullish divergence. This divergence occurred when a double bottom pattern formed on the chart. Despite the rebound from oversold conditions, the index remains negative.