



Oil prices continue to drop in early Asian trading on Thursday as fears of disruptions to supply in the Middle East eased. Brent crude oil dropped to near $94 while WTI crude oil dropped to near $86 on Thursday.
U.S. officials downplayed need for further strikes on Iran. The prisoner swap agreement between Russia and Ukraine also increased hopes for ceasefire between the two countries. But any new attacks on tankers in the Strait of Hormuz may increase fears of supply and trigger a rebound in oil prices from the support areas.
OPEC producers pumped about 2 million more barrels a day in October than in September. Saudi Arabia led this increase. The market is now watching U.S. inventory report on Thursday. The API estimates that the U.S. crude stocks increased by 9 million barrels last week. If this data is confirmed by officials, it may ease concerns about tight supply and extend decline in WTI oil.
WTI Crude Oil Price Forecast: $87 Break Puts $80.50 in Focus
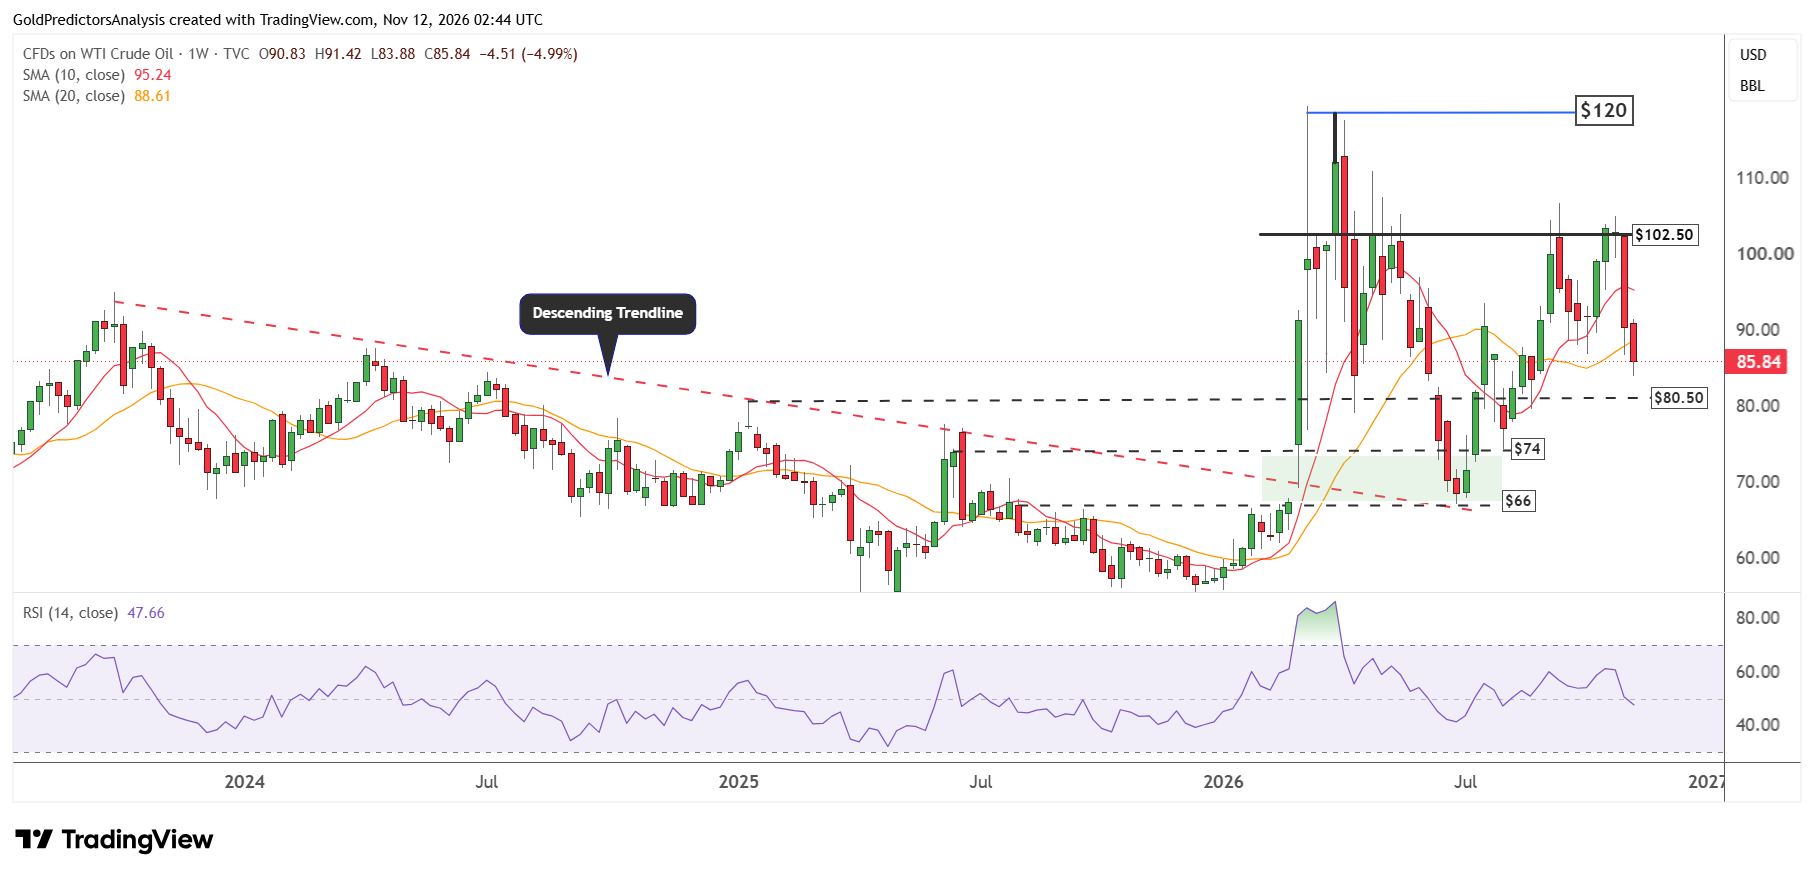
The weekly chart for WTI crude oil shows that the price failed to break above the $102.50-$104 area in October and dropped sharply below support near $87. The price has lost over 4.90% this week as of Thursday which suggests a negative trend in the short term toward the nearest support of $80.50. But a break below $80.50 may push the price towards the $74 area.
When WTI oil trades below the support of $87, the RSI pushes below the midline. If the price closes the week below this level, it will suggest further downside.
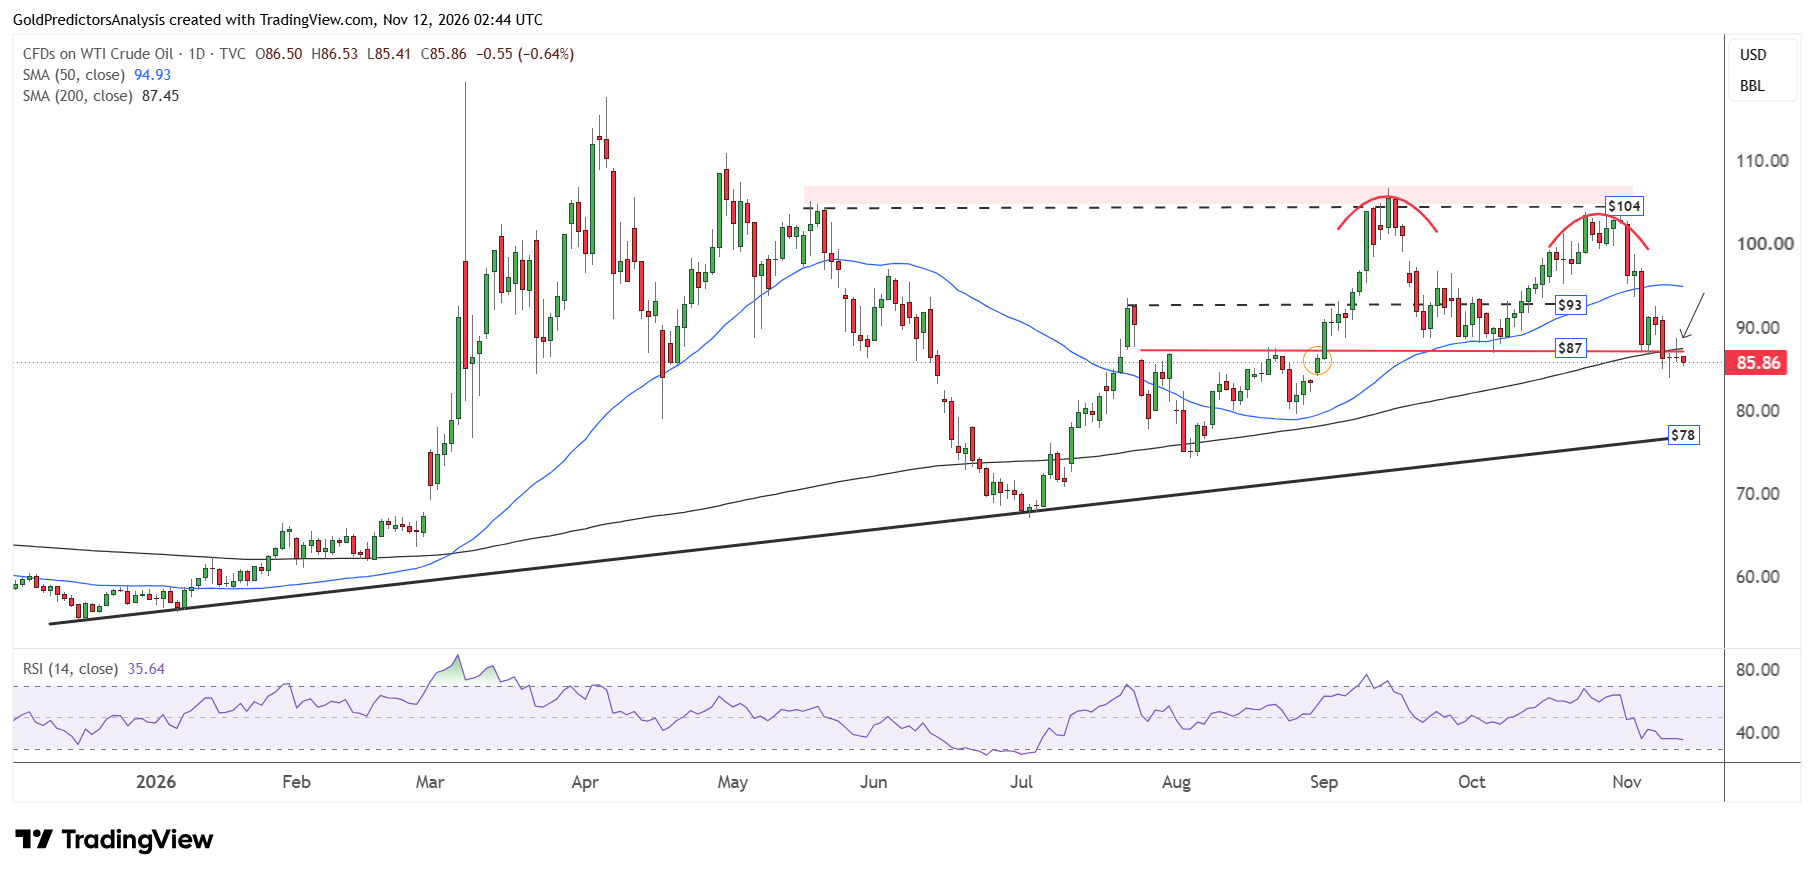
The daily chart for WTI oil also shows the bearish pressure. The chart shows that the price has broken below the 200-day SMA. This breakdown suggests that the nearest support in WTI remains at $78 on daily chart. This support is defined by the ascending trend line that stretches from lows of December 2025. A confirmed break below $78 may open the way for further downside toward $68.
Brent Oil Price Forecast
Every new Brent Oil analysis as it publishes, today's technical signal and key levels, live price — on one page.
See all Brent Oil forecastsBrent Crude Oil Price Forecast: Can $90 Support Stop the Slide?
The daily chart for Brent oil shows that the price remains under bearish pressure in the short term after the breakdown below $95. This breakdown may push price to the nearest support at $90.
A confirmed break below $87 may push the price towards the support of $80. This support is seen using the ascending trend line that stretches from lows of December 2025.
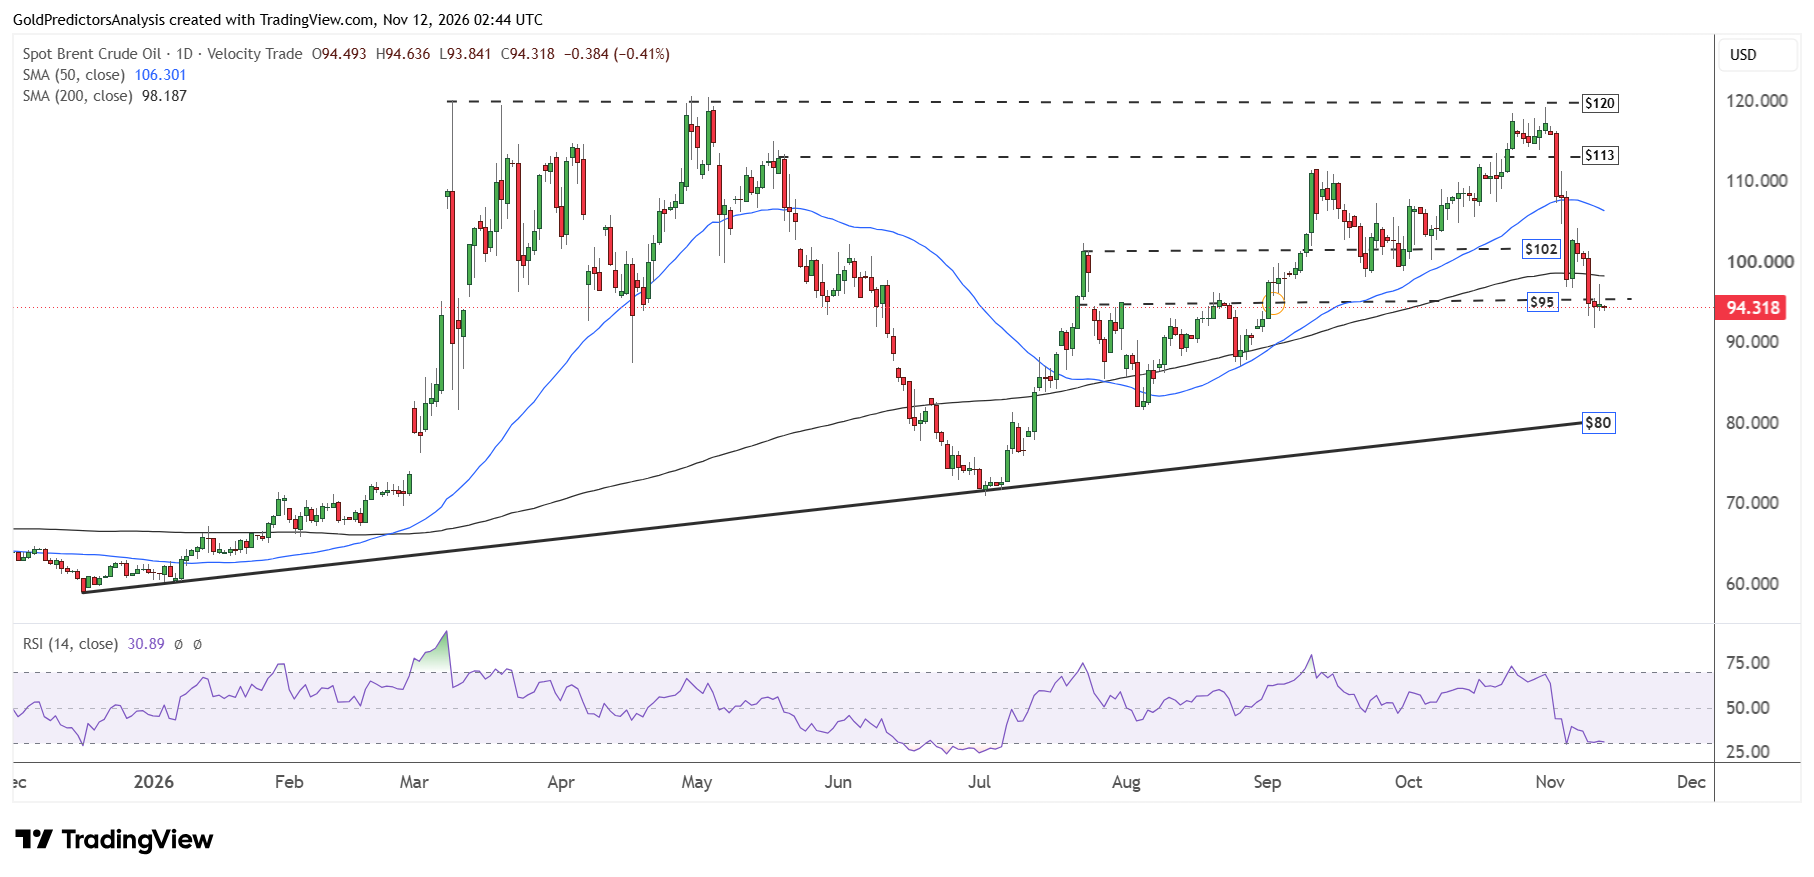
But the RSI has now reached oversold levels on the daily chart which suggests that the price may rebound soon. The resistance of $98.20 at the 200-day SMA may limit the rebound in Brent oil. A break above $98.20 may push the price towards the $102 level.
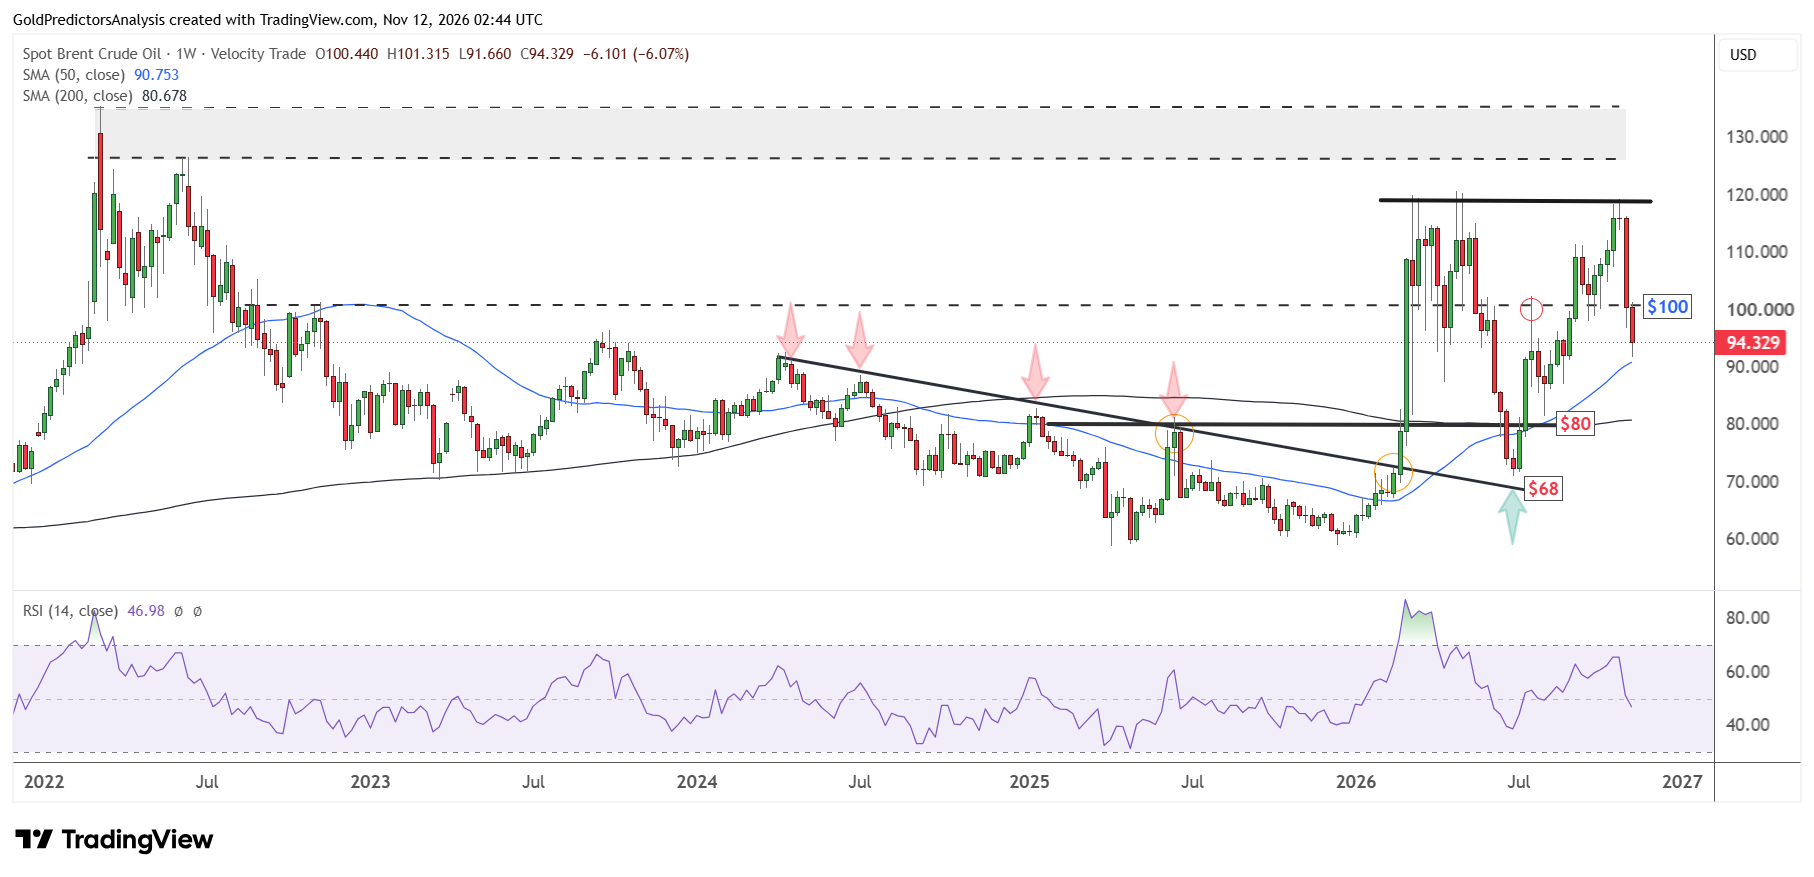
The weekly chart for Brent oil also shows that the price remains under pressure after it failed to break above $120. The price has lost more than 19% during the past two weeks.
But the price is now approaching support at the 50-week SMA and may require a rebound above $100 to initiate rally. A break below the 50-week SMA at $90 could push price to the $80 area.
What to Watch Next
Oil prices remain under pressure and may further drop if the US inventory data confirms an increase in crude stocks. A weekly close below $87 in WTI oil may push the price to $80.50. A break below $90 in Brent oil may push the price to $87. Crude oil prices remain under pressure in the short term. However, any new attacks on tankers in the Middle East or any escalation in tensions between US and Iran may renew fears of supply and spark a rebound in oil prices.
Read more: WTI and Brent Extend Losses as Iran Strike Fears Ease