The OPEC+ decision to keep production stable until 2026 comes as the growing surplus of offshore crude oil is finally being transferred to onshore stocks, a move that points to increasing downward pressure on the physical market.
Despite favorable seasonal demand and limited US inventories, rising global surpluses and OPEC+’s slow response are shaping a divided market characterized by conflicting bullish and bearish forces.
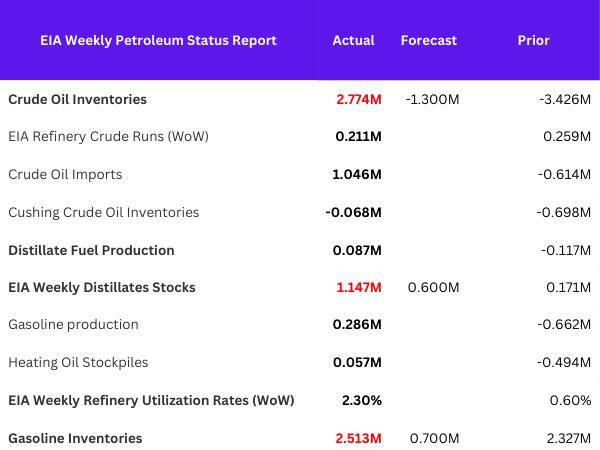
WTI gained +0.86% (+$0.50) over the week, trading between $58.05 at the open, $59.64 at the high, $57.10 at the low, and $58.48 at the close. Crude oil inventories stood at 2.774 million, which diverges sharply from the forecast of -1.300 million and the previous draw of -3.426 million, highlighting a significant shift toward oversupply.

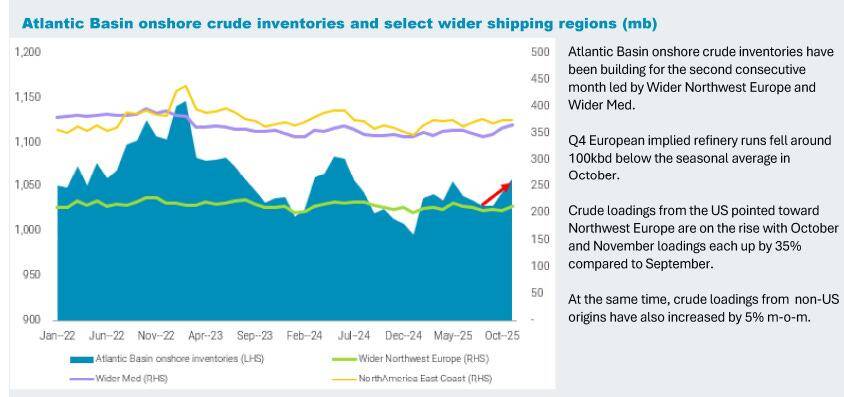
Massive Inventories Building Onshore
There are several US oil industry figures discounting the storage ‘Glut’. They are only observing the forward projection data and their own US storage levels, which are tight. However, we go on facts and what IS rather than what will be. The glut is indeed landing into onshore storage now. We saw this starting to happen last week. We can now see further upward inflections, thanks to Vortexa, in this onshore storage.
OPEC+ Maintains Steady Strategy
OPEC+ kept production policy unchanged, reaffirming existing output levels through 2026 and offering no supply relief to a market already struggling with a mounting crude-on-water glut. The statement is pure continuity: no new cuts, no recalibration of the planned unwind, and no acknowledgement of weakening physical balances. The only meaningful development is the approval of a unified Maximum Sustainable Capacity framework, a clear precursor to the political fight over 2027 baselines. In brief, the MSC, will now allow each member country to know exactly how much spare capacity they can ramp up and run for a year, without destroying the integrity of the reservoirs.
Expanded JMMC authority signals quiet concern, but the group remains reactive rather than proactive. Net effect: a structurally bearish tilt in the near term, with OPEC+ betting Asia will absorb the excess while they manage internal tensions over future market share.
Key decisions
Brent Oil Price Forecast
Every new Brent Oil analysis as it publishes, today's technical signal and key levels, live price — on one page.
See all Brent Oil forecasts- Cuts stay: 3.2 million bpd locked in through 2026.
- No new supply in Q1-2026 from Saudi, Russia, UAE, Kuwait, Iraq and others.
- New 2027 rules: quotas tied to real capacity, boosting Saudi/UAE influence.
How Did the Glut Become so Big?
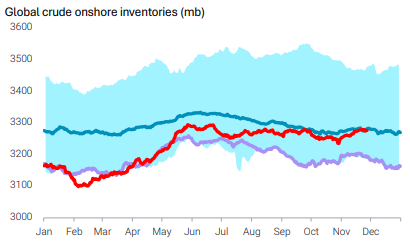
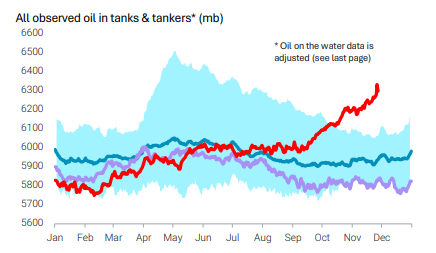
From KPLER:
The sharp rise in OOW (oil & water) volumes since September reflects a combination of temporary disruptions, sticky mid-cycle factors and deeper structural shifts. Short-term issues such as refinery maintenance, technical outages and Chinese quota constraints have amplified the build. However, a substantial share is rooted in medium- and long-term dynamics.
These include Atlantic-heavy non-OPEC+ supply growth, OPEC+ unwinding production cuts, resilient sanctioned flows and sanctions-related dislocations in Asia. In parallel, real-time supply–demand data confirms that the global balance is currently in net surplus, with part of that length materialising directly as barrels on the water.
Crucially, the increase in OOW reflects logistical timing and refinery availability constraints rather than a collapse in end-user and by extension crude demand. Strong refining margins reinforce that product markets remain tight, meaning that despite a looser crude balance, the OOW build is not in itself overwhelmingly bearish.
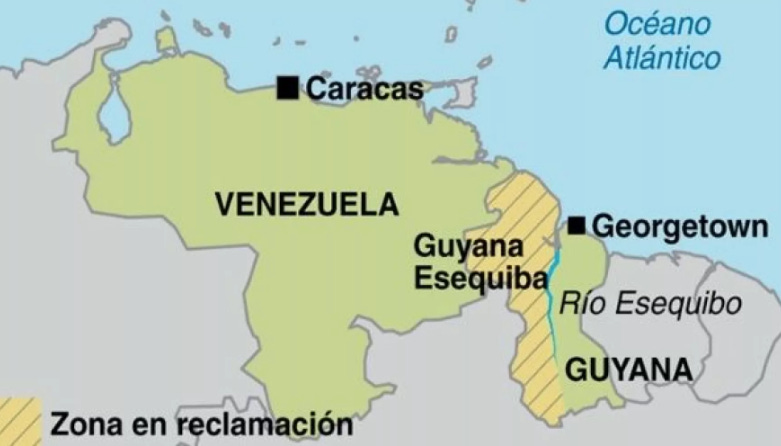
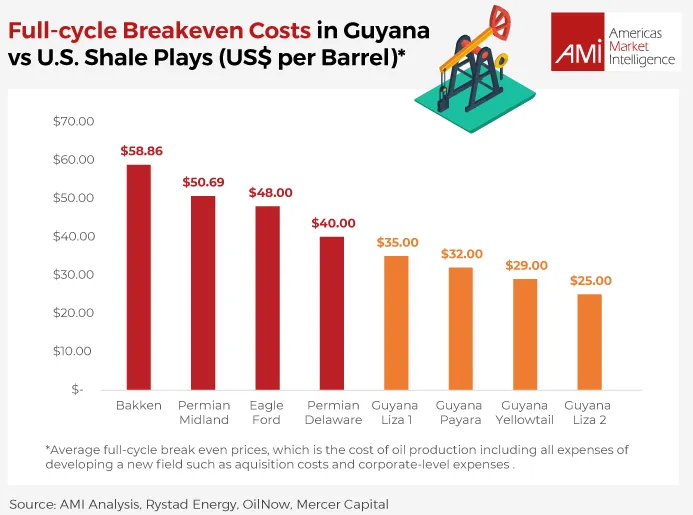
Time to discuss Guyana
This is the largest sleeping giant in the oil game at the moment. And it’s super cheap to extract. It just so happens that US forces have been building in the coast here. Fighting a drug war and evil dictatorship? I think we have seen this movie a few times before.
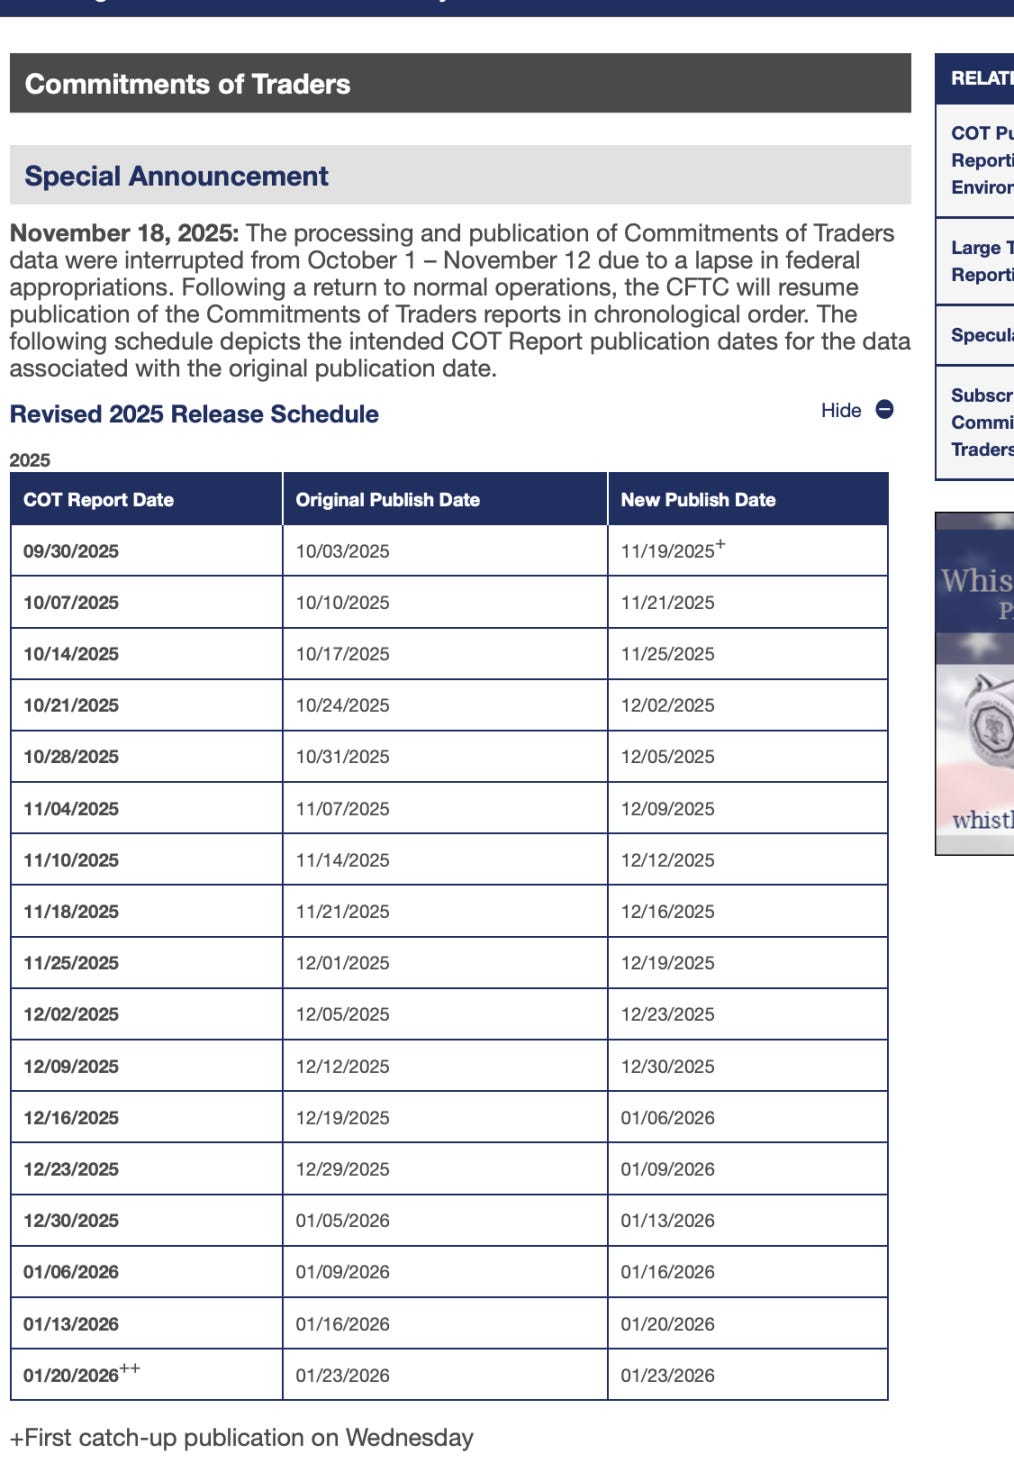
The C.F.T.C has published their method of catching up to normal scheduling. They will publish each Tuesday and Friday until the 23rd of January. The report on the 23rd Jan will be data captured that week. Until then, the data will be extremely lagging. So until then, I will refrain from publishing analysis on C.O.T.
Where is the Market Headed Next?
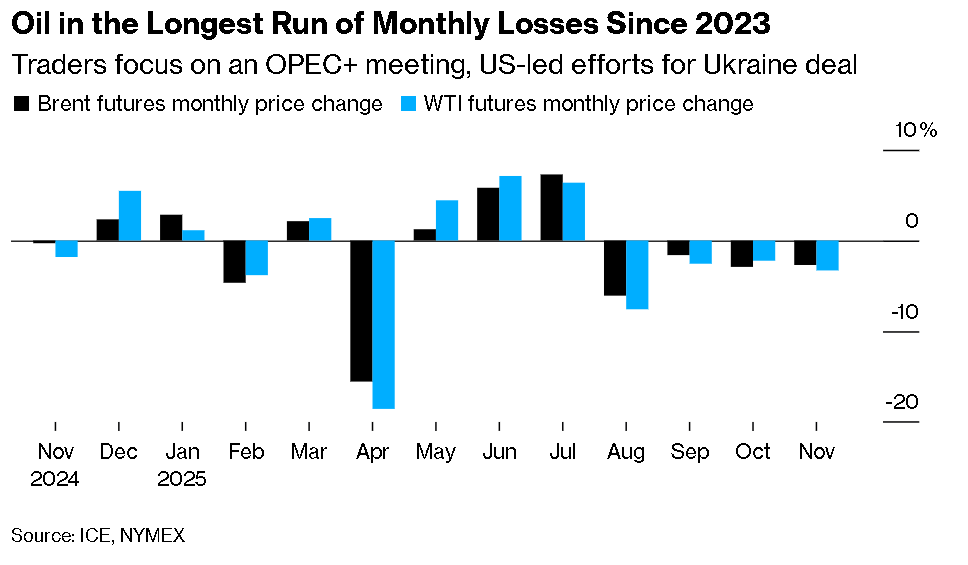
There is no doubt the OPEC+ meeting has provided the upside catalyst on oil since electronic reopen. Currently, high of day is at QVWAP, with sellers defending this area. This is what we call an IPB Short at QVWAP. Should the market fail to make it over this level today, it is a sign that the OPEC freeze on production levels has been over bought. For me, the news is not that bullish at all. It is simply OPEC standing back and taking a pause. If anything, it is just giving the market confidence against any hikes until the end of Q1 26. Is that so bullish? I don’t think so personally. It’s just a ceasefire deal in the price war for 4 months. It is also OPEC trying to stave off a drop to or below $55.
HOWEVER, I can not be that bearish at this time of year. Seasonality bull factors are about to kick in. So I am taking a neutral stance. On the bull side, we have the OPEC pause, tight North American stores, rig count -12 last Friday and oil seasonal demand about to hit. On the bear case, we have an oil on water OOW glut that is landing into storage.
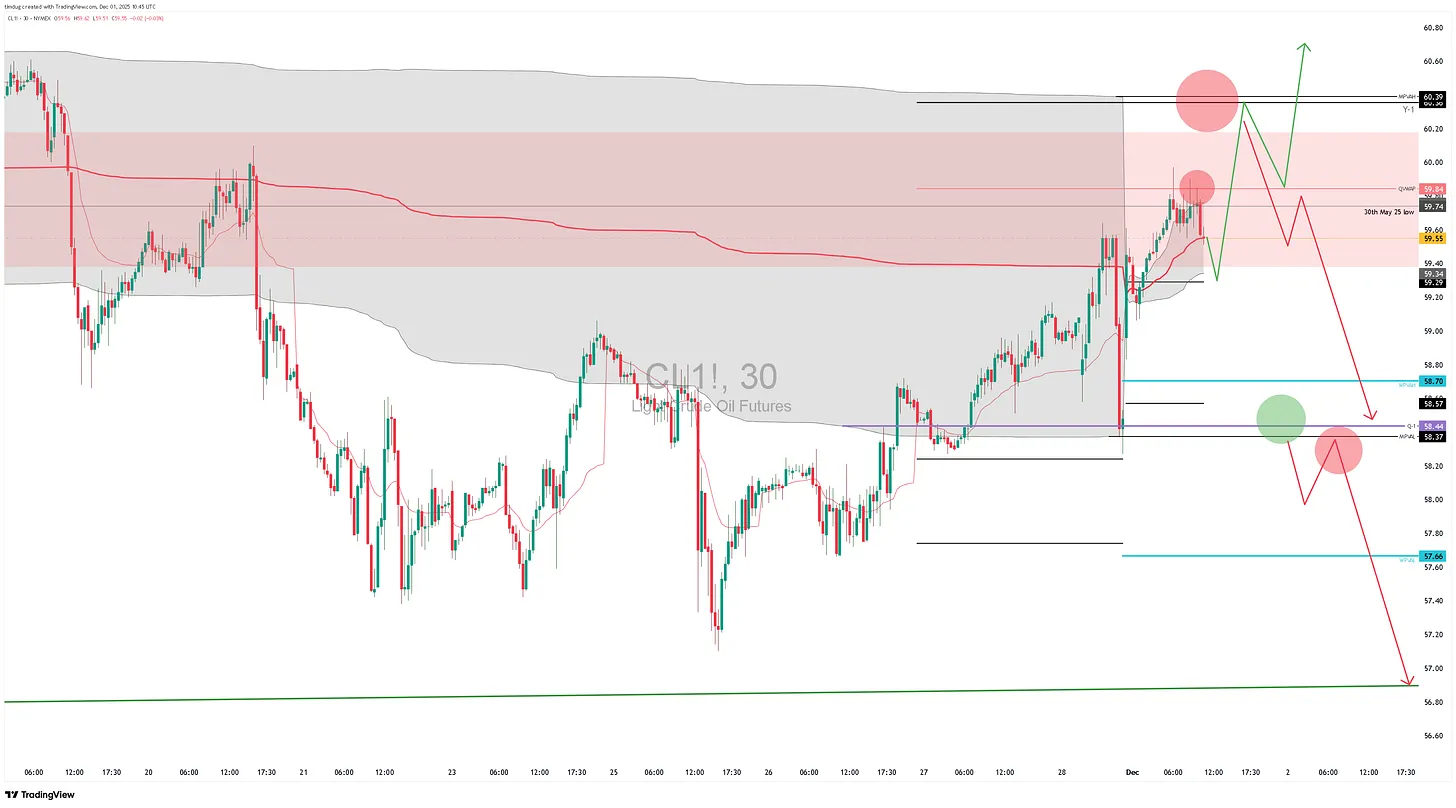
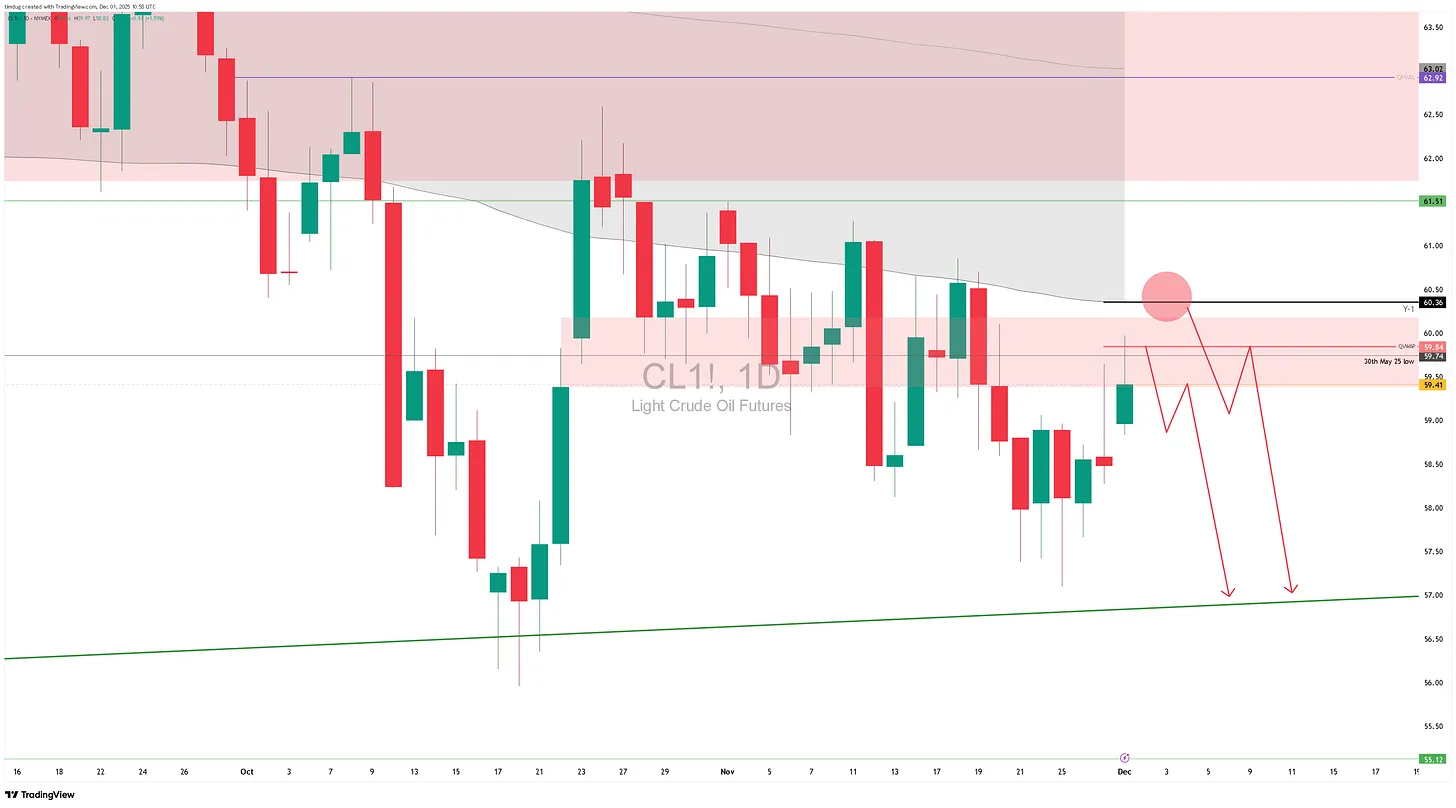
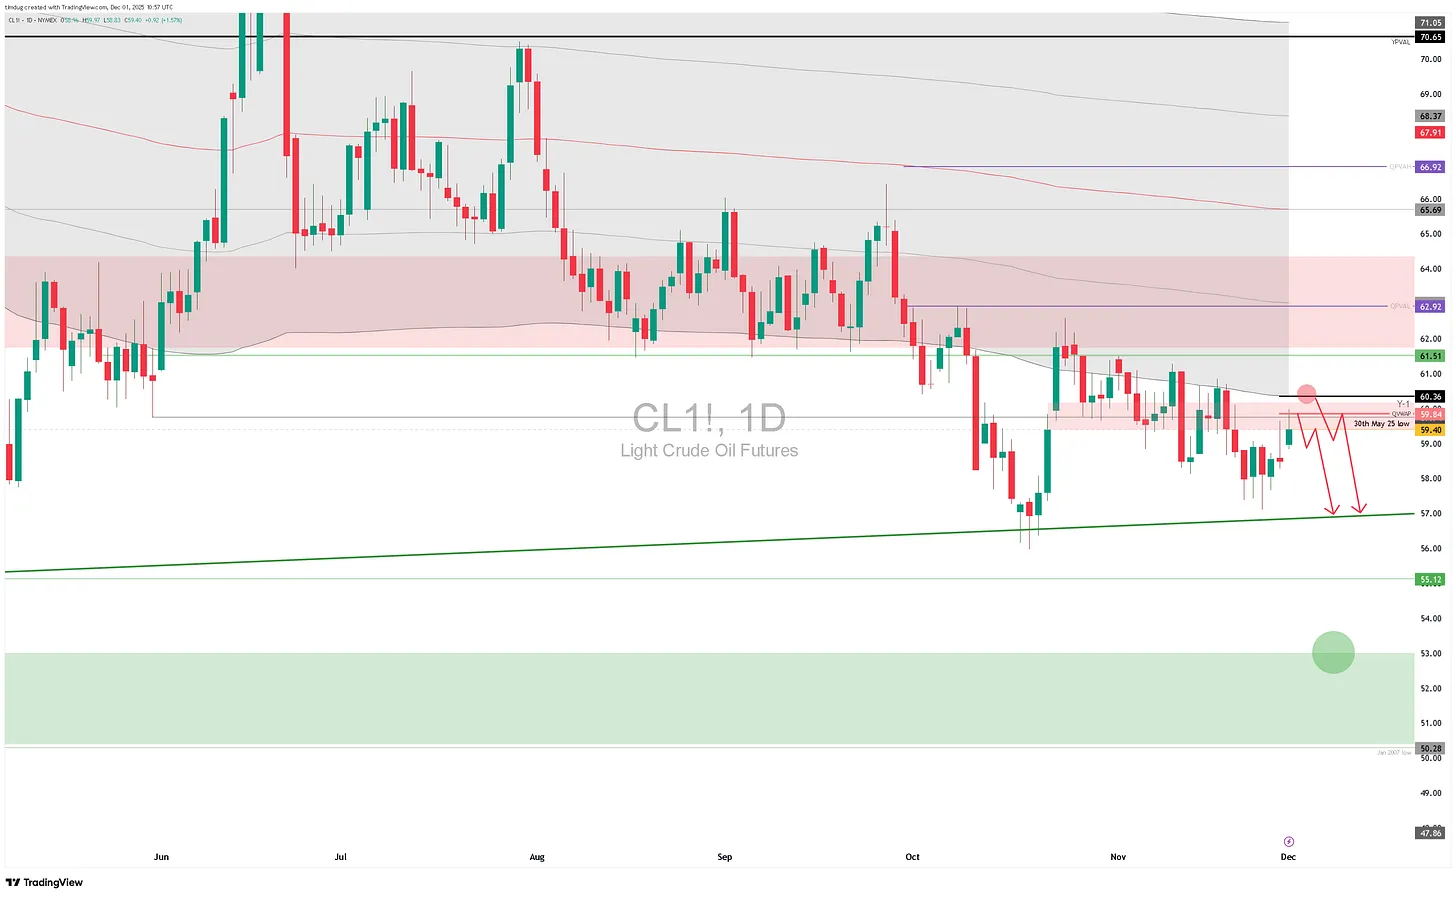
We can observe that the market is firmly imbalanced down of -1 on the year. We do no buy markets that are IB down without larger references to lean on. I want to be long this market from much lower, but as the market holds below the Y-1 and below QVWAP, the intraday trades are short for me. Sell rips, don’t buy dips. Once we establish price above QVWAP and Y-1, then I’ll look to buy dips.
Disclaimer: The analysis and trade guidance in this report are provided for informational and educational purposes only and do not constitute investment advice, trading recommendations, or an offer to buy or sell any financial instrument. Futures and commodities trading involve significant risk and may not be suitable for all investors. Past performance is not indicative of future results. Readers are solely responsible for their own trading decisions and should conduct independent research or consult a qualified financial professional before acting on any information contained herein. The author assumes no liability for losses or damages arising from the use of this material.