


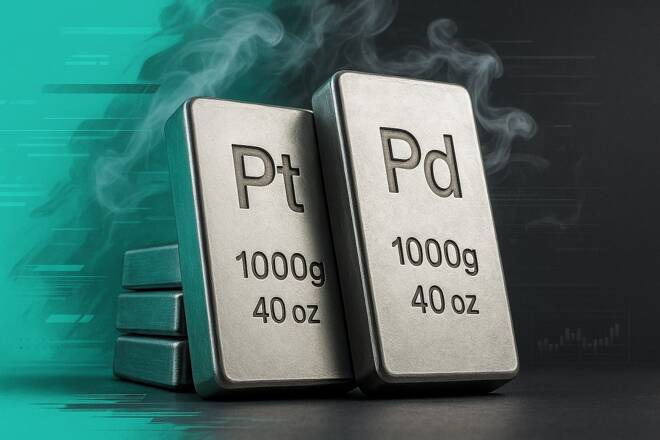
Platinum (XPL) and palladium (XPD) prices remain under bearish pressure on Friday and continue to drop towards the long-term support regions. Platinum price lost 3.60% on Thursday while palladium price lost 0.92%.
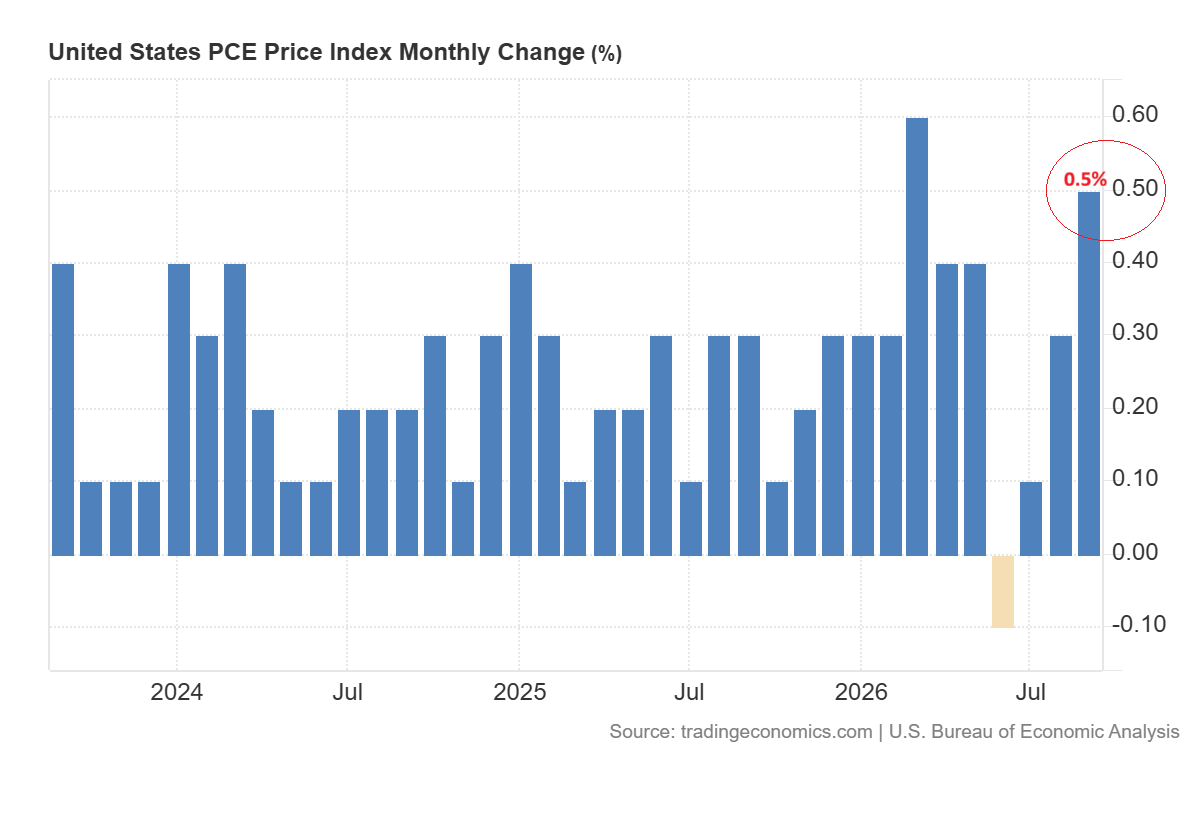
This bearish pressure extended further after the release of PCE inflation data which suggests a higher inflation environment. The PCE price index increased by 0.5% in September, as compared to 0.3% in August.
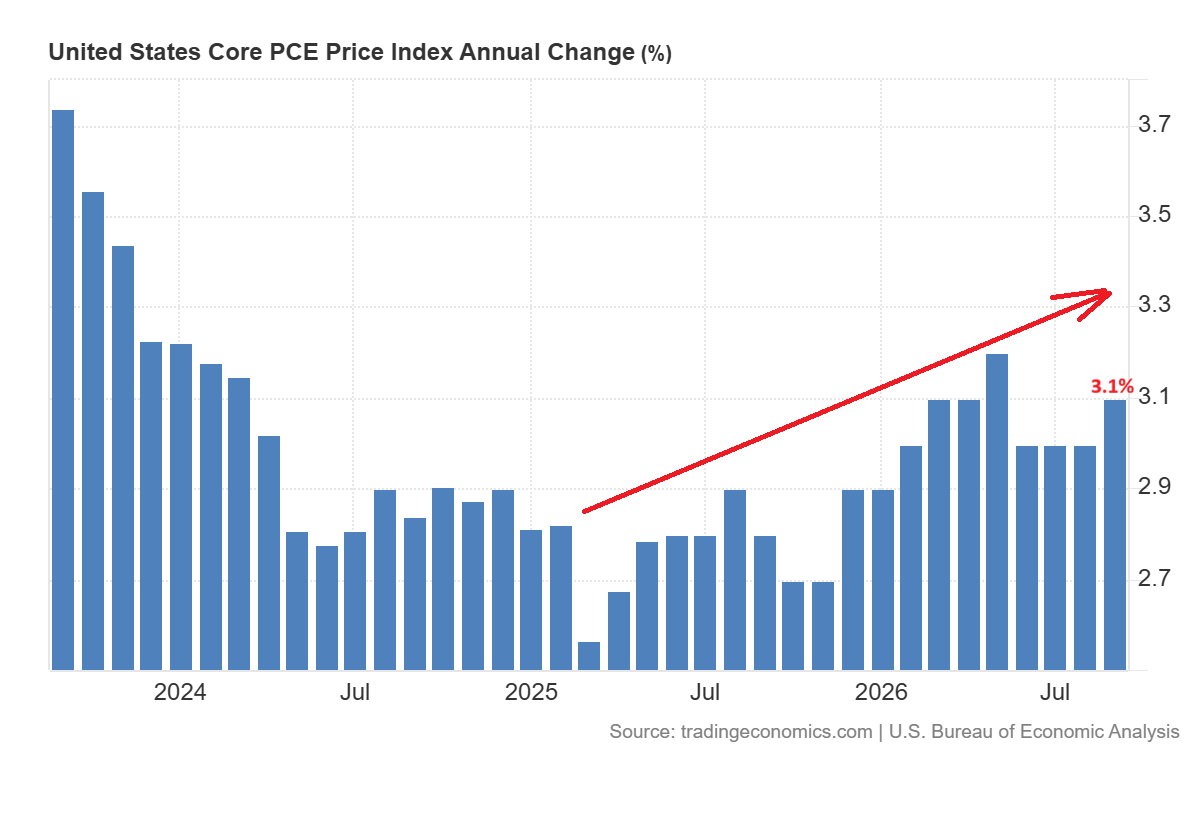
The annual core PCE inflation also increased to 3.1% in September. The chart below shows that core PCE inflation has shown positive pattern since March 2025. The inflation above the 2% target set by the Fed increases expectations for higher interest rates in the near future.
The high interest rates can also raise financing costs for vehicles. This may reduce the demand for catalytic converters which use platinum and palladium. Despite the strong drop in platinum and palladium, there might be strong interest in the market at lower prices.
I think that platinum and palladium may face further downside as the inflation remains high.
Platinum Price Forecast: $1,350 Support Comes Into Focus
The daily chart for platinum shows that the price has been trading within the descending channel pattern since March 2026. The price formed head and shoulders patterns at the resistance of the descending channel in August and September and broke below the $1,700 level.
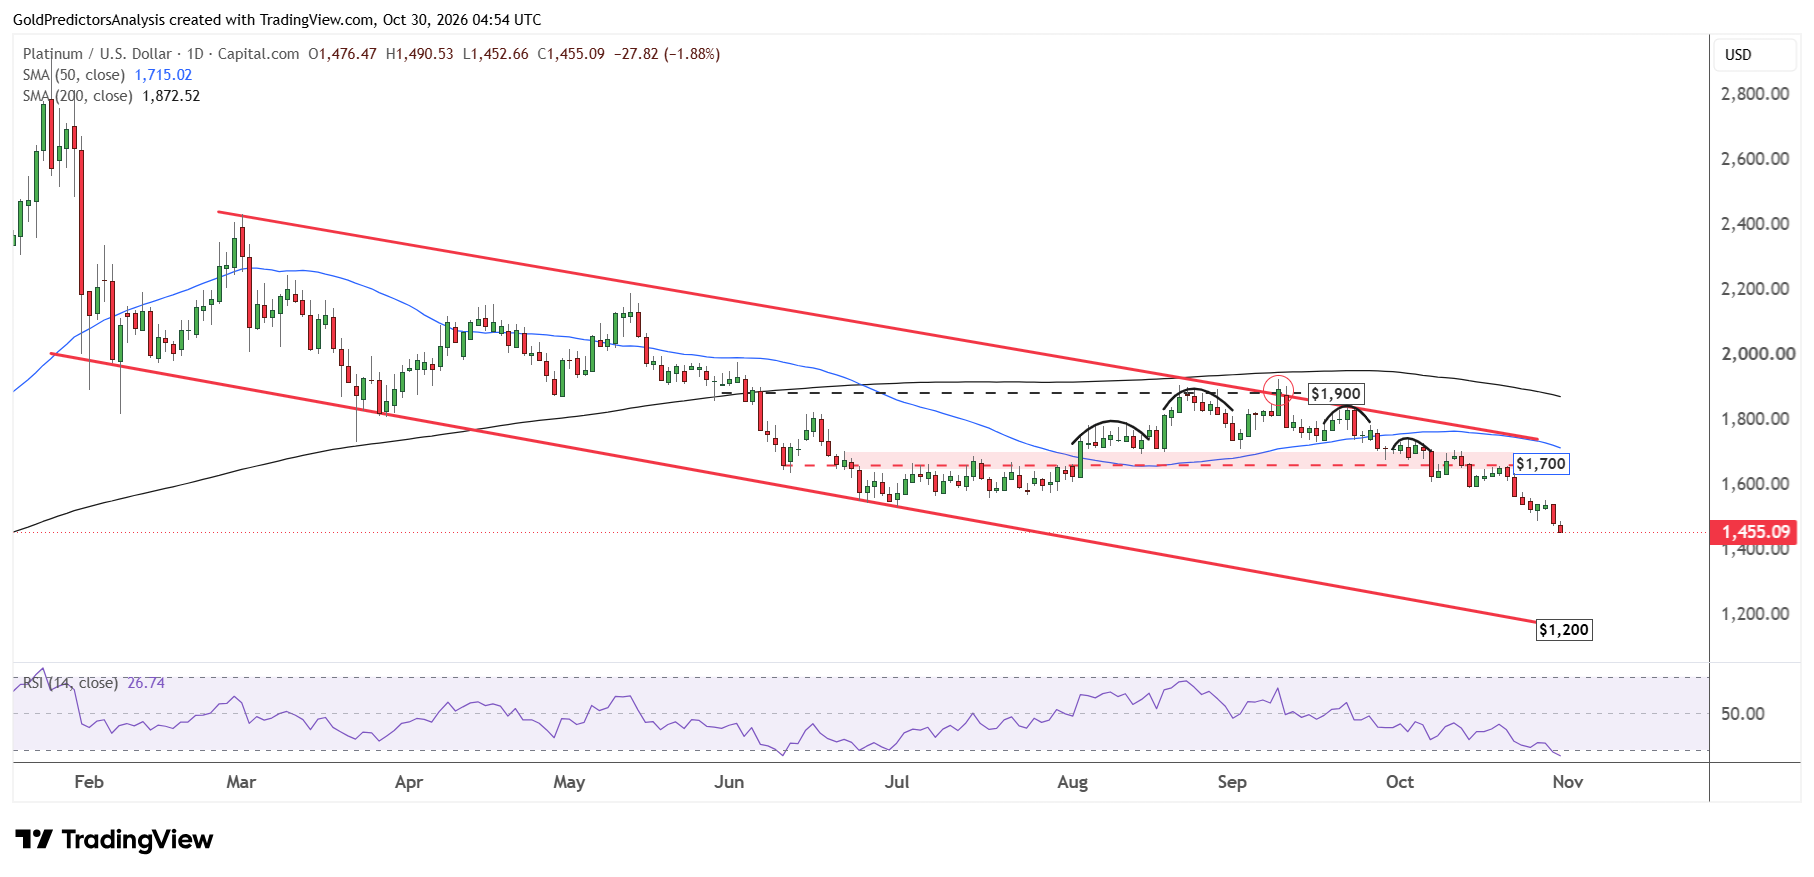
After the breakout, the price continued to drop under bearish pressure and looks set for further downside in the short term. The RSI indicator shows that the price is now entering oversold territory.
But there is still no sign of recovery in the platinum market. The price must recover above $1,700 to indicate a bottom and continued movement toward the $1,900 area. The immediate target for platinum remains the $1,350 area.
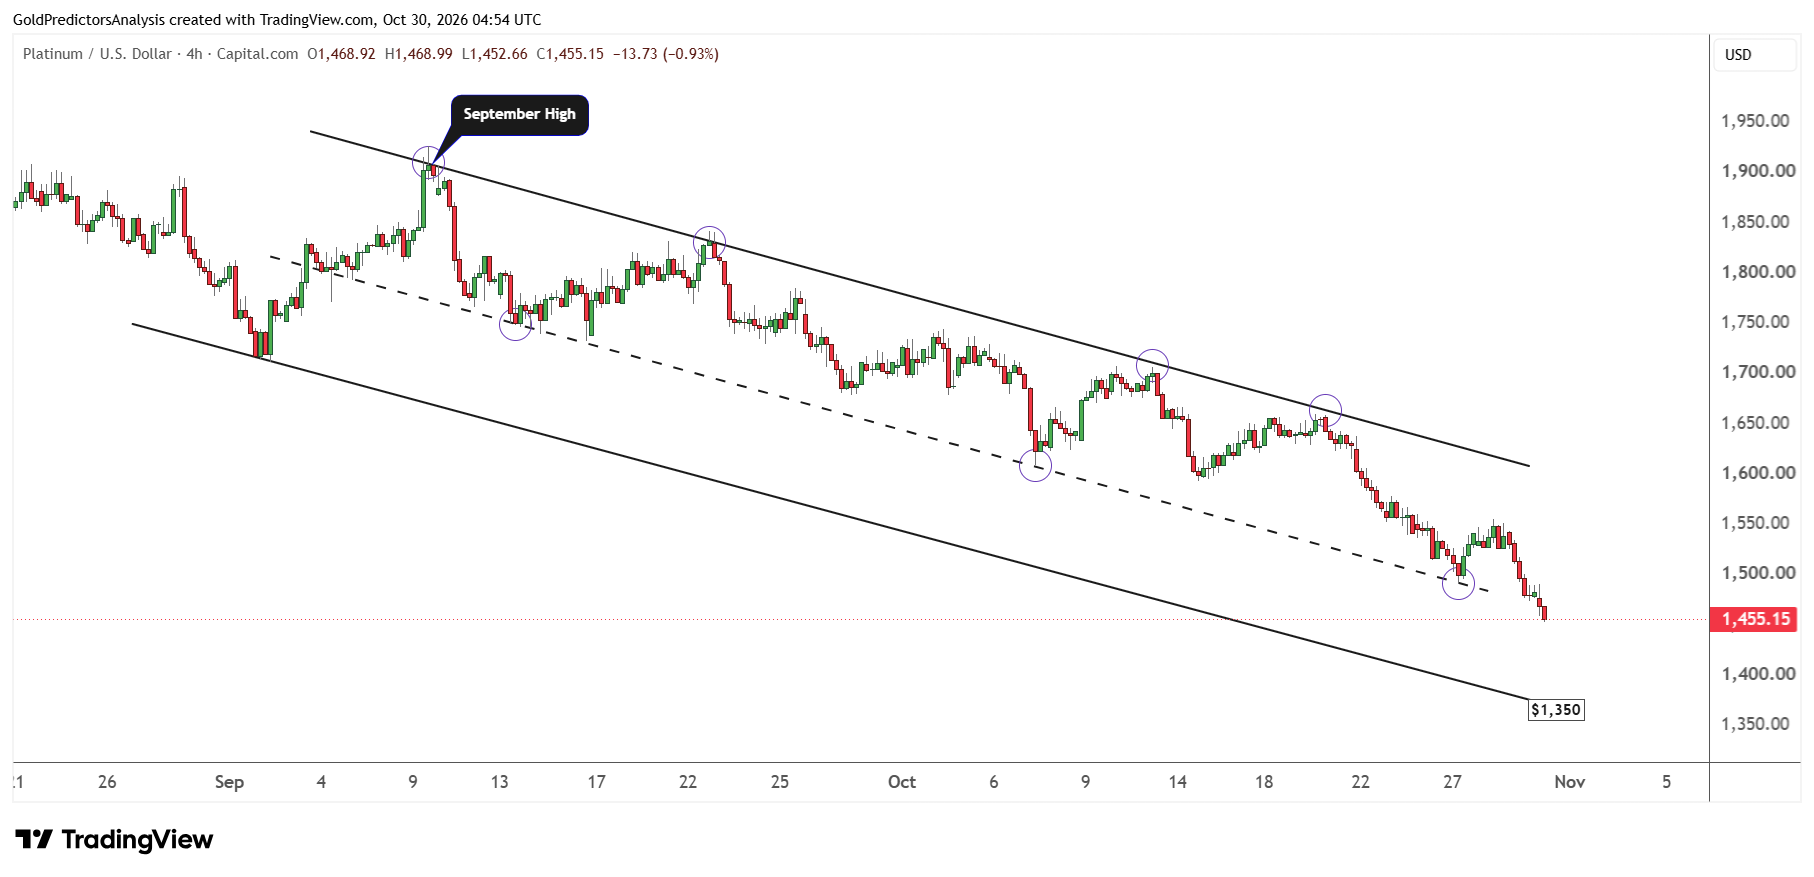
The 4-hour chart for platinum also shows that the price continues to drop after the September high within the descending channel pattern. The price has already broken below the midline of descending channel at $1,500. It is now looking to drop towards the significant support at $1,350.
The descending channel pattern defines this support. Any drop towards this level may trigger strong rebound. The strong oversold conditions in the platinum market may support this rebound.
Palladium Price Forecast: $900 Support Faces a Test
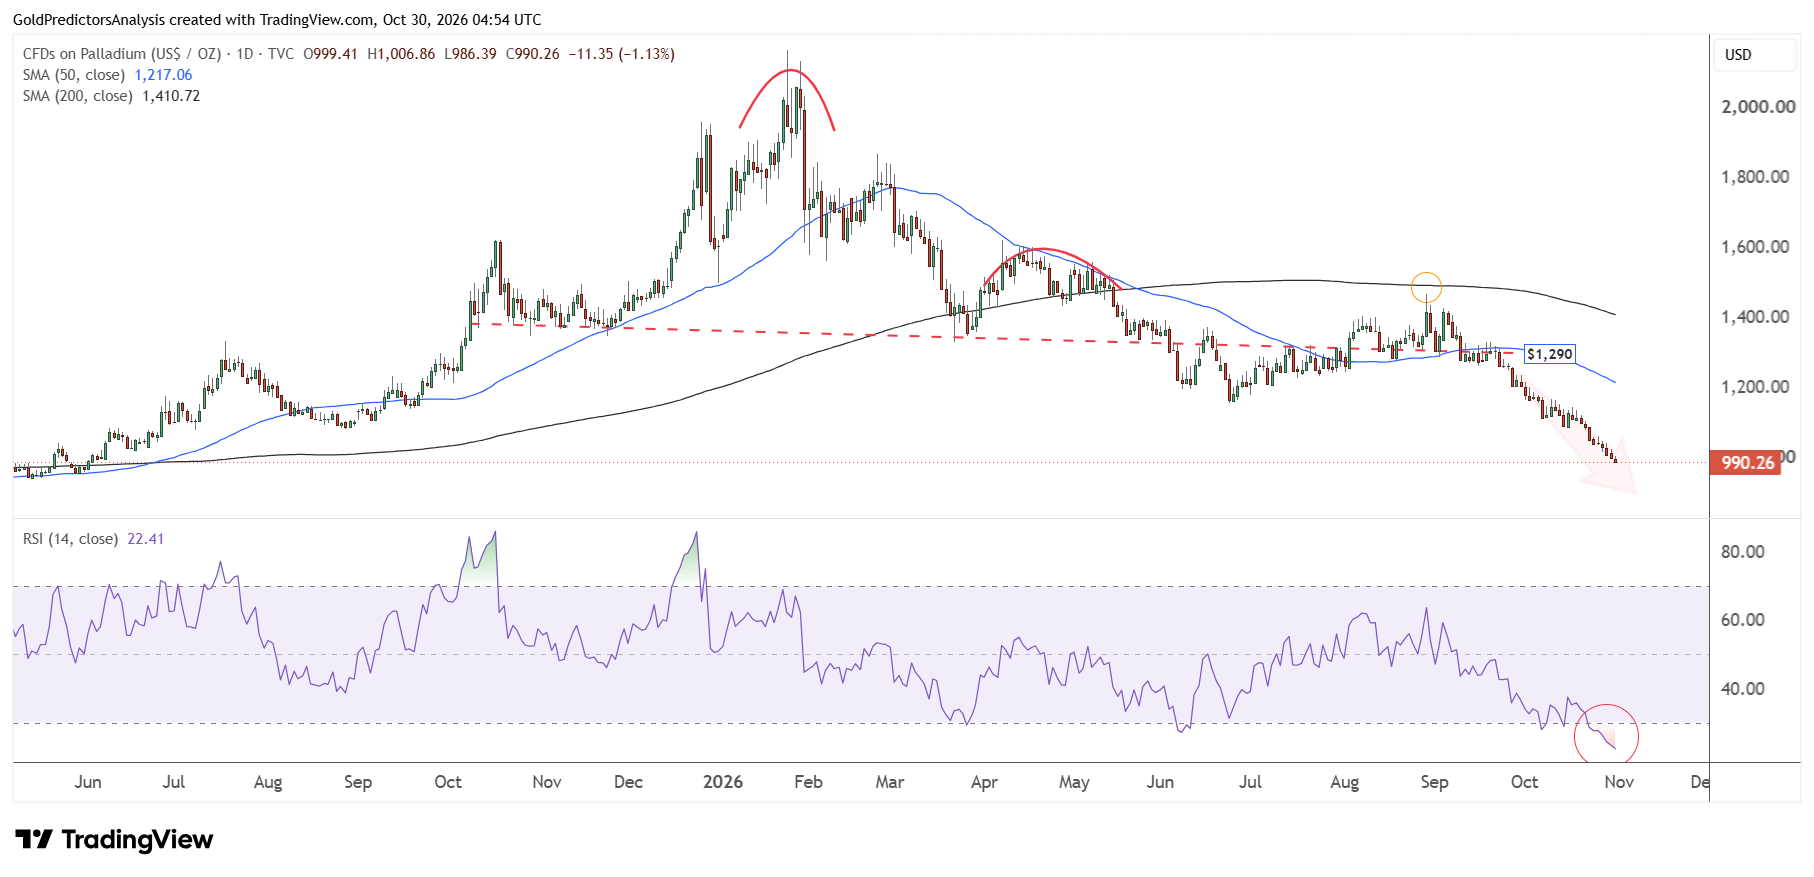
The daily chart for palladium also shows strong bearish pressure after the breakdown below the $1,290 area. The break below $1,290 has activated the head and shoulders formation in the palladium market. The price now remains under bearish pressure.
The RSI indicator has already reached oversold territory which suggests that the price may create a rebound. The price is now approaching the long-term support region in the palladium market. Therefore, any rebound from current levels may trigger strong rally in palladium.
This long-term support zone in palladium is also observed on the monthly chart. The chart shows that the price has entered the support region of $900-$1,100. This region is highlighted by the blue shaded area in the chart below.
If the price closes the monthly candle below $900, it will likely challenge broader structure in the palladium market in the long term. But any recovery above $1,100 will likely trigger another rally towards the $1,200 area. The palladium price must close the monthly candle above $1,200 to trigger a meaningful rally toward the $1,450 region.
What to Watch Next
Platinum and palladium prices remain under bearish pressure as high inflation environment keeps the risk of interest rates high. The high cost of vehicle financing may weaken the demand for metals. The key support in platinum is $1,350 while the key support in palladium is $900. A break below $1,350 in platinum may open the way for $1,200 while a break below $900 in palladium may challenge the long-term structure in palladium. Platinum must break above $1,700 to ease the bearish pressure in prices. A break above $1,200 in palladium may trigger rally to $1,450.