


Platinum (XPL) prices rebounded on Wednesday from the $1,530 support level after 2.26% drop on Tuesday. The chart below shows that US consumer prices increased by 0.4% in October, which is above the forecast of 0.3%.
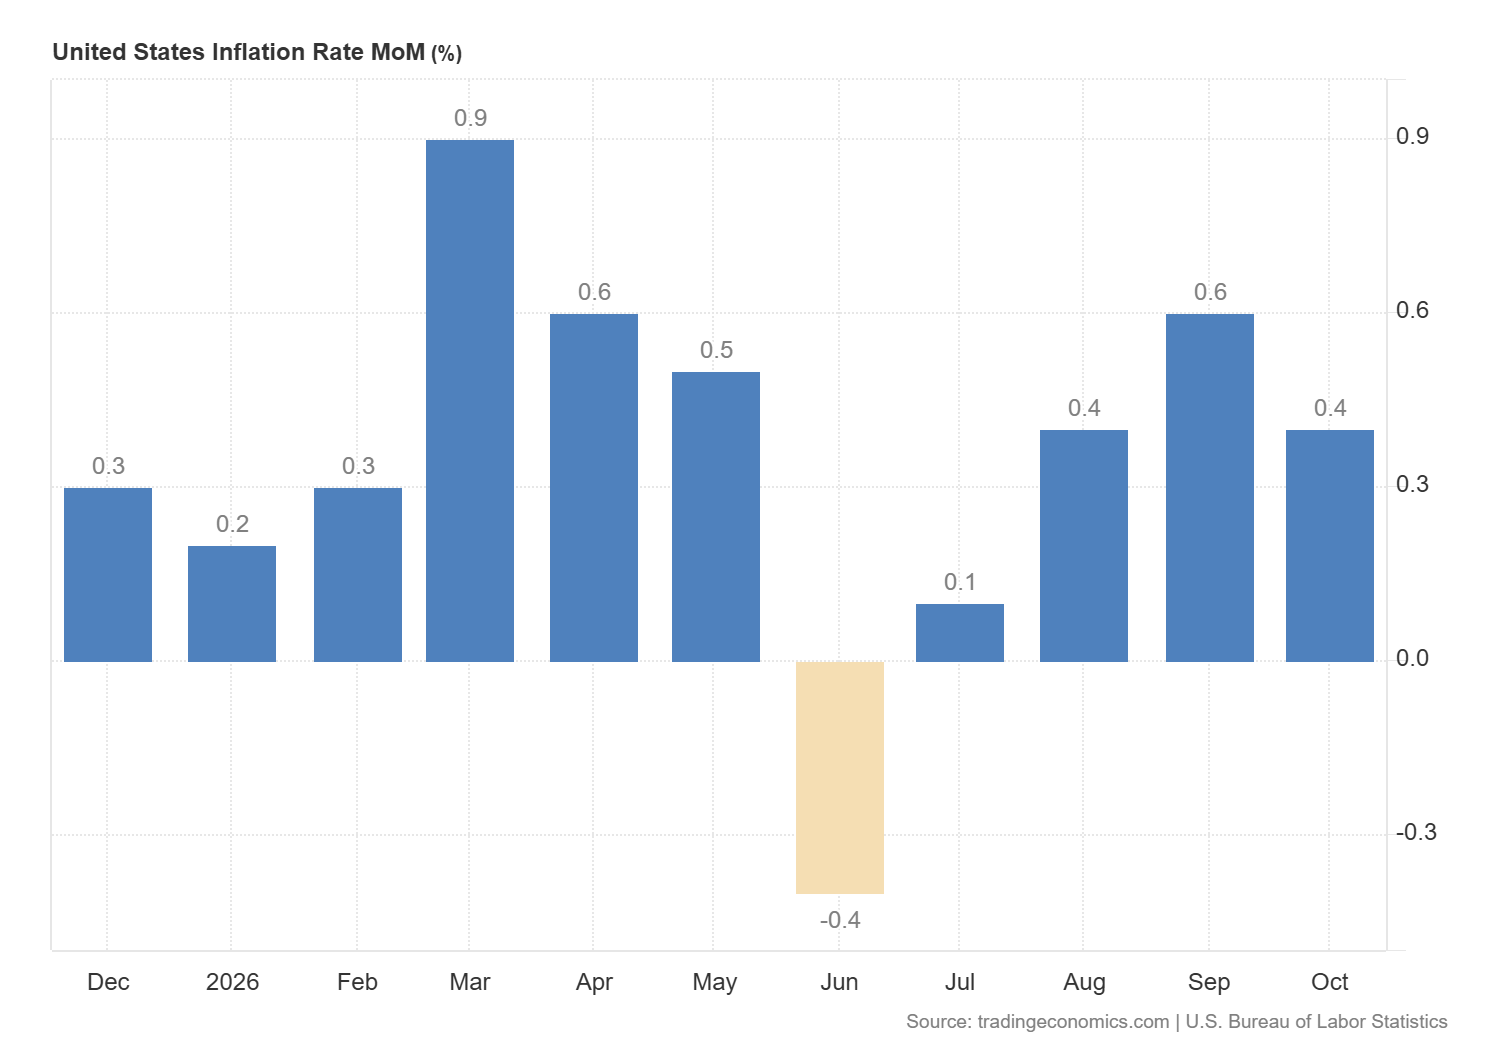
This surprise increased the probability of Fed rate hike in December to 90%. The expectations of high interest rates pushed 10-year Treasury yield to nearly 5%. The high yields make platinum less attractive to investors.
The strong gains in the US dollar also pressured platinum prices on Tuesday. The US dollar remains strong on Wednesday and continues to trade near 102.40. A break above 102.50 may push US dollar index toward 104. This may keep platinum prices under pressure in the short term.
The physical demand in China is subdued. Shanghai Metals Market reported that buyers are cautious and sellers struggled to close deals which is creating uncertainty in the short term.
Platinum Price Forecast: $1,580 Breakout Could Lead to $1,700
Monthly Chart: Platinum Stays Bullish Above $1,350
The monthly chart for platinum shows that the price produced a low of $1,388 in November and produced a rebound above the key resistance level of $1,530. The platinum price must close above $1,530 to open the way for further upside towards the $1,700 area. As long as the price remains above $1,350, the possibility of another strong rally towards $1,700 and then $1,900 is high.
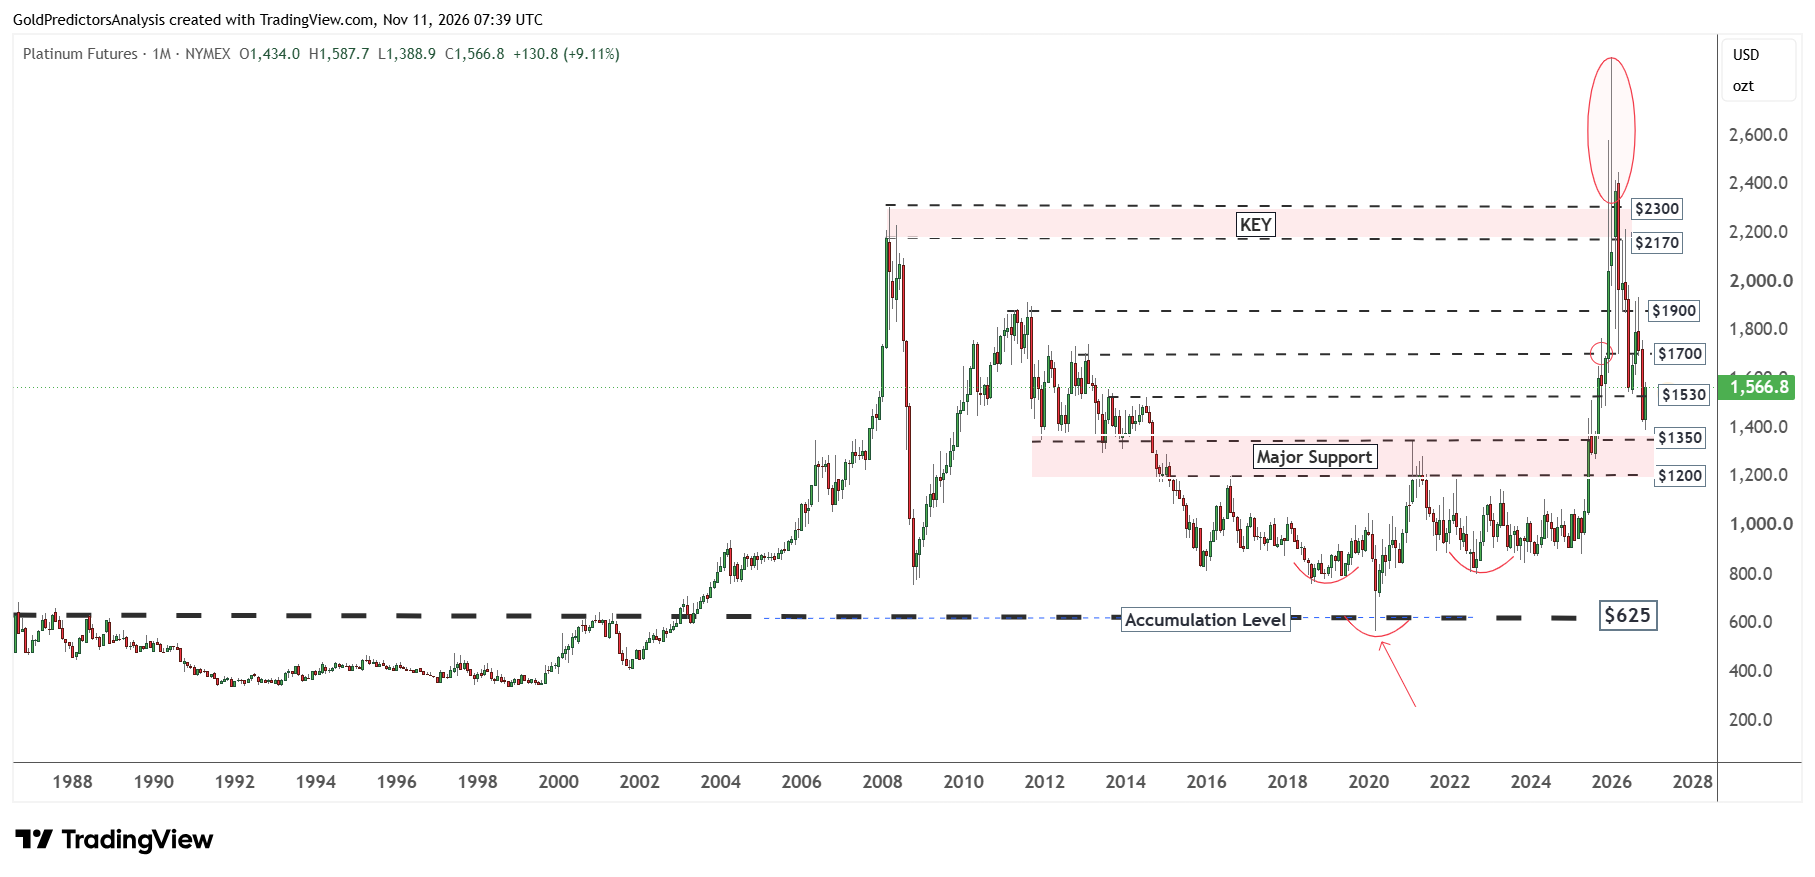
The emergence of inverted head and shoulders pattern also highlights the bullish outlook in the long term. The head of this pattern was formed in March 2020 at the low of $562. The shoulders were formed with the lows of $843 in August 2018 and $796 in September 2022.
This pattern suggests that the overall price structure for platinum remains bullish in the long term. If the price recovers above $1,900, a rally towards the $2,170-$2,300 area will become more likely.
Short-Term Outlook: Platinum Retests $1,530 Support
The price action for platinum also looks constructive in the short term. The price formed a bullish candle on 4 November and broke above the $1,530 area. As long as the price remains above $1,530, the chances of rally towards $1,700 are high.
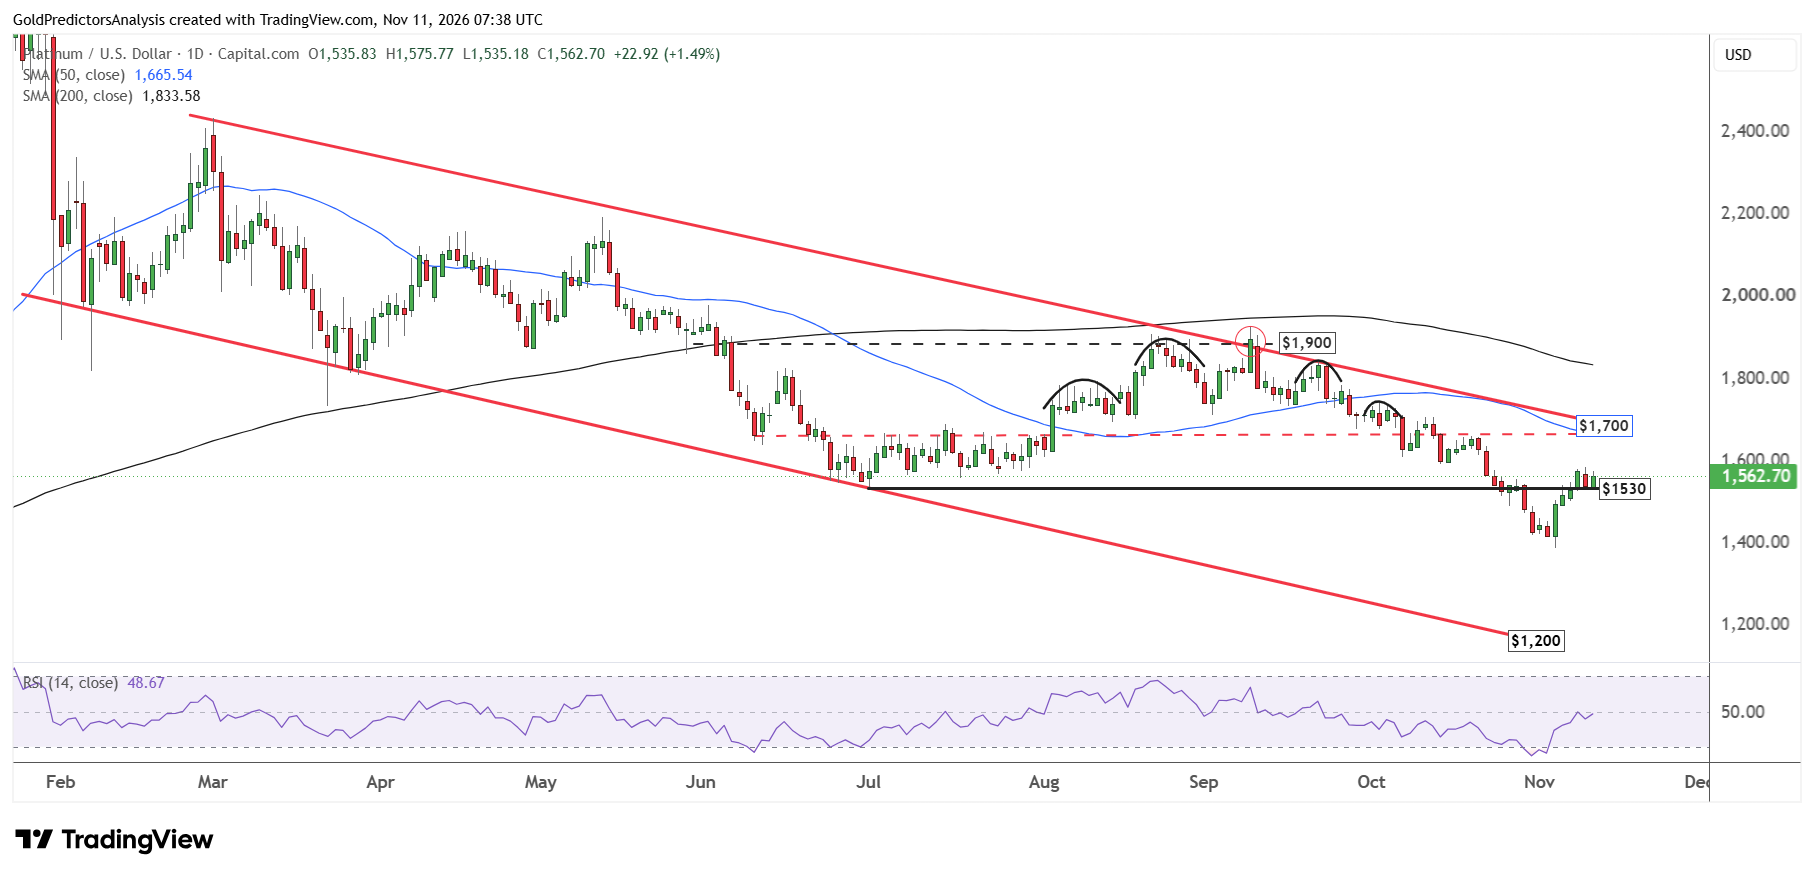
The key resistance area for platinum is now $1,700. A break above this level would open the way for further upside. The descending channel pattern that stretches from the highs of March 2026 defines this resistance. The RSI is also approaching the midline. A break above $1,580 would likely push the RSI above the midline and support strong bullish outlook.
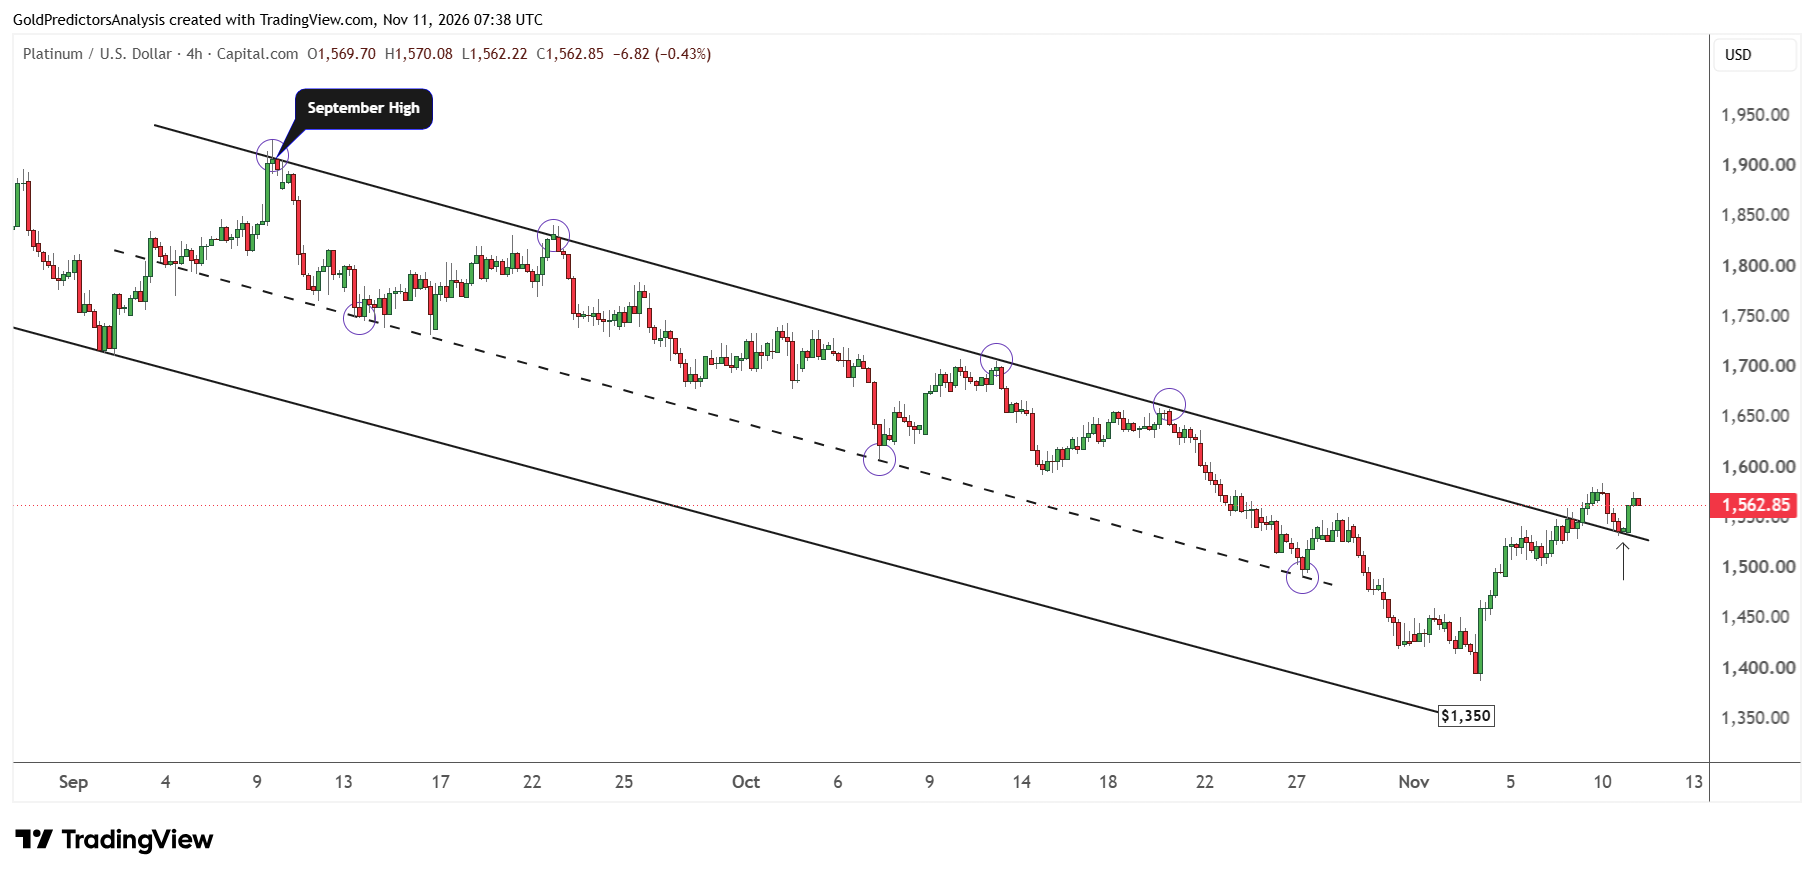
The 4-hour chart for platinum shows that the price has already broken above descending channel pattern that stretches from the highs of September 2026. After the breakout, the price hit channel support near $1,530 and is now moving higher.
A confirmed break above $1,580 would likely open the way for strong rally towards the $1,700 area within a bullish structure. But a drop and close below $1,530 would likely suggest another decline before the next rally.
Platinum vs. Silver: Can Platinum Regain Ground?
The platinum to silver (XAG) ratio has been trading within a wedge pattern since 2005 and has been compressing within this wedge. But the surge in precious metals pushed the ratio towards the record low of 22.215 in January 2026.
This low was developed when platinum prices reached a record high near $2,900 and silver prices surged towards a record high near $120. After this low, the ratio moved back within the wedge pattern and looks set to gain in the short term.
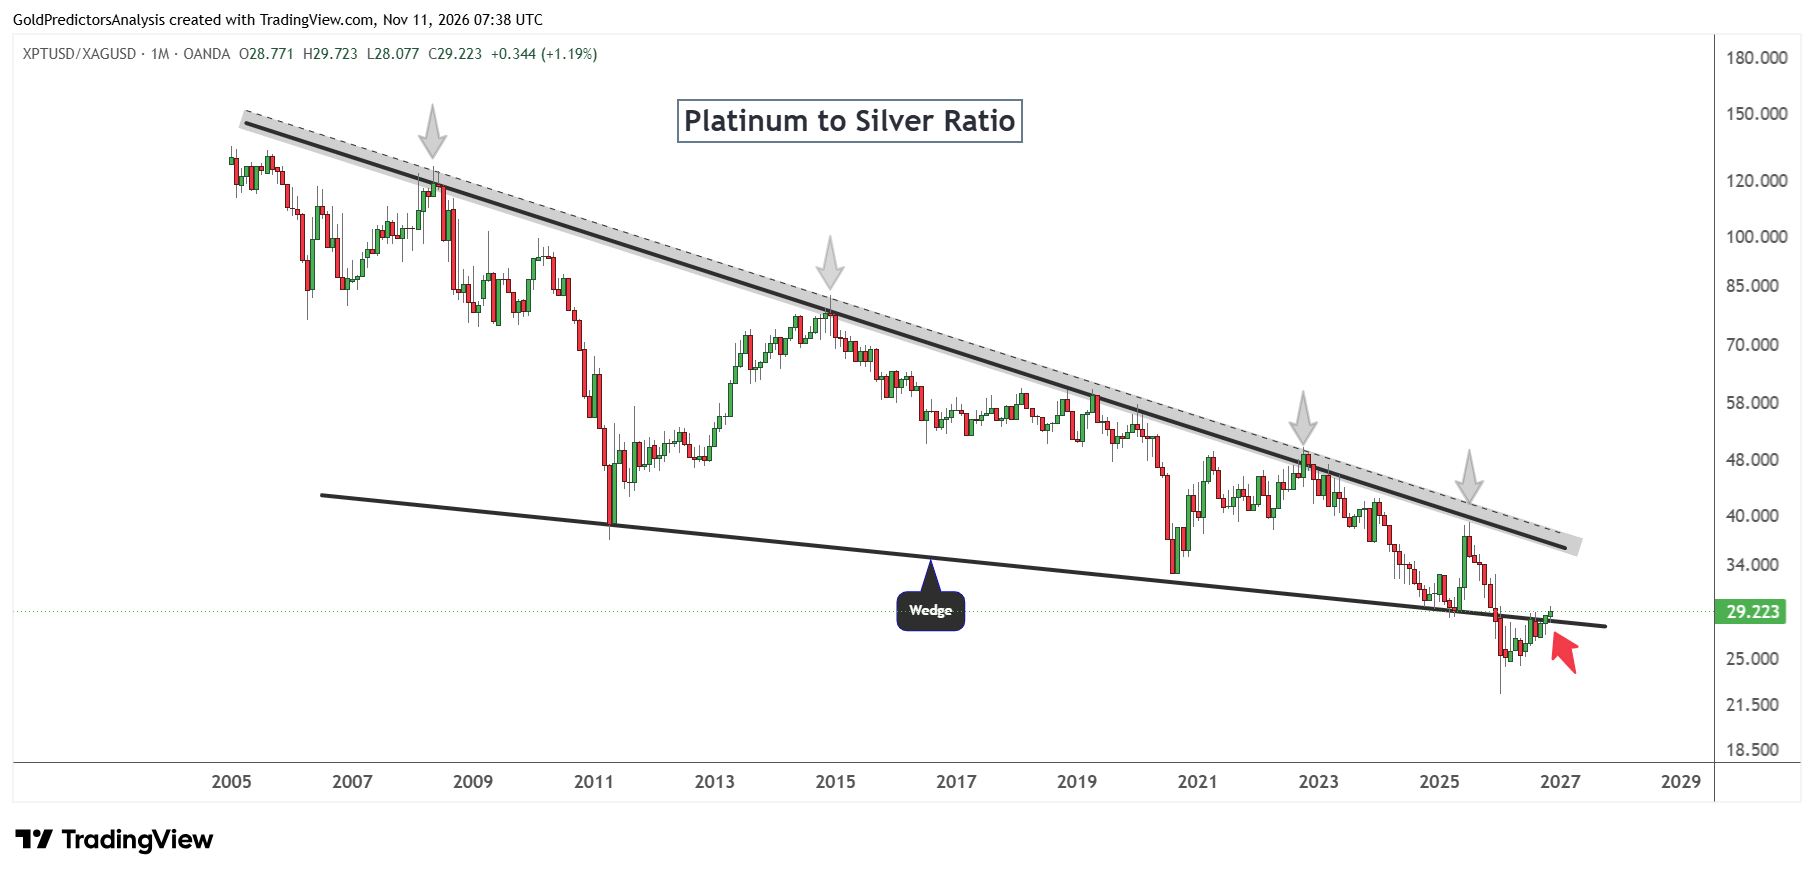
A confirmed break above 36 in the ratio will suggest that platinum could outperform silver. But the negative trend over the last 20 years suggests that platinum continues to underperform silver in the long term.
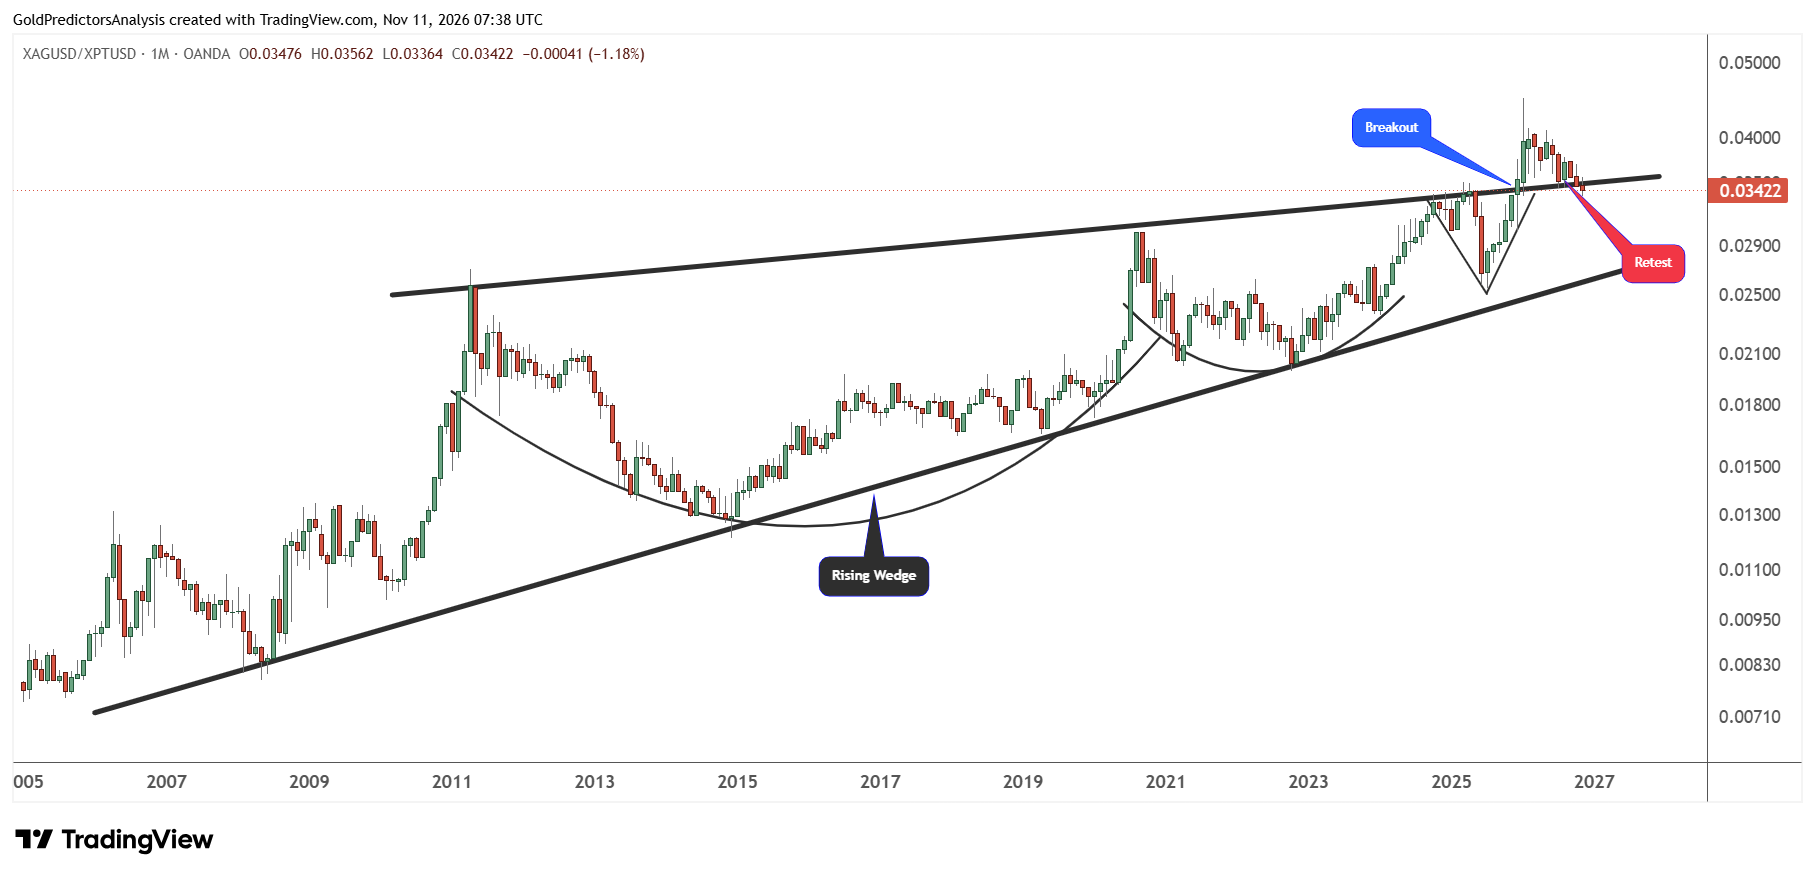
The silver to platinum ratio shows similar price action as the ratio forms a rising wedge pattern and shows constructive price action. The ratio formed a cup and handle pattern from 2011 to 2024. It also formed the V-shaped recovery pattern in 2025.
But the ratio has dropped below the support of the rising wedge and is now moving back within the pattern. If the ratio closes the month below 0.034, it will suggest that platinum could outperform silver. But if the ratio forms low near the current support zone, it will likely rally again towards the record high.
What to Watch Next
The market is now watching for the US producer price data that will be released on Friday. If the data is strong and exceeds forecasts, it may keep US Treasury yields high and pressure platinum prices. But the soft data may ease that pressure and push platinum to $1700. In my view, a break above $1,580 in platinum may open the way for $1,700. But a break below $1,530 may extend the decline to $1,450.
If you’d like to know more about how commodity markets work, please visit our educational area.