


The U.S. equity market has delivered extraordinary 1,000% returns over the past 17 years. For many investors, the persistent advance in stocks has become so familiar that rising markets now appear almost inevitable. Yet, financial history has repeatedly shown that periods of extreme optimism often contain the seeds of their own destruction. The concern is not simply that valuations are elevated. It is that multiple warning signals are now appearing at the same time. Concentration risk, euphoric sentiment and historically stretched valuations have combined to create one of the most extreme market environments seen in more than a century.
Bull Markets Follow A Familiar Psychological Pattern
Financial bubbles rarely emerge without warning. Across history, major advances tend to follow a consistent sequence:
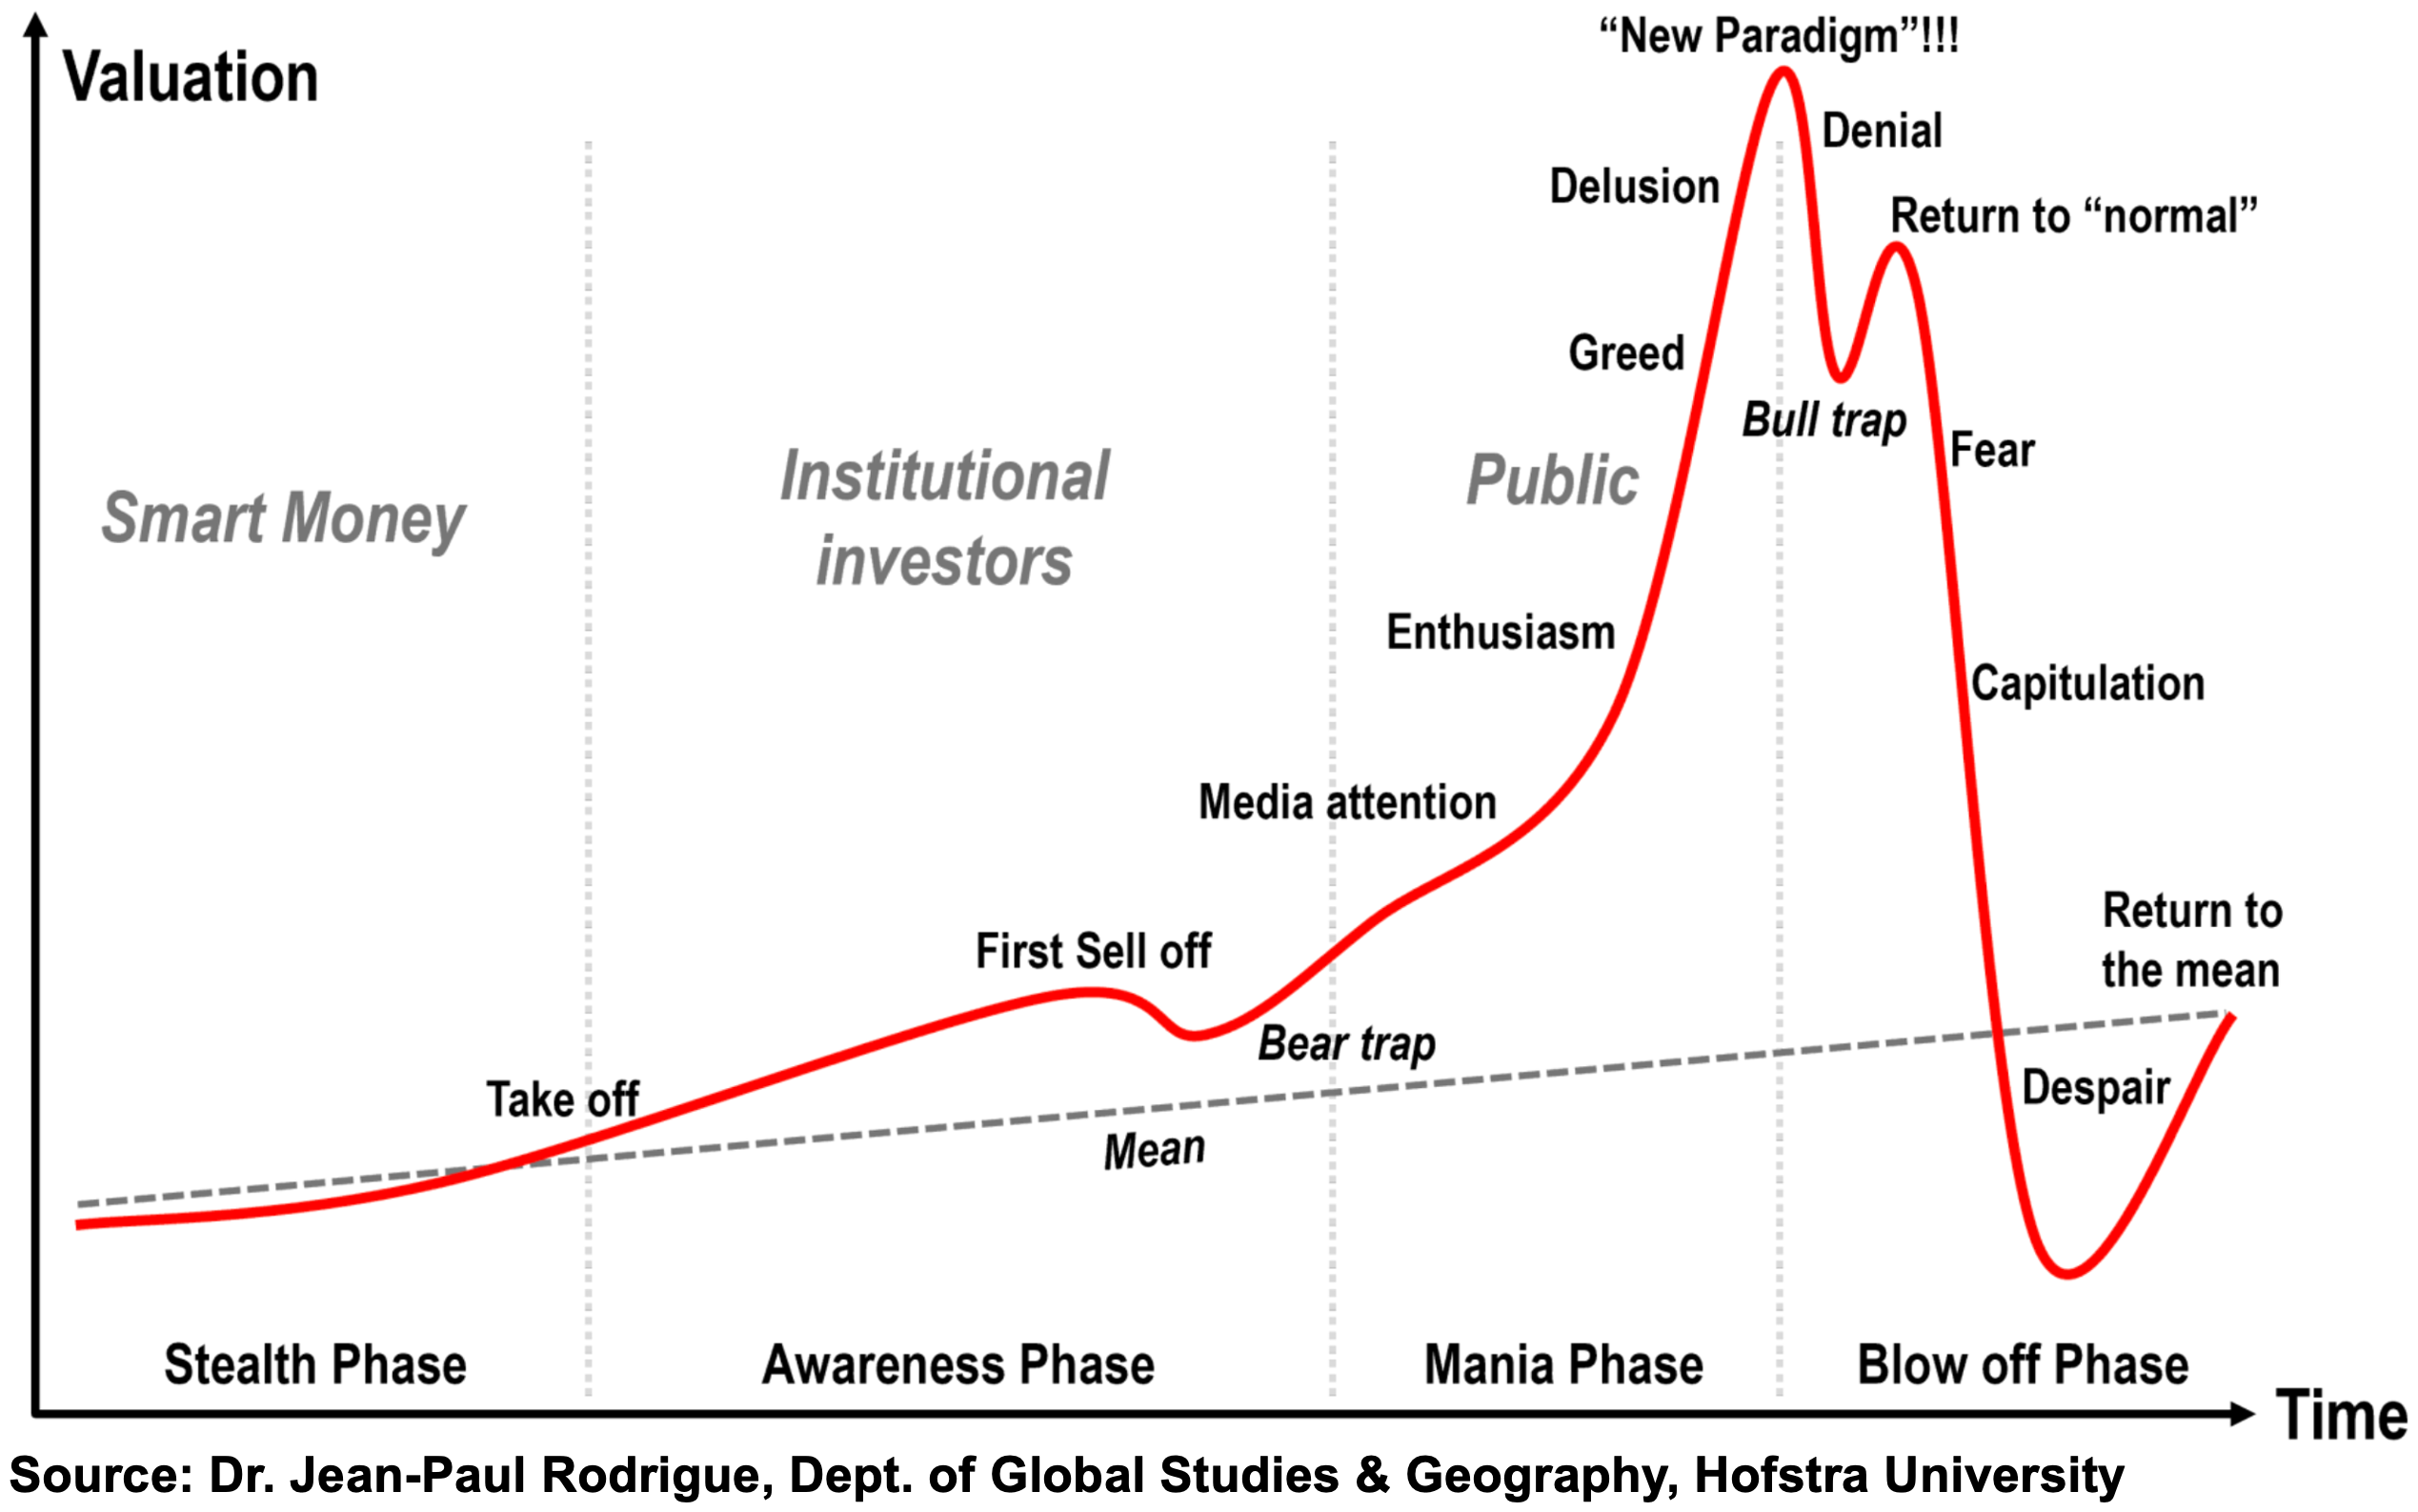
- Stealth Phase: Smart money accumulates assets while broader participation remains limited.
- Awareness Phase: As prices rise, momentum attracts more institutional investors and optimism spreads.
- Mania Phase: As prices rise increasingly rapidly, the general public enters, euphoria takes hold and emotions begin to dominate decision-making.
- Blow off Phase: The final stage occurs when expectations become unsustainable and prices reverse sharply.
Many characteristics of the current environment suggest the U.S. equity market is now well into the mania phase.
Semiconductors Appear To Have Met Classic Bubble Criteria
According to research from the National Bureau of Economic Research (NBER), asset bubbles often exhibit two key features:
S&P 500 Price Forecast
Every new S&P 500 analysis as it publishes, today's technical signal and key levels, live price — on one page.
See all S&P 500 forecasts- Prices rise by more than 100% over two years.
- Prices outperform the broader market by more than 100%.
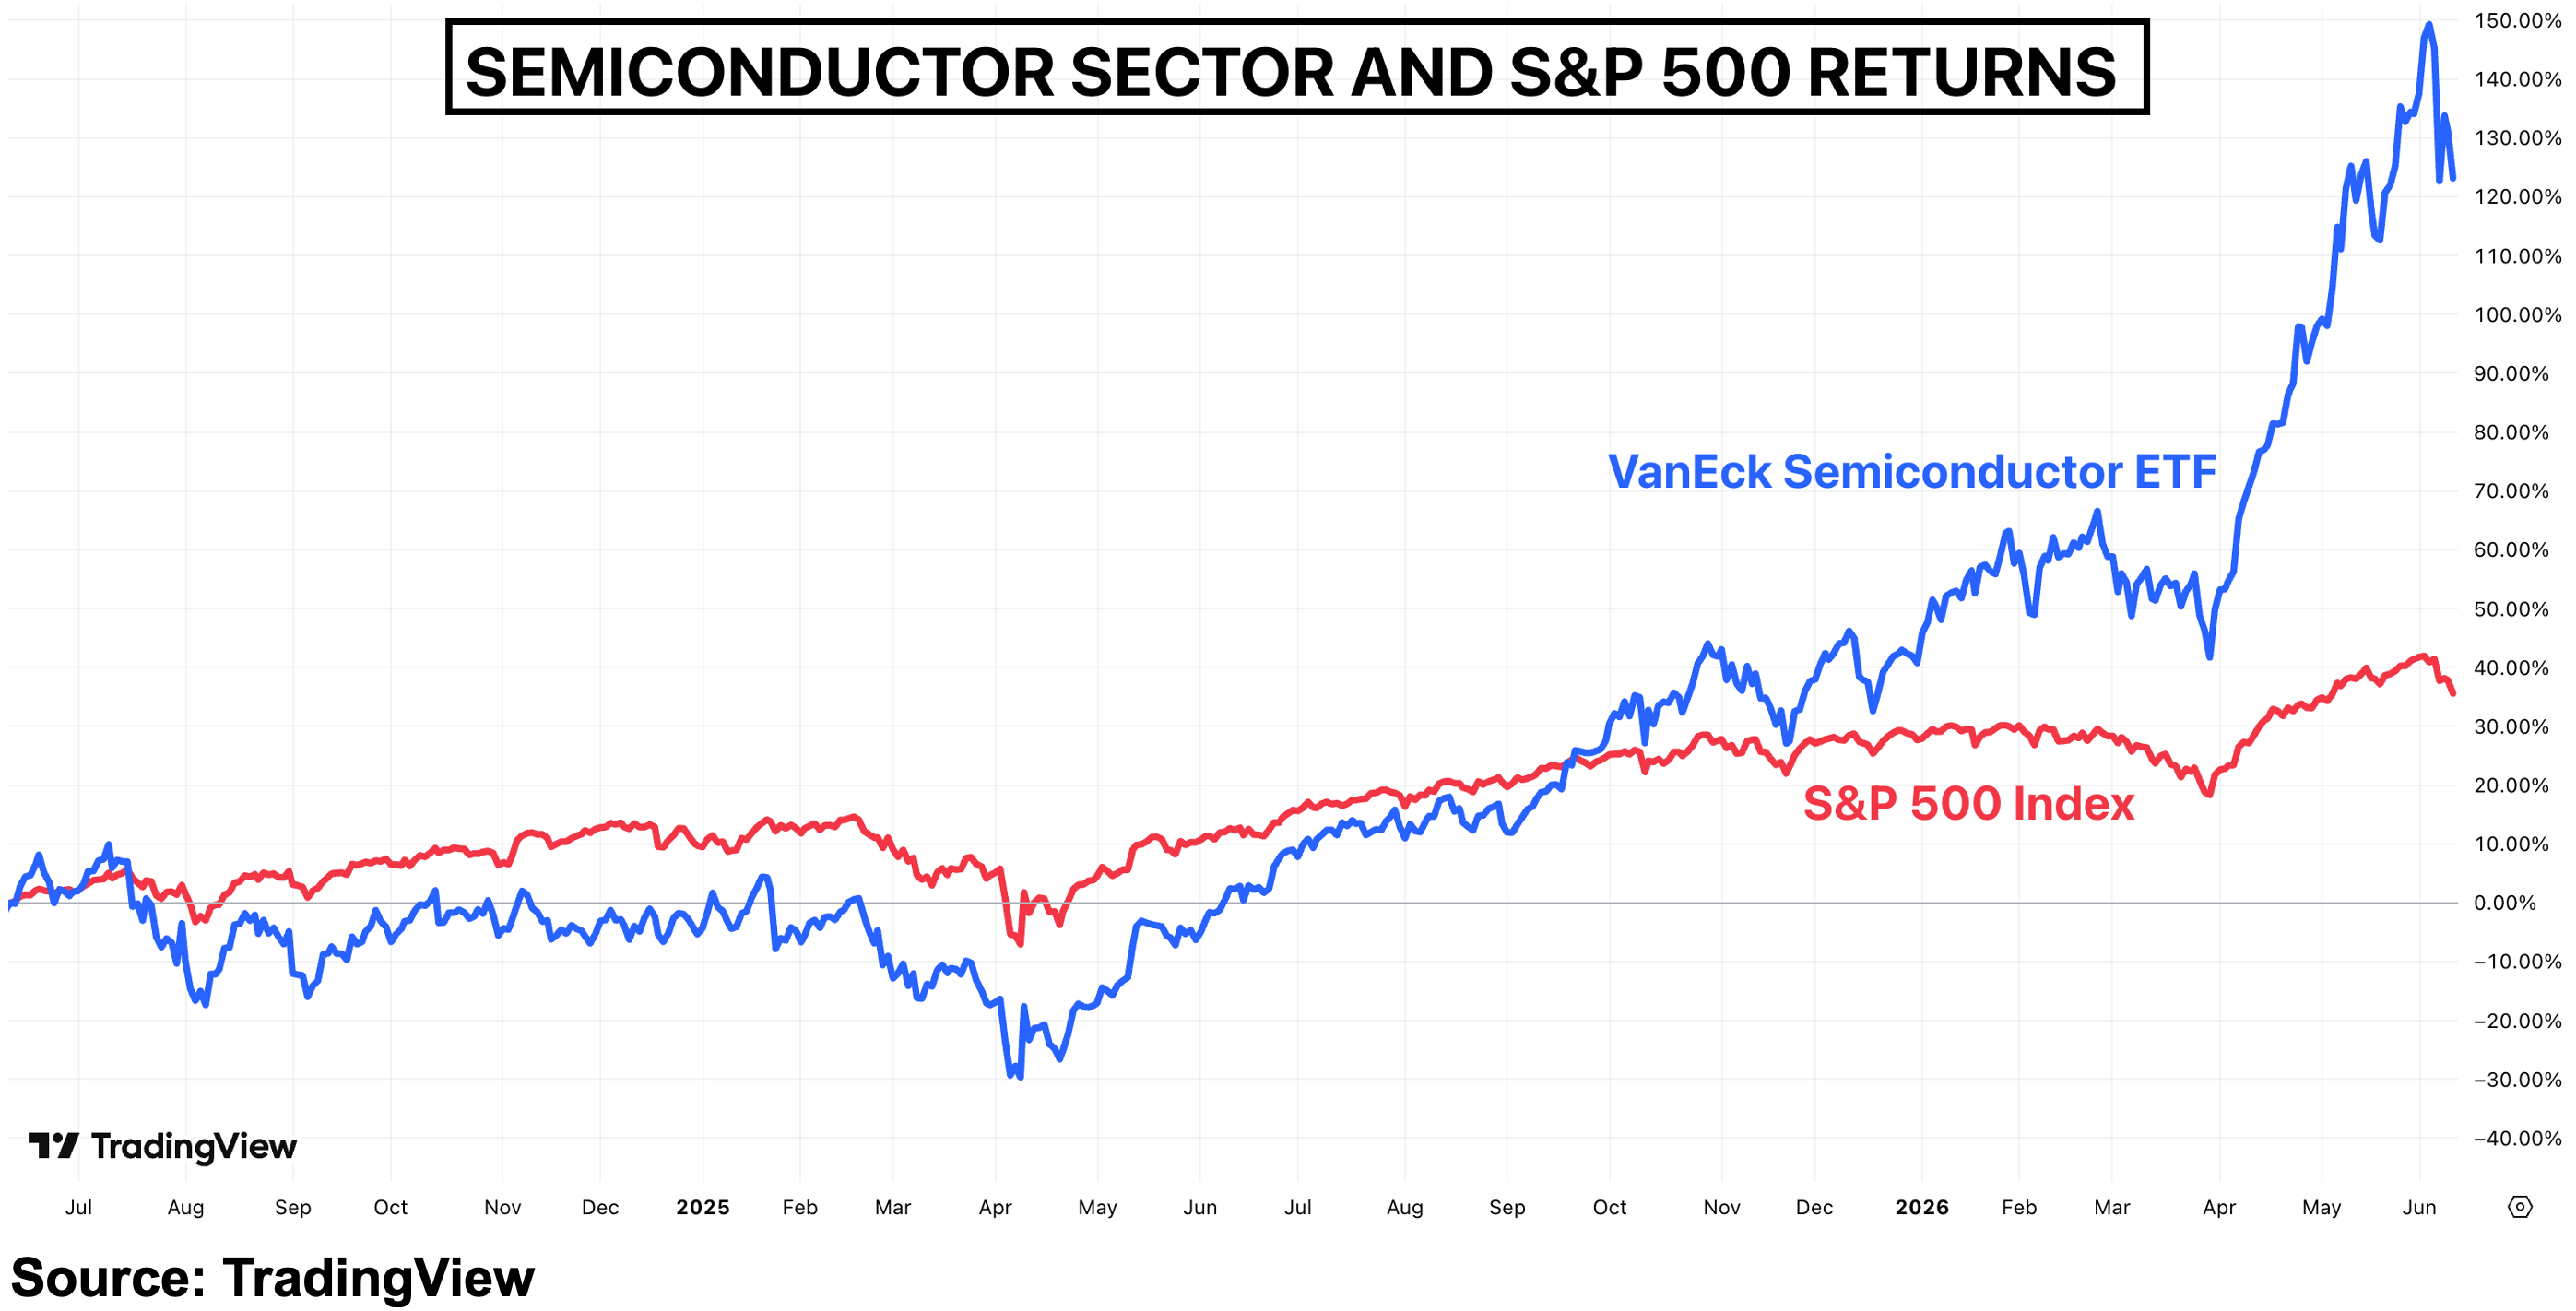
Semiconductors recently met both conditions. Over the past two years, the sector gained roughly 150% whilst outperforming the S&P 500 by approximately 110%. By historical standards, this type of performance is frequently associated with speculative excess.
Concentration Risk Has Increased Dramatically
Perhaps the most important structural shift in the S&P 500 is the growing dominance of semiconductors. Four years ago, the sector represented roughly 6% of the index. Today, it accounts for approximately 18%. At the same time, the broader market has risen around 100%.
This creates a critical vulnerability. A sharp decline in semiconductor stocks would have a disproportionately negative impact on the index. As a result, the S&P 500 is increasingly dependent on a narrow group of companies rather than broad-based participation.
Valuations Are Approaching Historic Extremes
When adjusted for economic output (nominal GDP), current valuations sit near levels seen only during major historical peaks. The market today stands near 7,200 points relative to long-term economic fundamentals. For context:
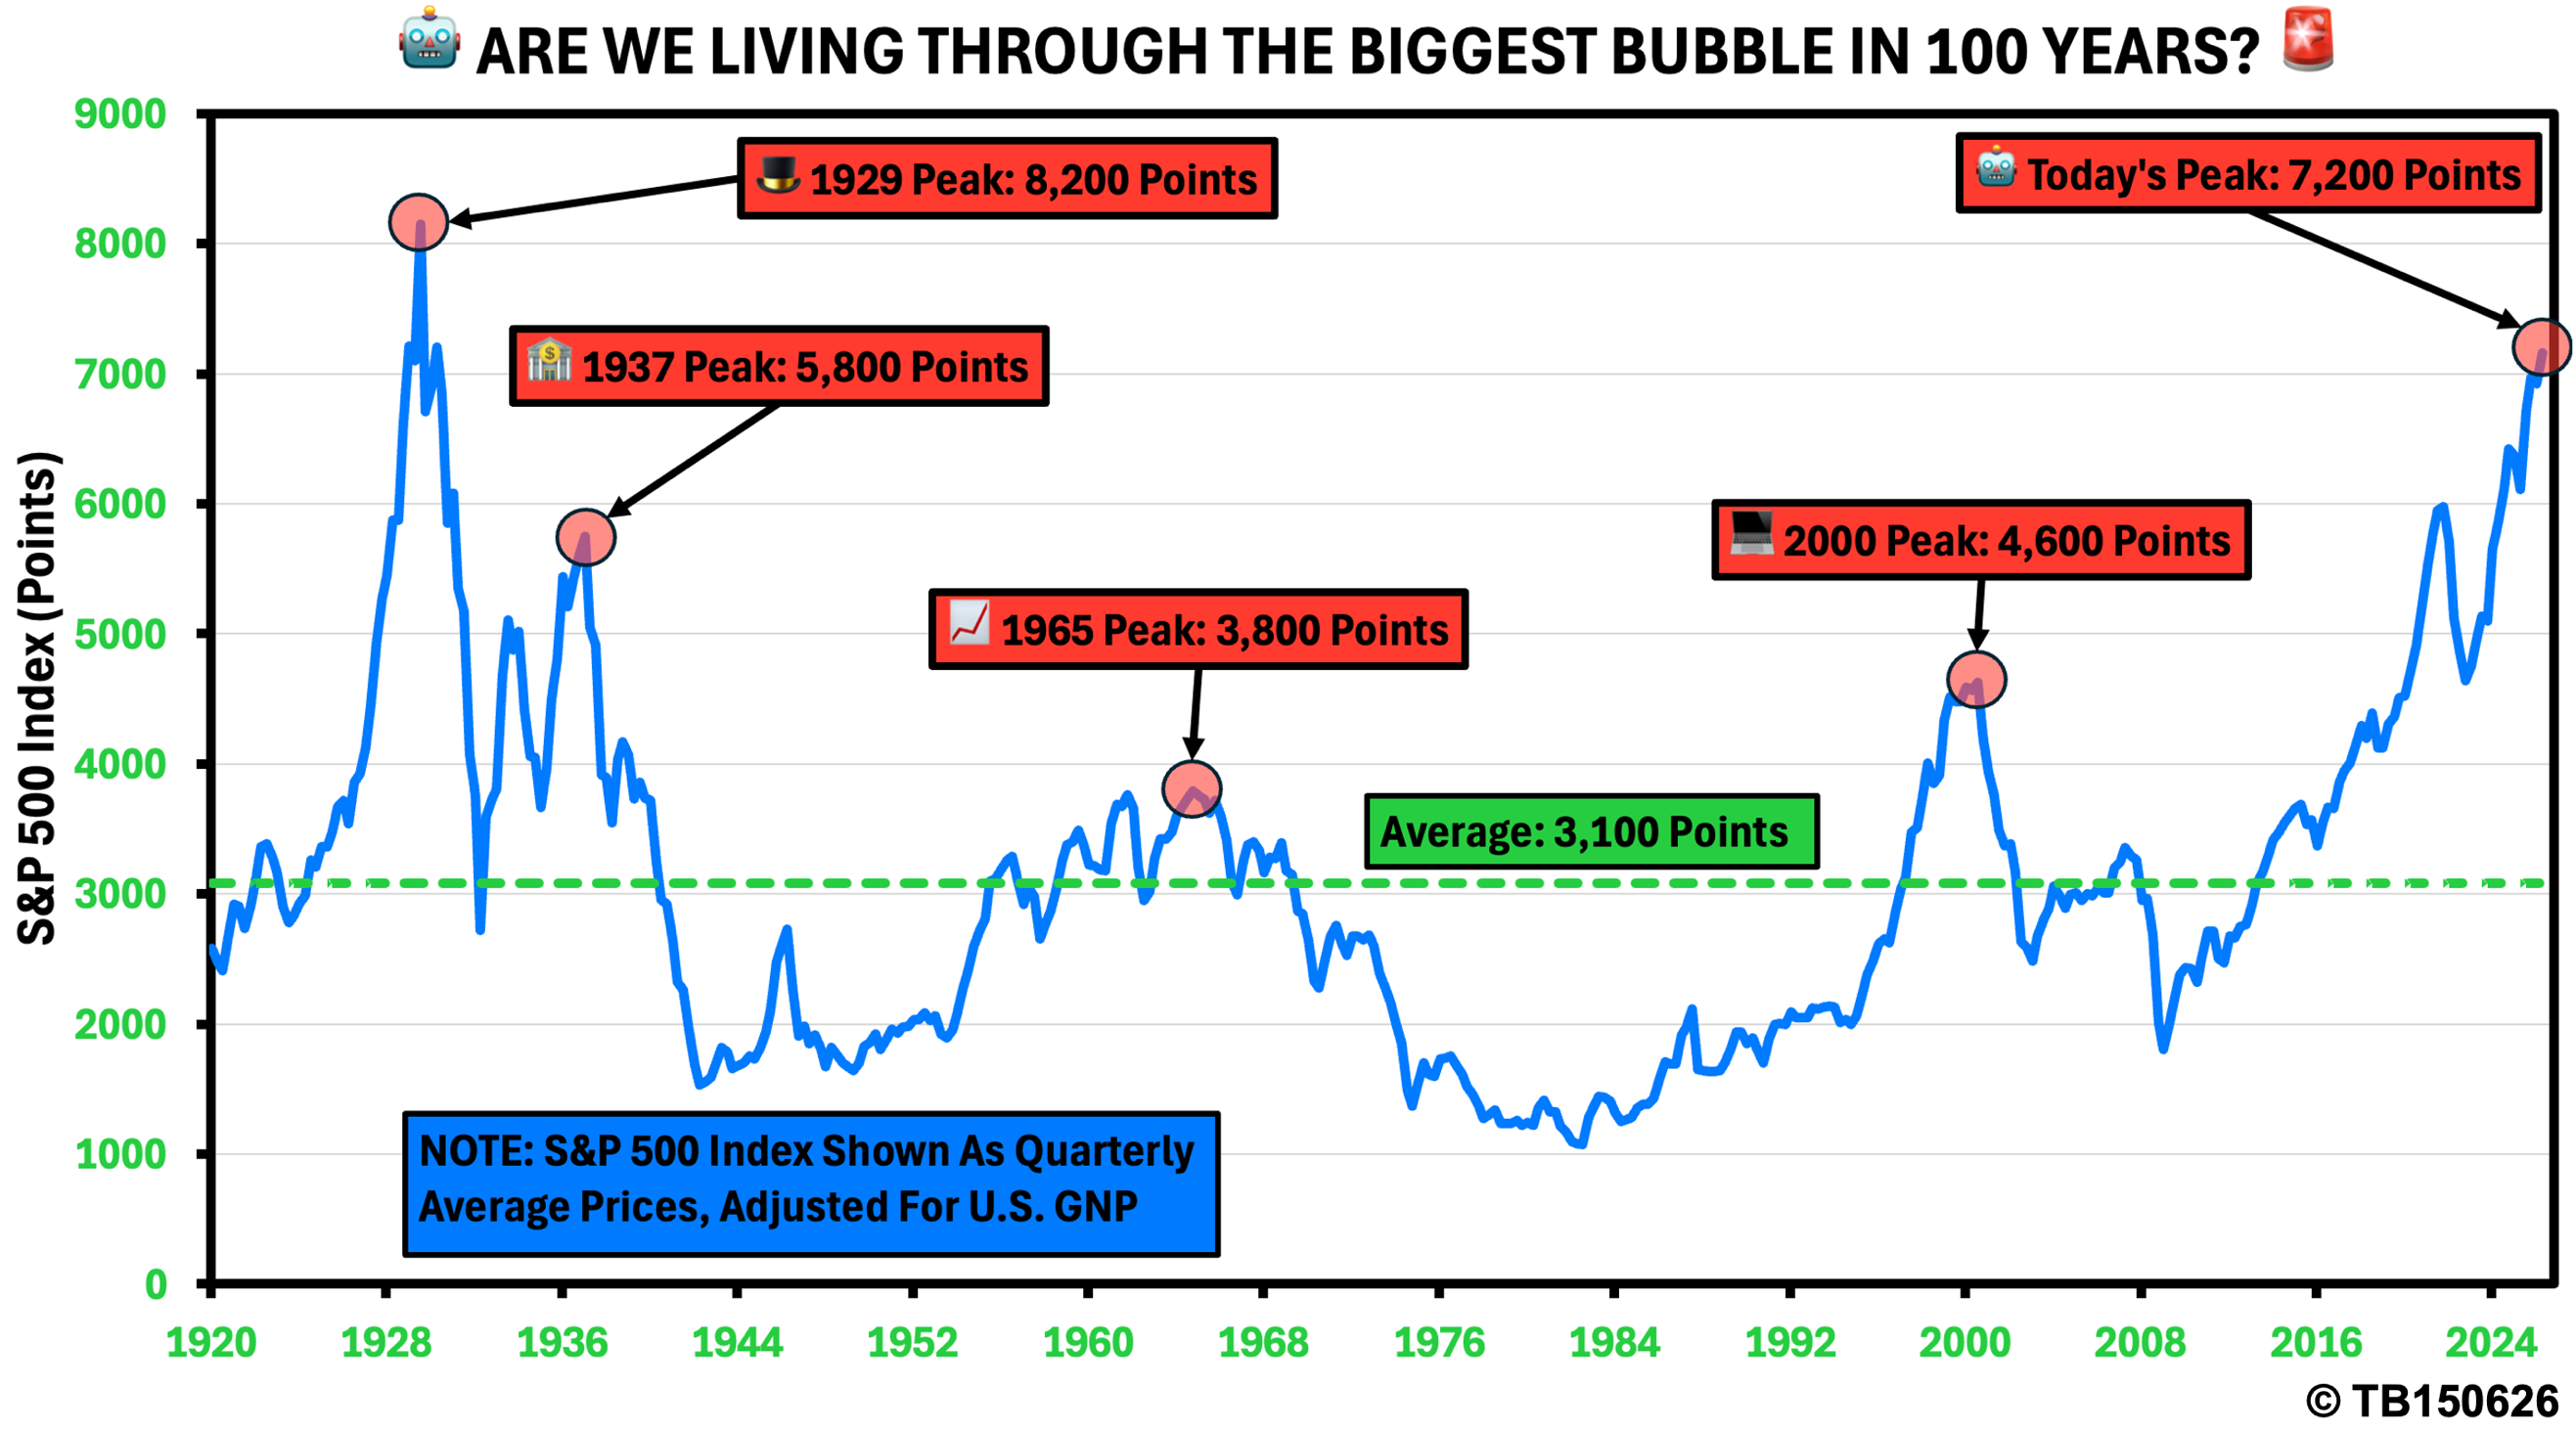
- 1929 “Roaring 20s” peak: 8,200 points
- 1937 “Roosevelt” peak: 5,800 points
- 2000 “Dot Com” peak: 4,600 points
- 1965 “Nifty Fifty” peak: 3,800 points
Only the 1929 “Roaring 20s” bubble reached higher levels than today. What followed? A record-breaking 86% collapse in equities. These comparisons do not guarantee a similar outcome. But they highlight how extreme current valuations have become by historical standards.
Reversion To Historical Norms Suggests Significant Downside Risk
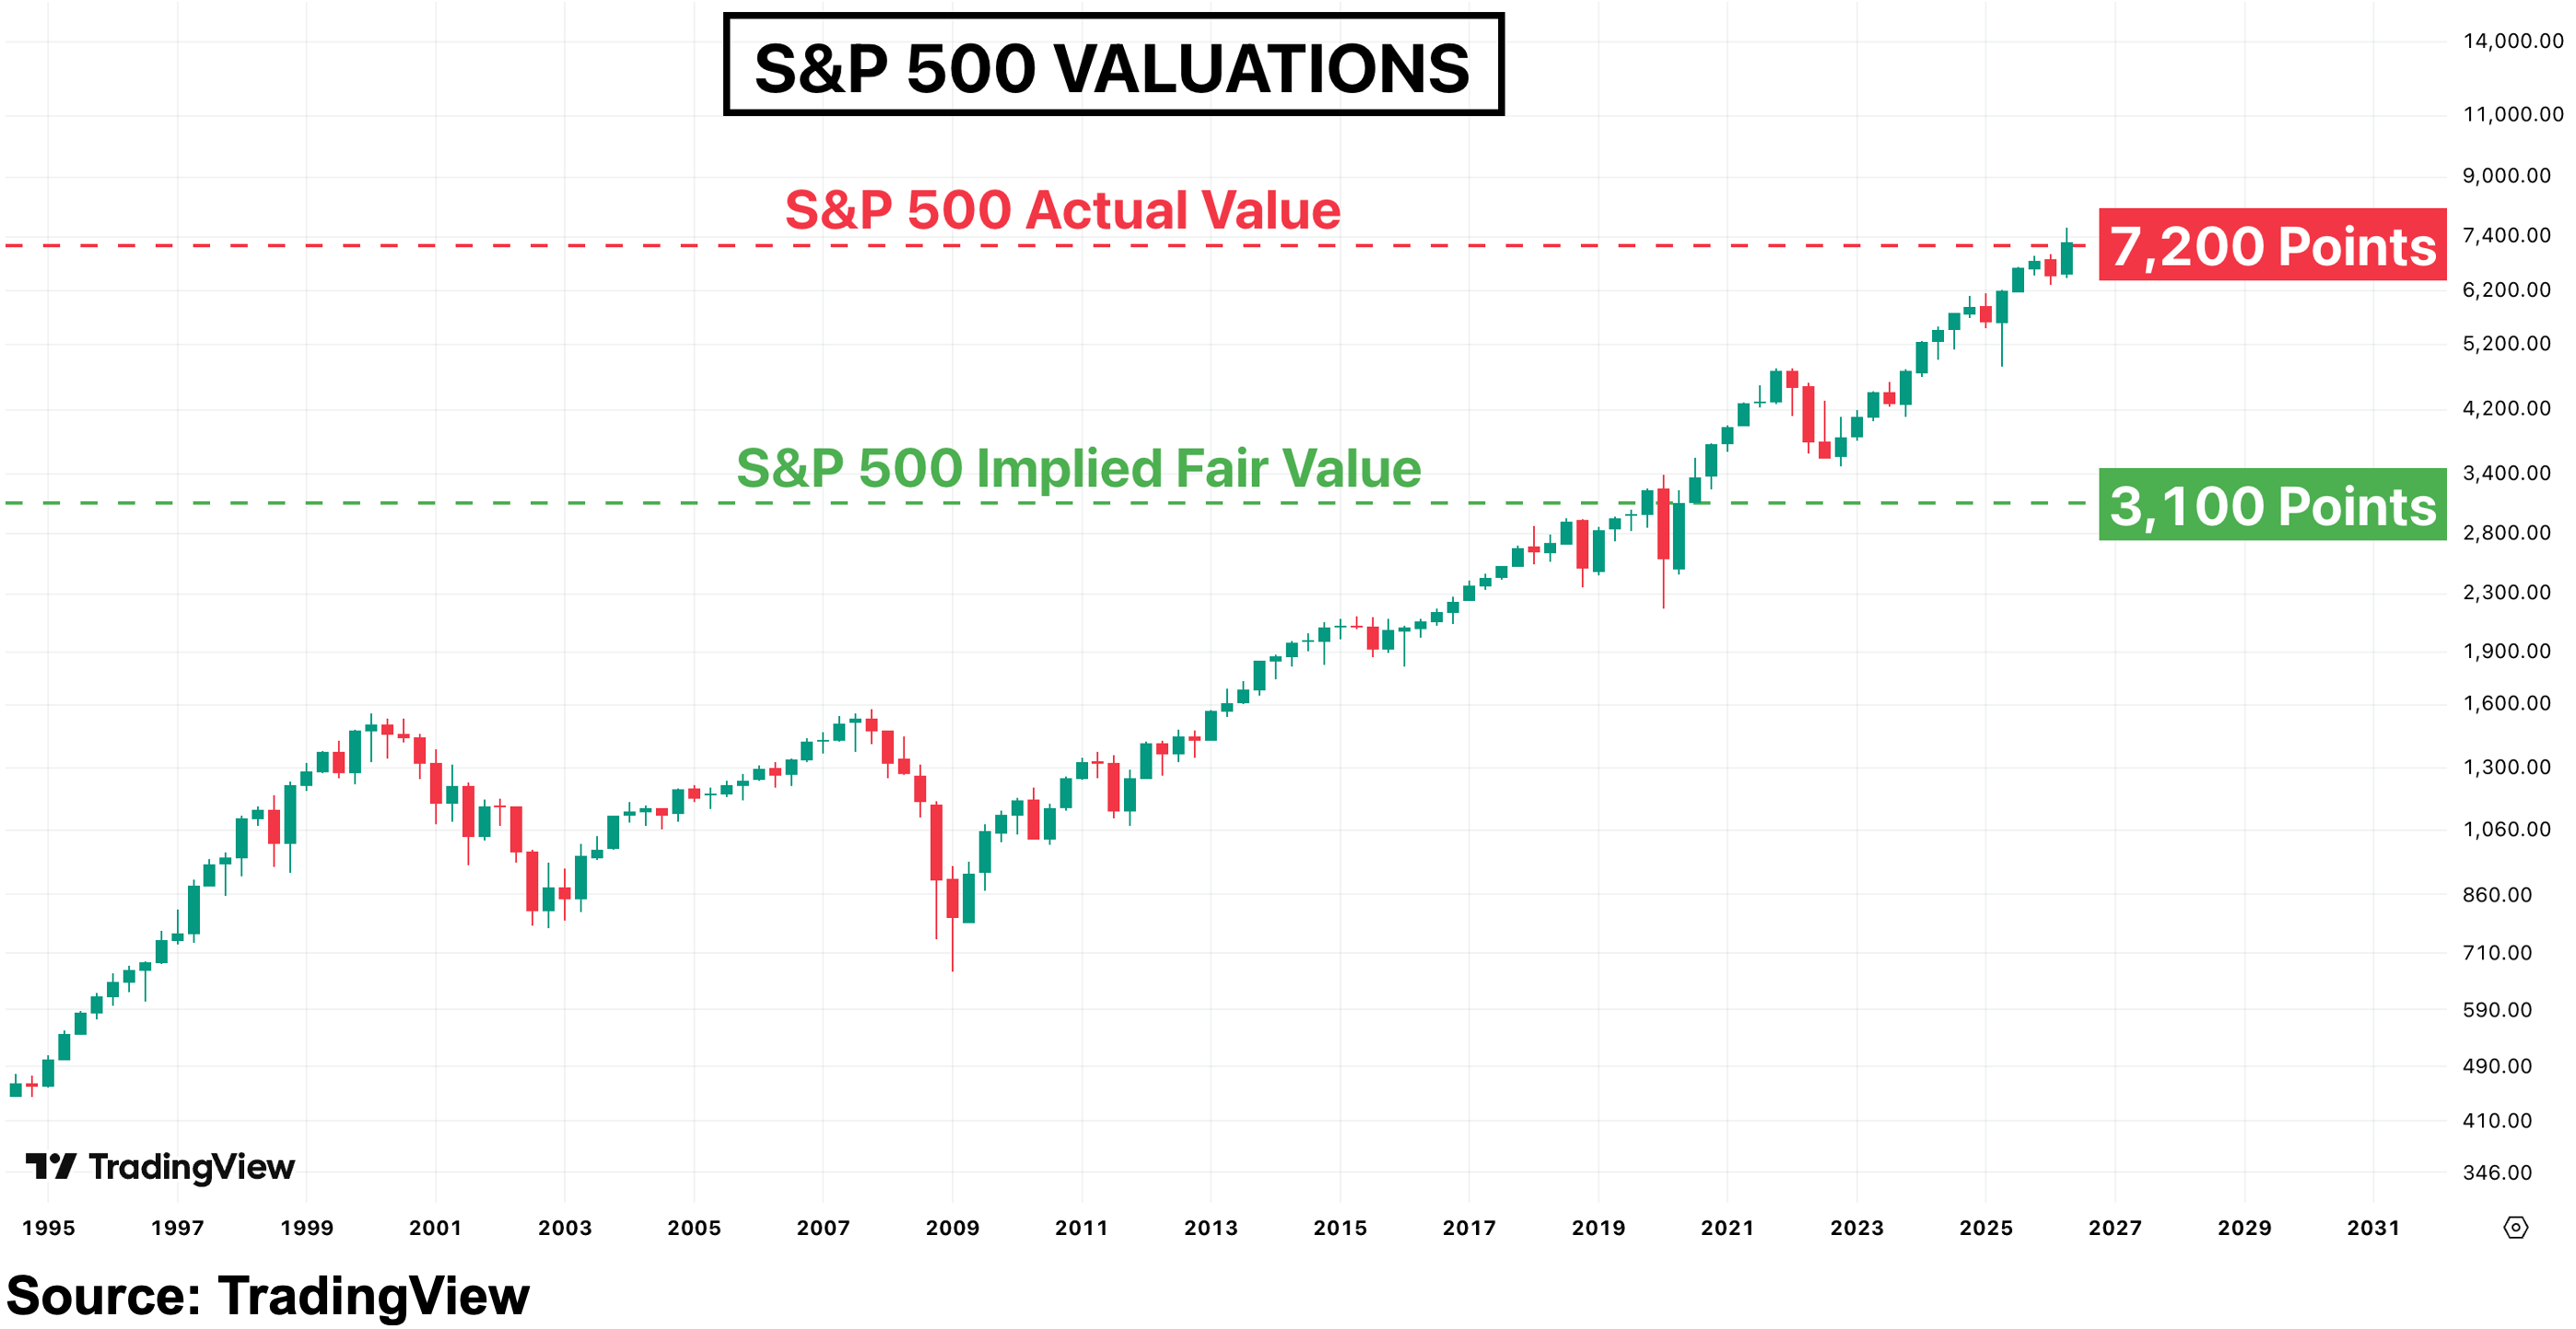
Long-term valuation averages imply a fair value closer to 3,100 points. At current levels, the market is trading approximately 132% above its historical norm. If valuations were to revert toward long-term averages, downside risk of around 57% could emerge over a 2-3 year period.
Duration May Be The Most Important Warning Sign
Extreme valuations are not unusual in themselves. What is unusual is duration.
- 1965 “Nifty Fifty” bubble: 2 years above average valuations
- 2000 “Dot Com” bubble: 3 years above average valuations
- 1929 “Roaring 20s” & 1937 “Roosevelt” bubbles: 5 years above average valuations
- 2026 “AI” bubble: 13 years above average valuations
This means the current expansion has lasted almost three times longer than the 1929 bubble. Time, in this case, may be the most important risk factor of all.
A Generation Of Investors Have Only Experienced Rising Markets
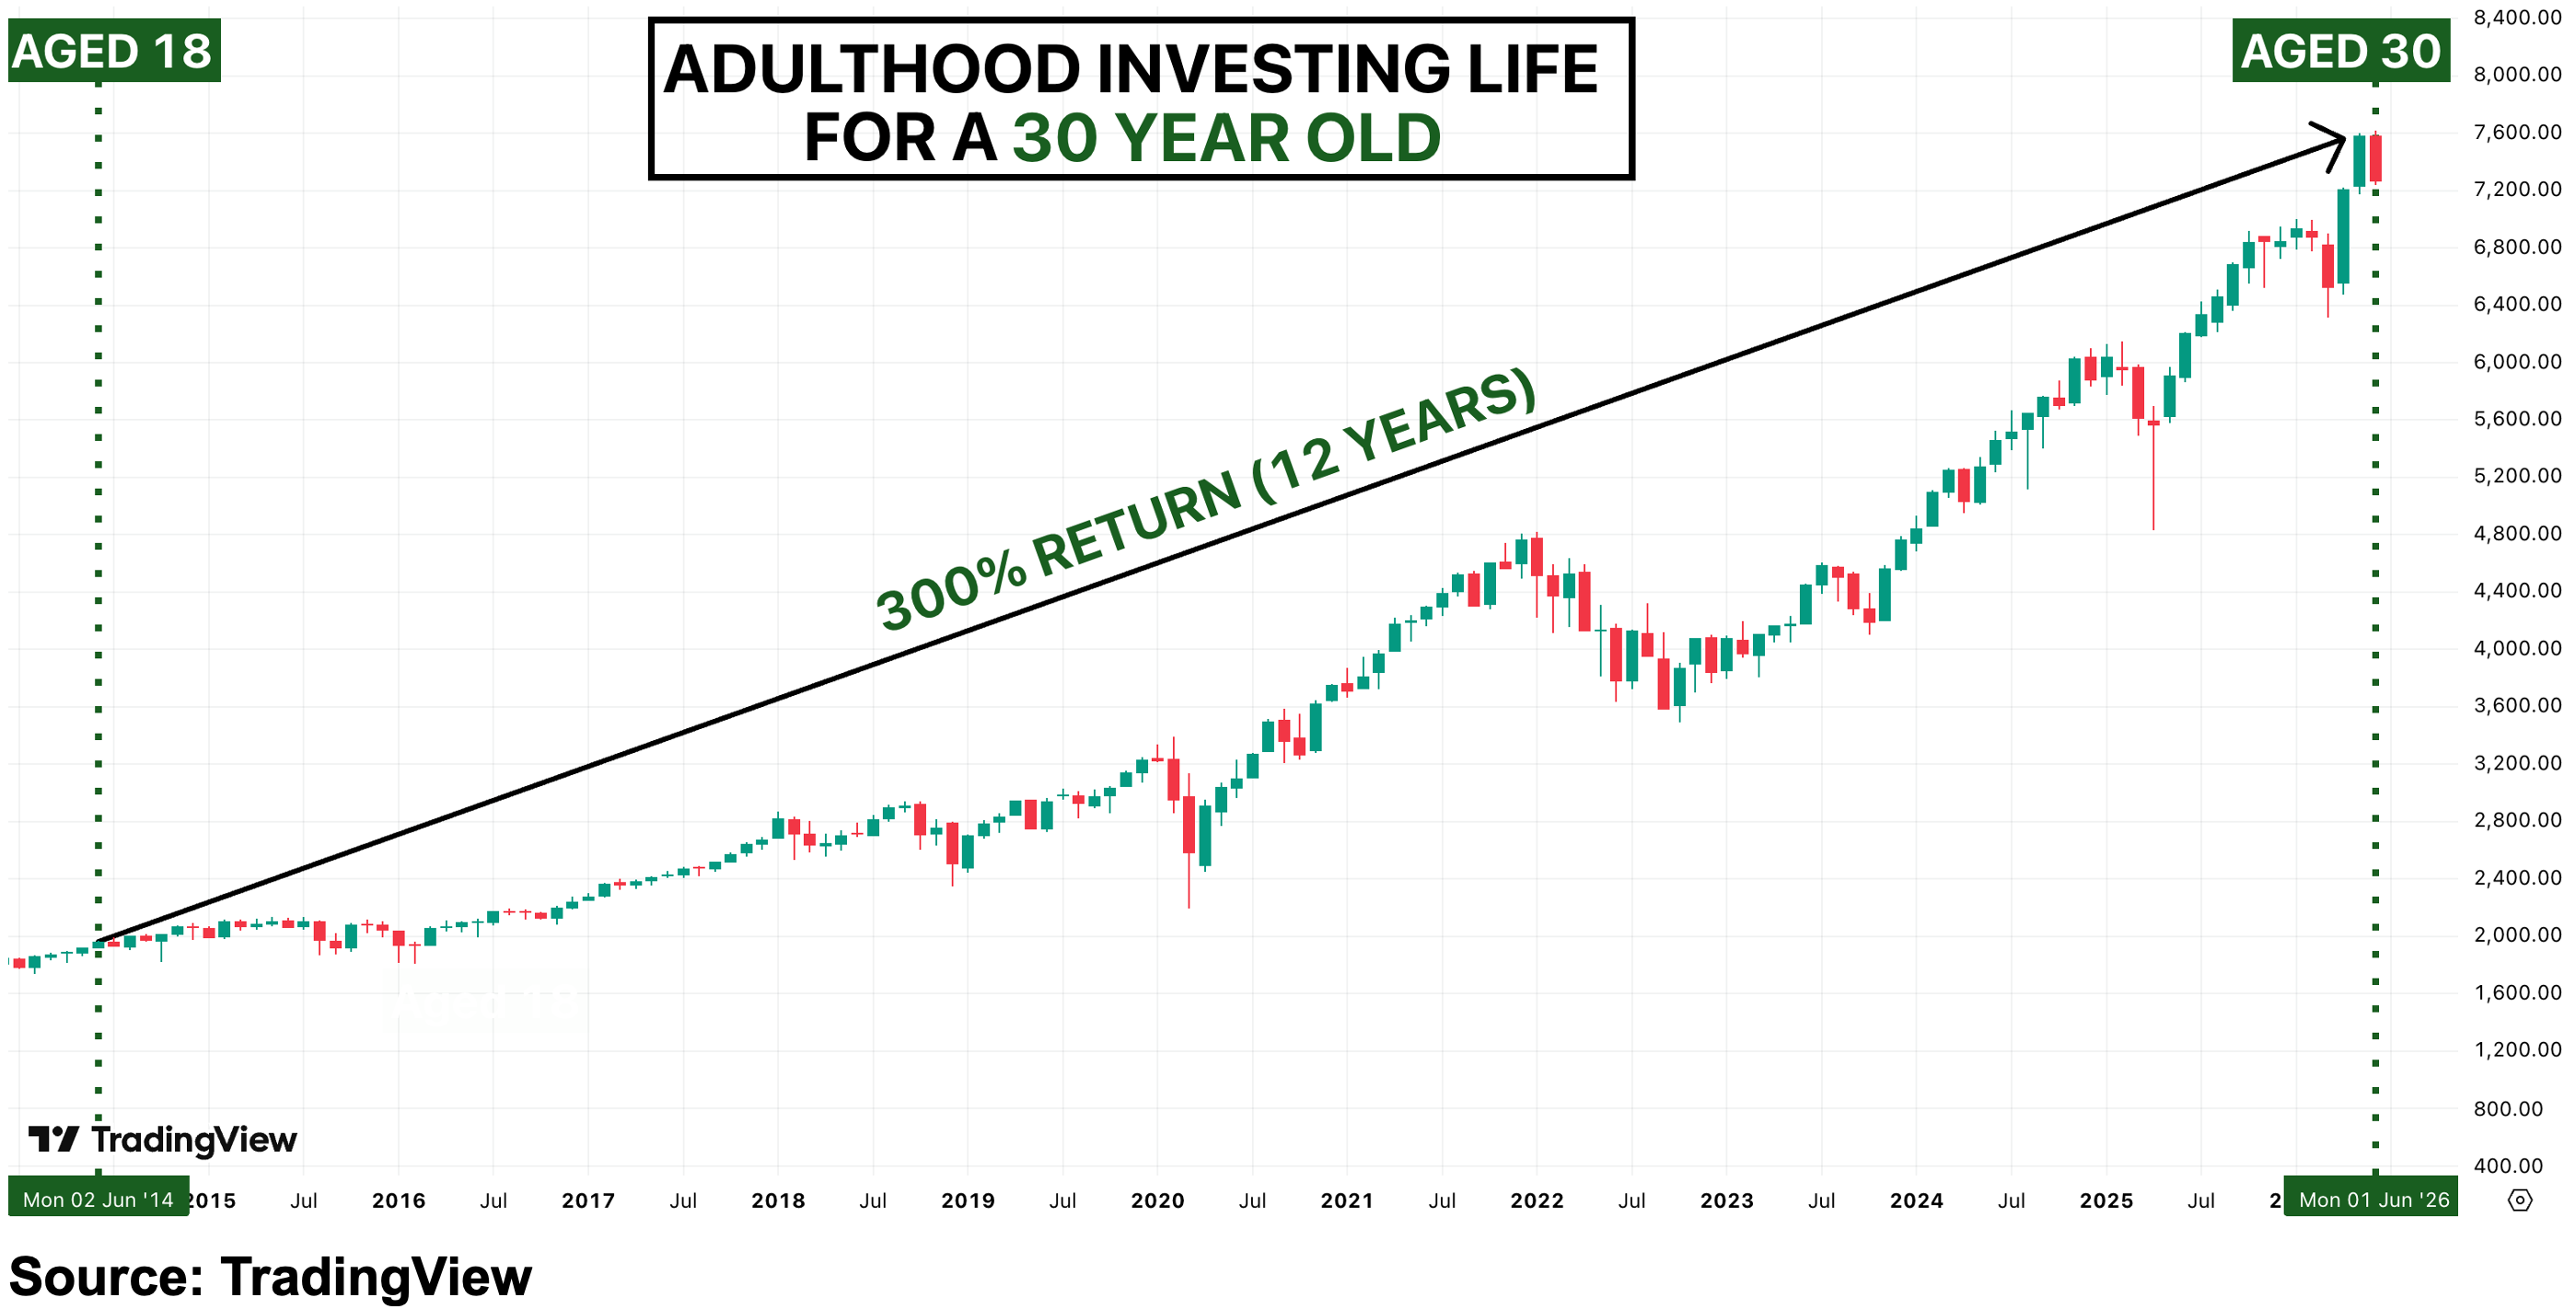
For younger investors, prolonged bear markets are largely absent from experience. Those aged 30 or under have spent most of their investing lives in an environment defined by:
- Extraordinary monetary stimulus.
- Strong equity market performance.
- Rapid recoveries after drawdowns.
As a result, many market participants have never experienced a structural bear market similar to previous decades. This is not just a financial shift. It is a psychological one. If conditions change, investor behaviour itself may be tested in ways not seen in this cycle.
Buying At Peaks Has Historically Been Costly
History suggests that entering markets during euphoric periods can carry consequences that extend far beyond short-term volatility.
- 2000 “Dot Com” high: 20 years to fully recover in GDP-adjusted terms
- 1965 “Nifty Fifty” high: 33 years to fully recover in GDP-adjusted terms
- 1937 “Roosevelt” high: 84 years to fully recover in GDP-adjusted terms
- 1929 “Roaring 20s” high: No full recovery in GDP-adjusted terms
These episodes highlight a simple but powerful lesson: Valuation matters. Paying extreme prices can turn temporary drawdowns into long-term wealth destruction.
The Market Is Asking Investors To Ignore History
Current conditions suggest the U.S. equity market is operating in one of the most extreme environments ever recorded.
- Valuations are stretched.
- Concentration risk is elevated.
- Sentiment remains optimistic.
None of this guarantees an imminent reversal. But it does raise a fundamental question: How much perfection is already priced into markets?
Positioning For A Wider Range Of Outcomes
After one of the strongest equity runs in history, the priority may shift from maximising exposure to managing concentration and preserving flexibility. When markets become increasingly driven by a narrow set of leaders and elevated expectations, portfolio construction becomes less about chasing returns and more about ensuring resilience across different macro and market regimes.
One practical consideration in such an environment is liquidity. Short-duration U.S. Treasury bills can provide capital preservation in nominal terms while maintaining optionality. Although they are not designed to outpace inflation over long periods, they can serve as a stabilising component during phases of heightened uncertainty or valuation compression.
Beyond traditional defensive positioning, diversification into assets with different return drivers may also become more relevant. Commodities, for example, can respond differently to equities than they do to inflation dynamics, supply constraints, and global growth cycles. Within that space, agricultural commodities may offer selective opportunities, particularly if broader commodity cycles strengthen.
Precious metals such as gold and silver can also play a role in portfolio diversification. Historically, they have tended to perform well during periods of currency weakness, inflation uncertainty, or financial stress. While they do not generate dividends, their value lies in their potential to act as a hedge against adverse macroeconomic scenarios affecting traditional financial assets.
Importantly, the objective is not to reduce equity exposure entirely or assume an imminent downturn. Rather, it is to avoid excessive concentration and ensure that portfolios are not overly dependent on a single outcome or continuation of recent market leadership.
Bottom Line
This is not about fear. It is about history, valuation and probability. Financial bubbles have repeatedly demonstrated that wealth built during euphoric phases can disappear with surprising speed. In some cases, recovery takes decades. In others, it never fully arrives.
Today, investors are effectively being asked to assume that this cycle is different. Perhaps it is. But history suggests that periods of extreme valuation and narrow leadership rarely resolve without consequence.