



Bitcoin clawed back more than 13% off its July 1 low, then stalled right under $68,000. The ETF rally everyone pointed to was never strong enough to break that ceiling, and on July 23 the streak that powered it broke. Below is the flow math, the on chain cost basis, and the derivatives read behind my base case, which has Bitcoin chopping into the Fed meeting instead of breaking out.
Bitcoin ETF Outflows Stall the Rally Below $68,000
Bitcoin slipped below $65,000 on July 24, 2026, trading near $65,400 as US equities fell on renewed Washington to Tehran tension. That interrupted a recovery of more than 13% off Bitcoin’s 21 month low near $57,800, set July 1. The engine of that recovery had already stalled a day earlier. US spot Bitcoin ETFs shed $225 million on July 23, their first negative session since the July 13, with BlackRock’s IBIT accounting for about $202 million of it on Farside Investors data.
What keeps me circling $67,000 to $68,000 is what sits there. Glassnode’s short term holder cost basis, the average price everyone who bought in the past five months paid, has hovered near $69,000, and price keeps stalling a notch beneath it. That is no accident. Recent buyers sit around breakeven there, and a nervous market runs into its own supply at cost.
Why the Bitcoin ETF Rally Still Lacks Conviction
The mainstream framing is simple: institutional demand is back, so the breakout is coming. It skips the denominator. The seven day streak pulled in $999 million against a first half of 2026 that bled roughly $5 billion, on the SoSoValue data CoinDesk tallied in June. Adding up Farside’s daily tape myself, July has actually run a $474 million net inflow through the 23rd. The complex is still down about $4.5 billion on the year against roughly $80 billion in assets, and that is the number the bullish framing leaves out.
Fair warning on my own thesis the eight sessions through July 23 still net out +$774 million. One red day does not end a trend. It does tell me the trend was never as deep as the headlines read.
Bitcoin Price Forecast
Every new Bitcoin analysis as it publishes, today's technical signal and key levels, live price — on one page.
See all Bitcoin forecastsThe cycle backdrop rhymes. When Bitcoin ran above $80,000 in May, open interest climbed while spot ETF flows stayed weak, the fingerprint of a leverage move with no cash buyers underneath. It unwound fast. Bitcoin broke a $58,035 low on June 25 with $484 million in leveraged liquidations that day, 70% of them longs as per news.bitcoin.com, then bottomed near $57,800 on the July 1. This bounce is the mirror image, spot led, a structurally healthier base.
What holds me back is the macro. The 10 year Treasury yield climbed to 4.67% by July 22 on the Fed’s own H.15 release and kept rising into Friday, its the highest since early 2025. Bank of America expects three quarter point hikes this year, though they pencil those in for September, October and December. Their own path leaves July alone, so what I am watching next week is the tone of the statement more than the rate.
Bitcoin Price Analysis: ETF Flows and Holder Demand
ETF Flows Never Confirmed the Bitcoin Rally
Seven straight inflow days reads like conviction until you weigh it. Just under $1 billion over the run clawed back barely a fifth of the first half’s outflow, and July 23 handed back nearly a quarter of the whole streak in a single session. That is what renting exposure looks like. Real accumulation doesn’t hand the position back in a day.
The on chain data agrees in a slower voice. Long term holders are back in net accumulation, but only around 50,000 to 100,000 BTC a month, against accumulation approaching 400,000 BTC during the upswings of November 2024 and May 2025, on the Glassnode figures CoinDesk published in the July. The strongest hands are buying again at a fraction of the pace they set when a bull leg actually had fuel. To me that is a floor being built, well short of launch power.
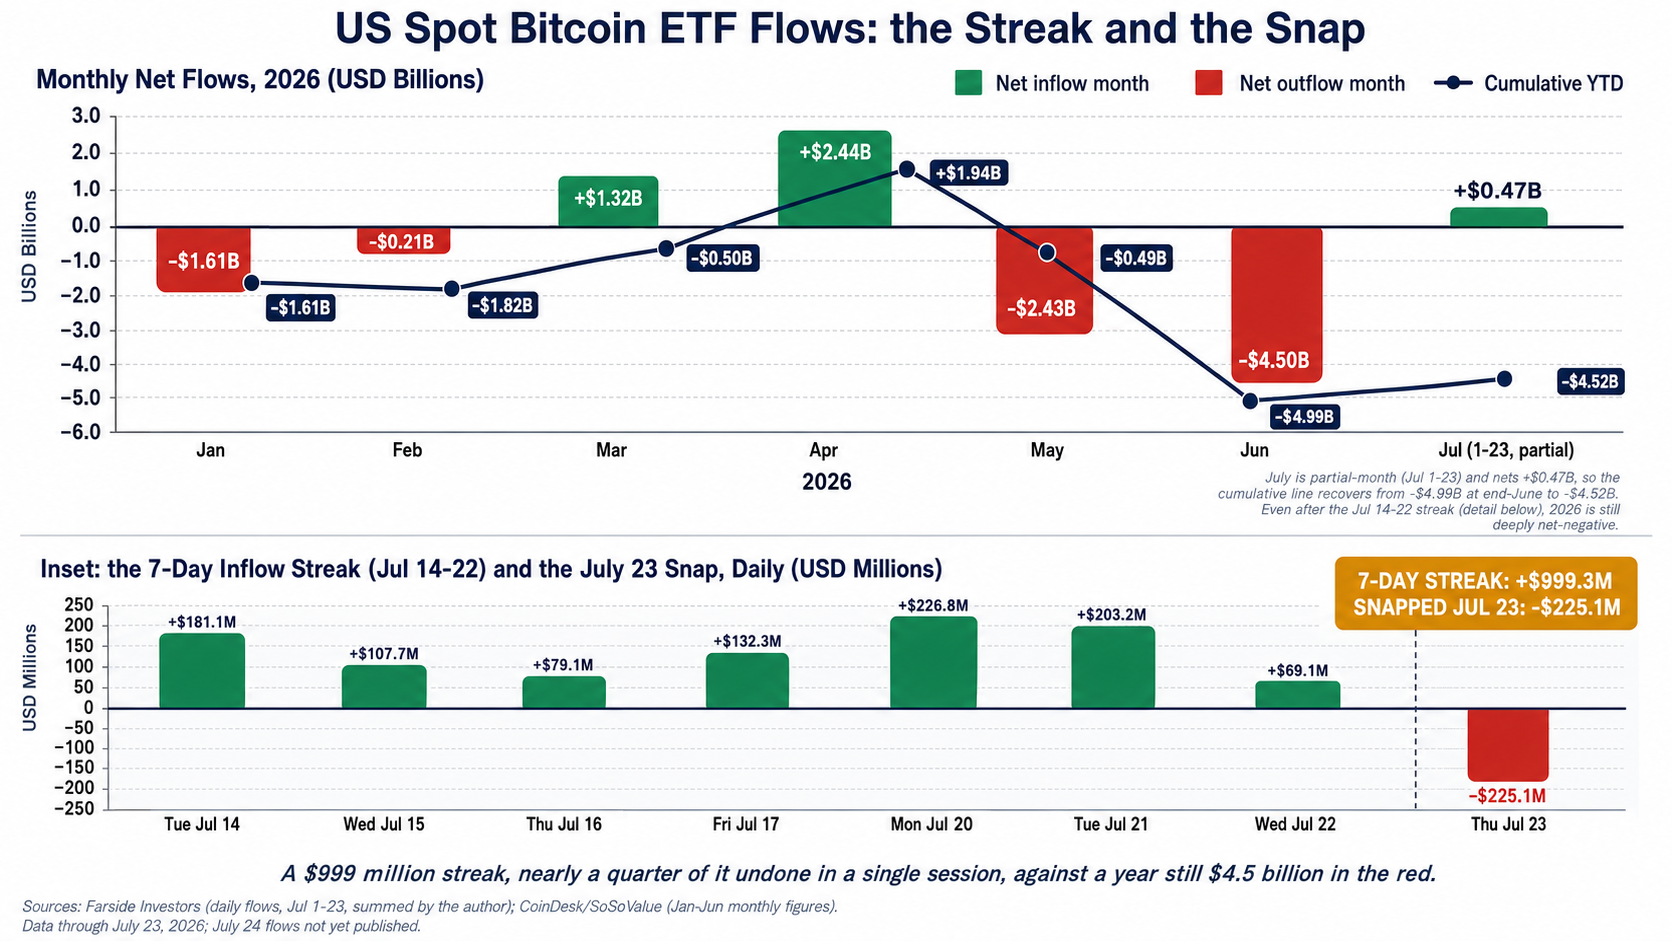
US Spot Bitcoin ETF Flows: Seven-Day Inflow Streak Snaps on July 23 – Source: Farside Investors, CoinDesk, and SoSoValue.
Bitcoin Derivatives Aren’t Pricing a Breakout
If traders truly expected $68,000 to break, it would show in positioning. It does not. The annualized perpetual funding rate sat near +4.5% in VanEck’s mid July Bitcoin ChainCheck, which compiles Glassnode data. That is a mild premium to be long, well below the crowded double digit readings that tend to precede a blow off top.
Options say it louder. One month put over call volatility skew has widened to +11.4 percentage points, the 83rd percentile since 2021, against just +1.7 points a year ago. Traders are paying up for downside protection, and Friday’s tape, with yields at an 18 month high and equities selling off, is exactly the risk that skew was hedging.
The one big bet the other way is a $2.5 billion Deribit call spread from July 18, 20,000 $70,000 calls bought against 20,000 $72,000 calls sold, both expiring July 31, per CoinDesk. I read that as one desk’s capped wager on tagging $72,000 by month end, which says little about where the broad market expects price to go first.
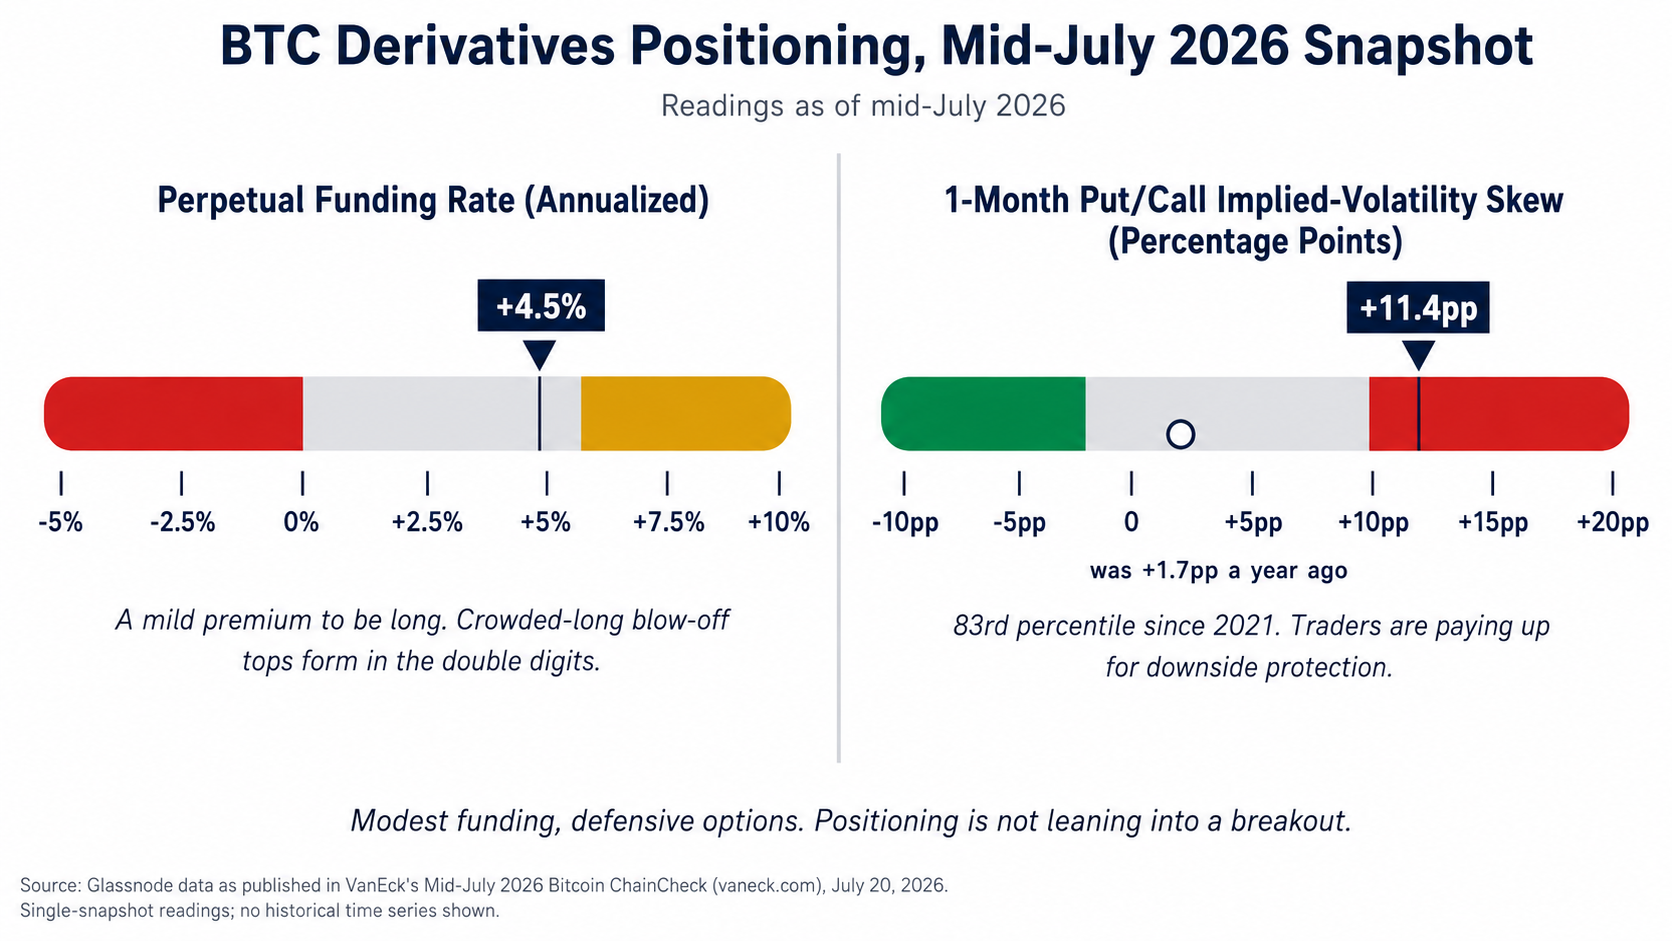
Bitcoin Derivatives Positioning, Mid-July 2026 – Source: Glassnode data published by VanEck.
Bitcoin Price Forecast: $62,000–$68,000 Into the FOMC
In my view, the flow and derivatives math argues against a clean break of $68,000 before the Fed acts, though Bitcoin trades inconsistently off FOMC outcomes, so I hold this as a lean I would not oversize. My base case is consolidation between roughly $62,000 and $68,000 through July 29, resolving close to or just after the decision, which lines up with the July 31 expiry on that Deribit spread.
A CME FedWatch based tracker prices only 63.5% odds of a hold as of July 24, with hike odds near 35% after roughly tripling over the prior week. Even the macro anchor is wobbling. A confirmed hold plus a flow trend that turns durably positive would open a path to $72,000 to $75,000 over the following four to six weeks. One good week does not count. That is the point where allocators who sat out this year’s outflows get a cleaner entry.
The adverse case is already partly in motion. The July 23 redemption, rising yields and a hawkish surprise together put $58,000 to $62,000 back in play, roughly a retest of the June low. The $484 million cascade on June 25 shows how fast that can move once it starts. What flips my view is a decisive daily close above $68,000 on rising funding and open interest before July 29. That would be leverage finally taking over the move.
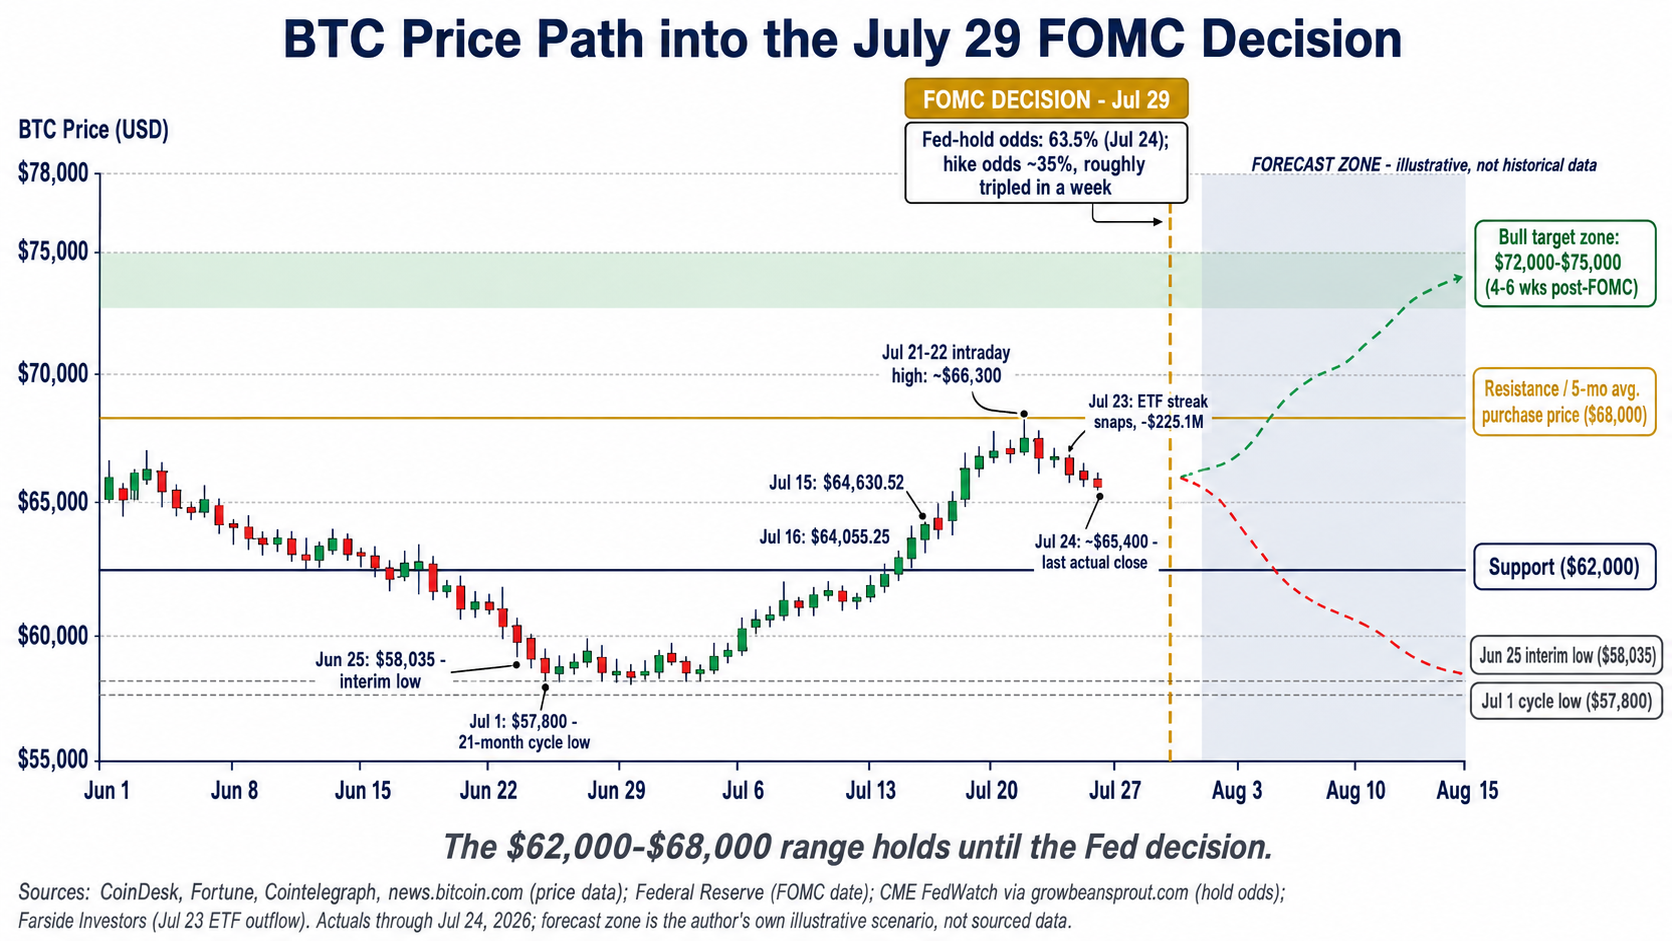
Bitcoin Price Scenarios Into the July 29 FOMC Decision – Source: CoinDesk, Fortune, Cointelegraph, news.bitcoin.com, Federal Reserve, CME FedWatch, and Farside Investors.
Bitcoin Outlook Hinges on Fed Policy and ETF Demand
My base case is a range bound Bitcoin between $62,000 and $68,000 into the July 29 FOMC decision, with a break toward $72,000 to $75,000 or a slide toward $58,000 to $62,000 hinging on how the Fed and the flow trend resolve together. One good week of ETF buying does not settle it, and July 23 is the first hard evidence that the thin part of my thesis was right.
Zoom out and I stay constructive over six to twelve months. A spot led recovery off a deleveraged base is a healthier foundation than the leverage driven rally that failed in May. And a year this heavy with outflows leaves plenty of room for a real trend change once allocators come back at size. This follows my July 9 Bitcoin forecast, written when the level in question was $58,000. It’s $68,000 now, which tells you how fast this picture moves. I’ll watch the July 29 decision on the Fed’s FOMC calendar for the next read.