



Copper (XCU) prices remain close to record levels despite the broader correction in metals. The strong manufacturing activity in China and falling production in Chile continue to support the copper market. But weak Chinese property investment and overbought price conditions create a risk of short term volatility. The long term structure remains bullish but copper must hold the $6 support area to maintain its immediate trend. This article presents the key demand and supply drivers, price structures and correlated markets that may shape the next move in copper prices.
China Manufacturing Growth Supports Copper Prices
Copper prices remain strong due to the strong industrial activity in China and tight global supply despite the overall correction in metals in 2026. The chart below shows that the industrial profits of China increased by 18.7% YoY to CNY 3.95 trillion in H1 2026.
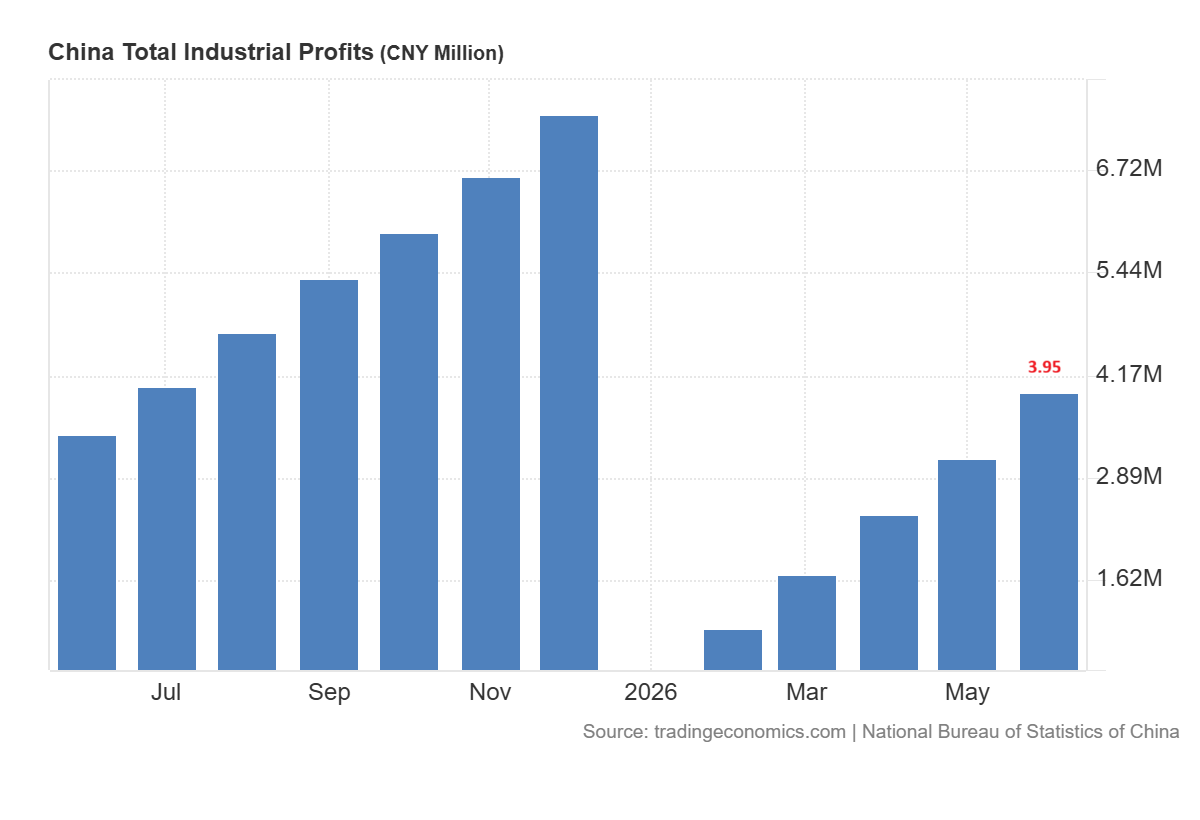
The manufacturing profits also increased by 20.1%. These profits are supported by strong manufacturing output which increased to 6% in June as seen in the chart below.
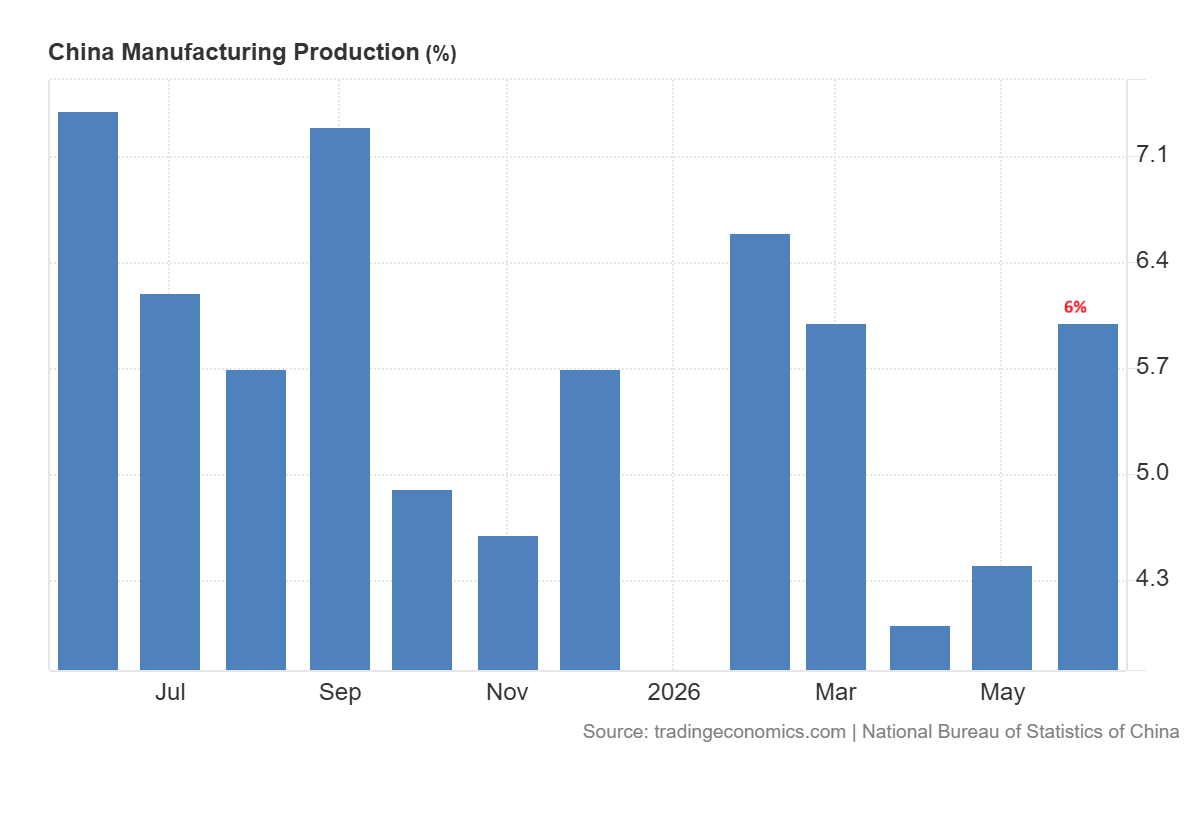
This strength in the industrial profits is because China consumes more copper than any other country. These high profits help manufacturers to maintain production and support strong demand for industrial metals.
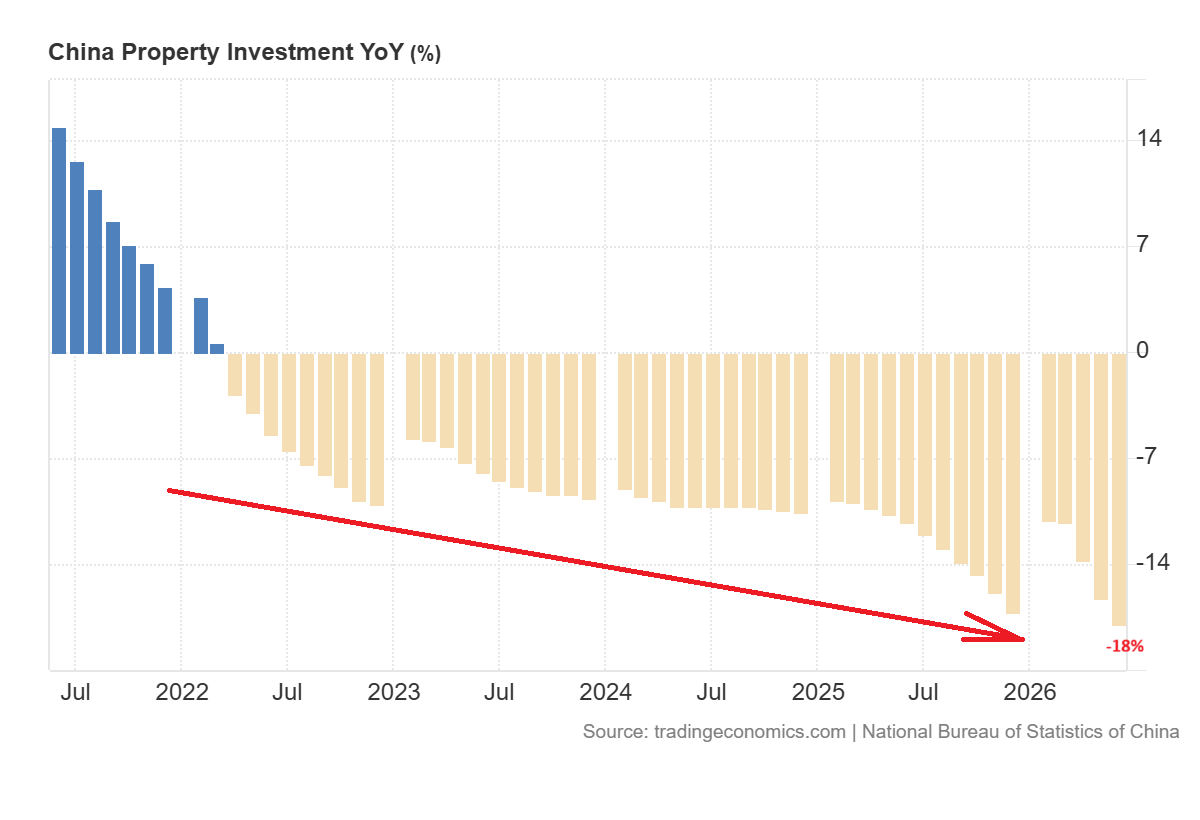
But the recovery in China remains uneven. This is because the high technology manufacturing regions continue to outperform areas that depend on property and traditional industries. The growth in electric vehicles, artificial intelligence, robotics and power infrastructure should support the copper consumption. But weak property investment may limit the demand from construction. The chart below confirms that the property investment in China dropped by 18% YoY in June.
Meanwhile, the new home prices also dropped 3.3% YoY in June 2026.
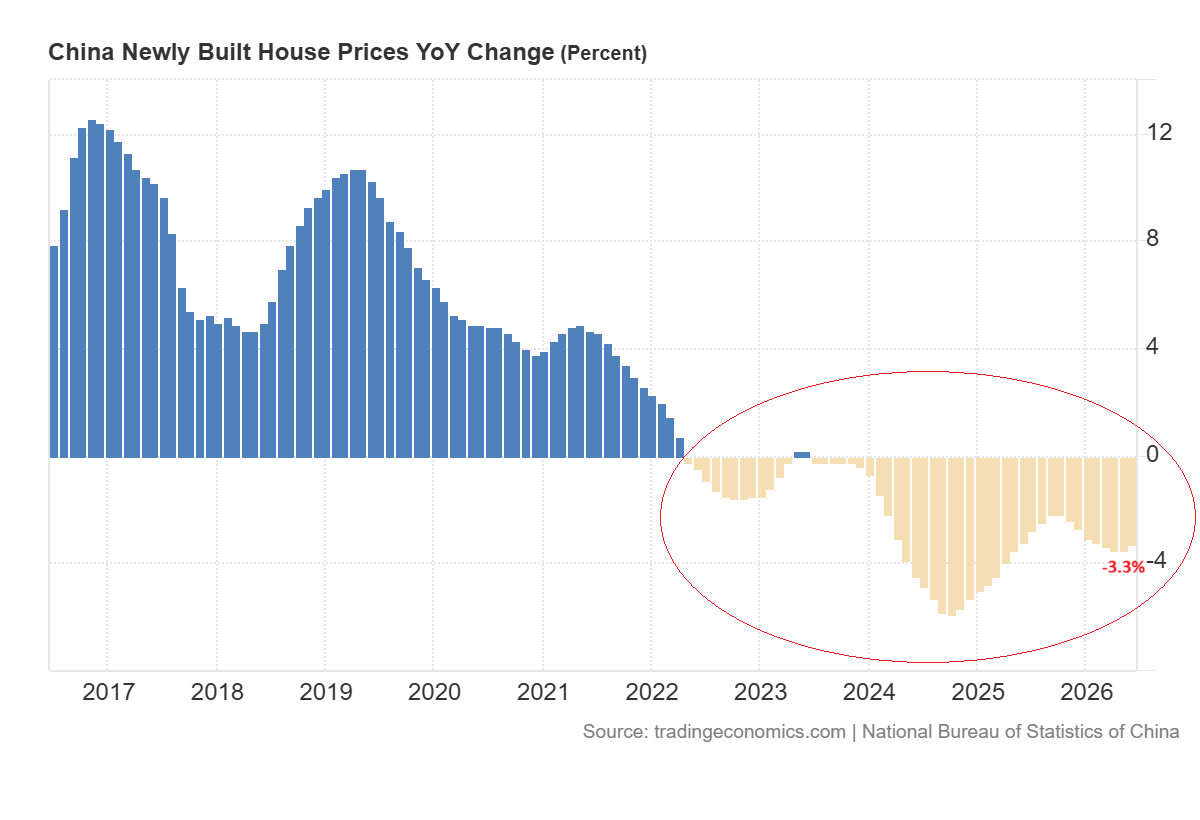
This data creates a mixed outlook as new industries replace some of the demand lost from property sector.
Copper Price Forecast
Every new Copper analysis as it publishes, today's technical signal and key levels, live price — on one page.
See all Copper forecastsChile Copper Production Drop Tightens Global Supply
The supply concerns also provide strong support. The chart below confirms that the copper production in Chile dropped by 12.9% YoY to 423,623 metric tons in May. This followed 13.8% decline in April.
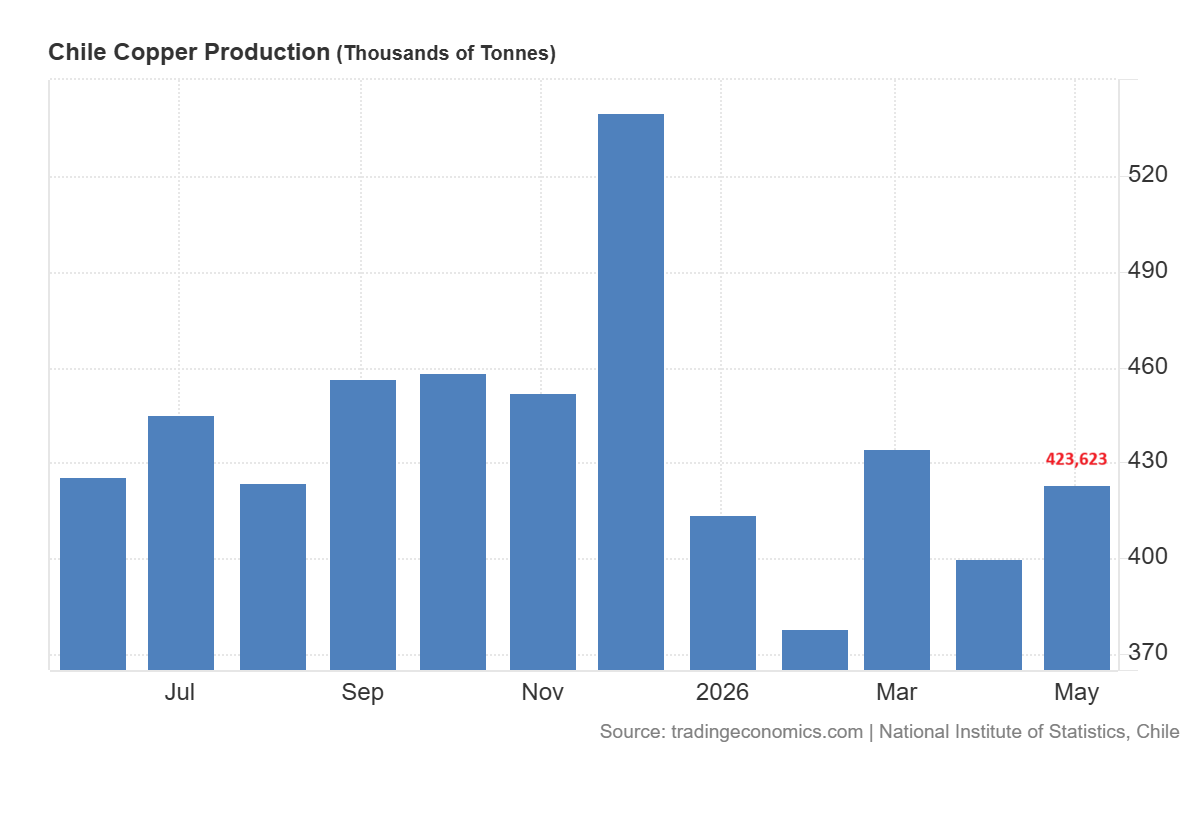
There are severe storms observed in Chile which have now increased the risk of further disruptions. If the output in Chile remains weak for a long time, it could tighten the market as the country is the largest copper producer in the world.
The copper price is dropping from the record levels due to broader metals weakness. But the price still holds the major support levels. The price is still over 10% up from a year earlier and remains close to the June record level. The strong annual gains indicate that market has already priced in part of the supply shortage. This may cause short term volatility but tight Chinese supply and lower Chilean production continue to support the broader trend.
Copper Price Outlook Remains Bullish Above $5
The long term outlook for the copper market remains strongly bullish as the price exceeded $5.80 in Q2 2026 and closed above the long term resistance level. The price action in Q3 2026 is also bullish and suggests continued upside. But the price has already reached an extremely overbought level in the short term. Therefore, if any correction develops from this region, it will not surprise the market.
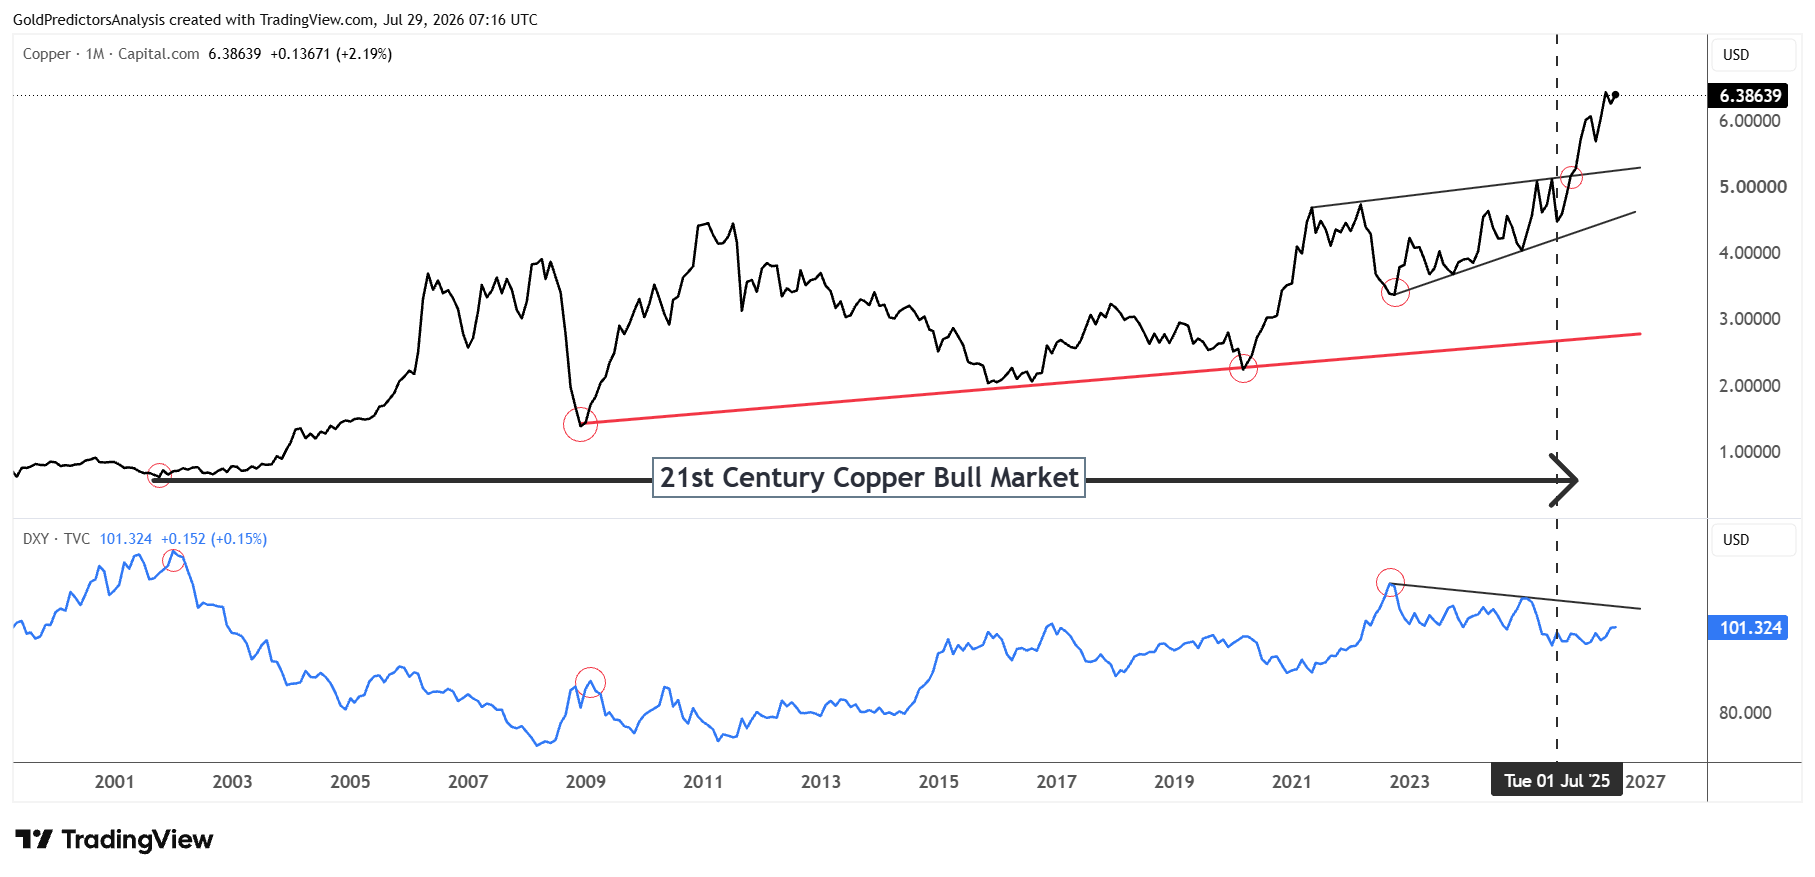
It is observed that the long term ascending channel that started in 2002 is now intact in 2026. The bullish structure started producing bull signals in Q2 2026.
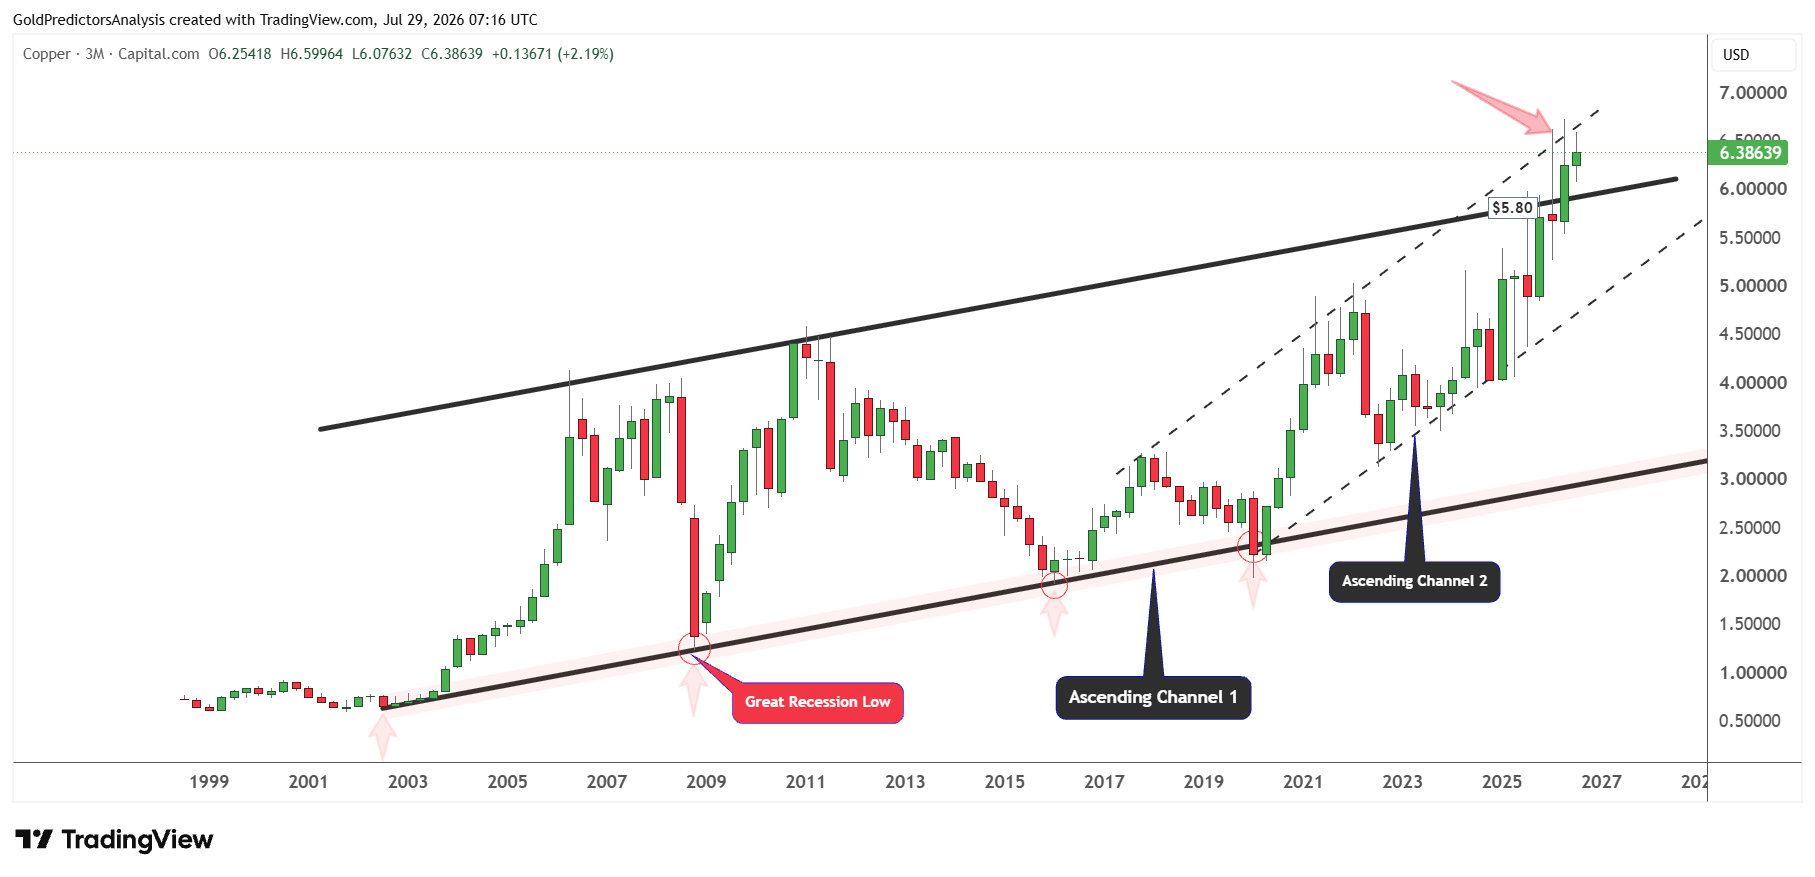
The bullish structure is further observed on the monthly chart which shows the formation of a double bottom pattern at the long term ascending trend line that stretched from the December 2008 lows.
The price has been trading within the ascending channel pattern since the February 2020 lows. The long term support now remains at $5.20. Any correction back toward the $5 area will offer a long term pivotal point for investors.
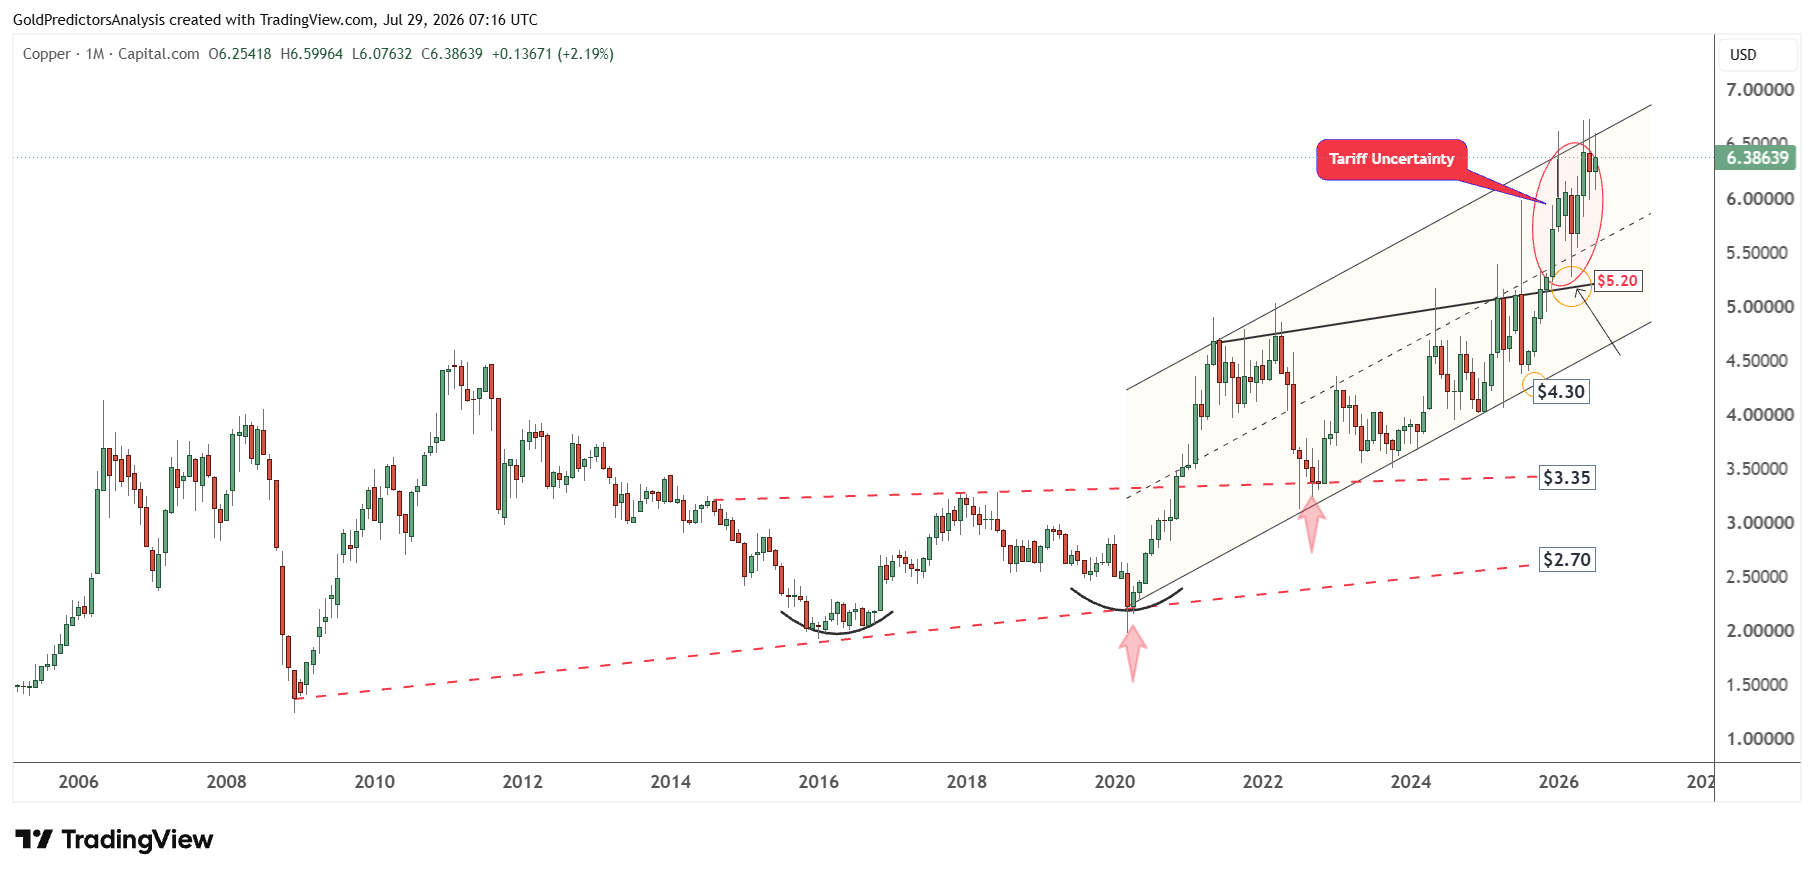
This bullish structure suggests that copper prices may remain higher for longer period. But the tariff uncertainty has produced strong volatility. This means that if any correction develops from the current levels, it might be short-lived and introduce renewed buying pressure.
Copper Price Tests $6 Support as $6.70 Breakout Nears
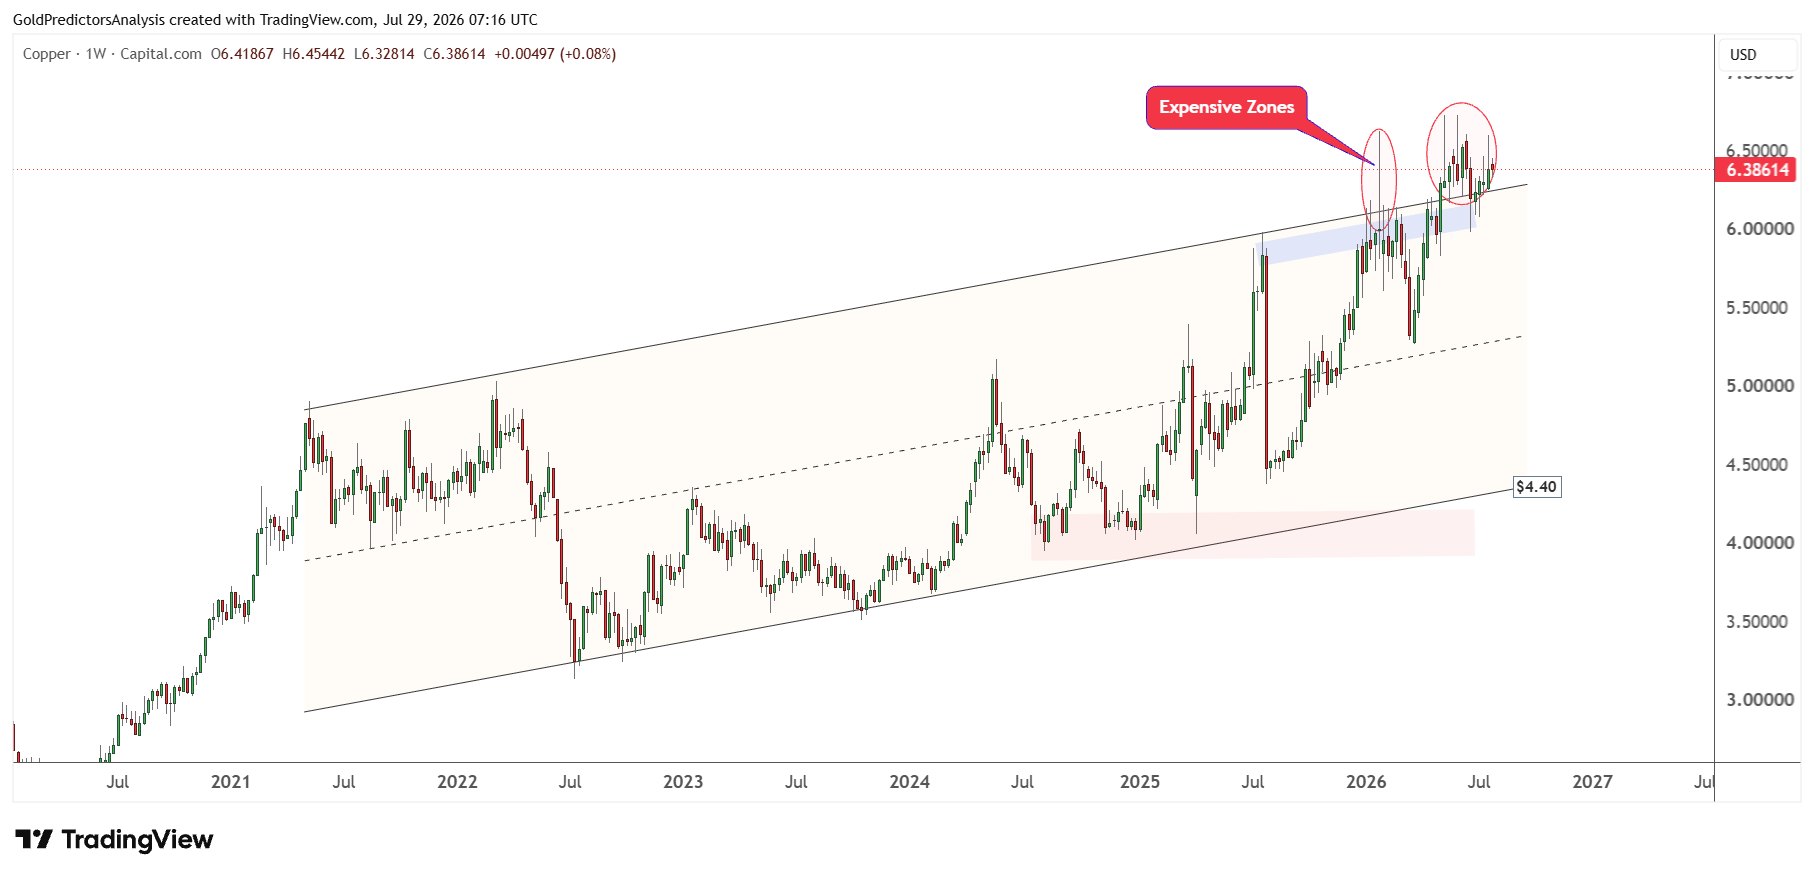
The ascending channel pattern seen on the quarterly and monthly charts shows that the price has already broken above $6 and consolidated at higher levels. But the sharp shadows on the weekly candles indicate that there is some potential for correction in copper before the next rally. If any correction develops from this area, the $5 may be the strong support for the next big rally.
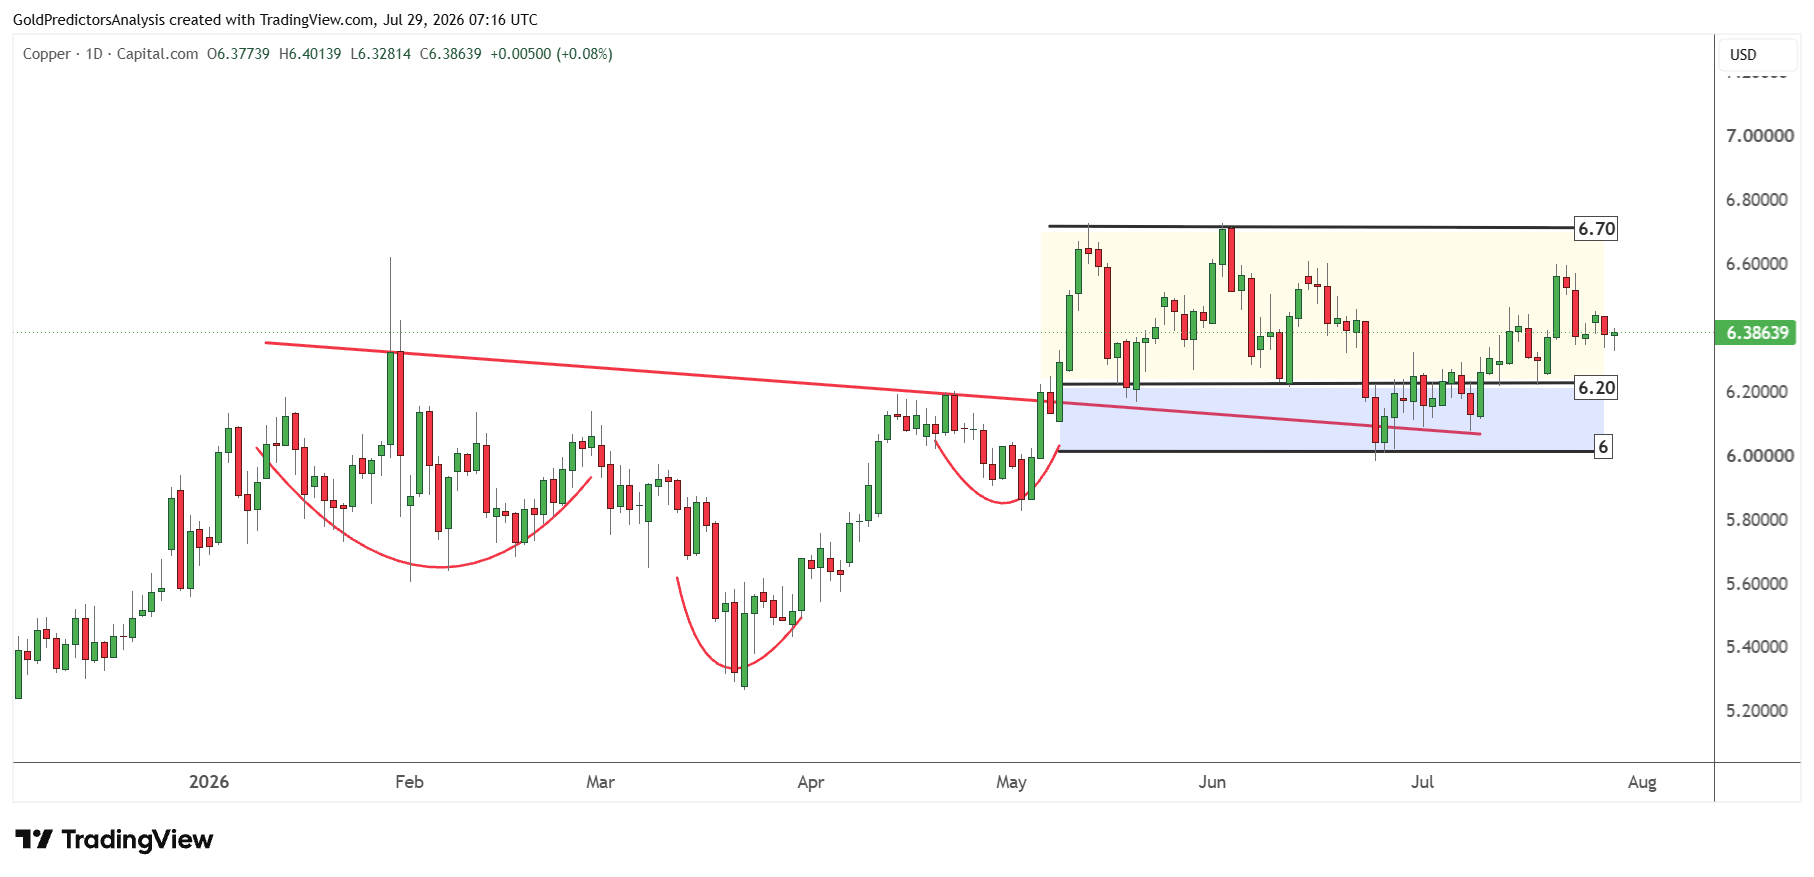
The daily chart further supports the bullish outlook and shows the formation of an inverted head and shoulders pattern. As long as the $6-$6.20 area holds, the immediate trend in copper remains bullish. But a break above $6.70 may introduce a new rally in copper.
US Dollar and Copper to Silver Ratio Signal More Upside
It is interesting to note that the U.S. Dollar Index and the copper market have shown an inverse correlation over the long term. The weakness in the U.S. Dollar Index produces a copper rally. The U.S. Dollar Index has been trending lower since 2022, while the copper market has been trending higher since 2020.
But after July 2025, the U.S. Dollar Index failed to break below the 96 level and consolidated near 100. Despite this strength in the U.S. Dollar Index from the 96 level, copper prices surged from $4.50 to $6 area. This indicates that copper is ignoring the broader market weakness and continues to surge due to supply shortages.
The outperformance of the copper market is also evident through the copper to silver ratio, which shows that copper has produced a low. This low was formed after the silver price produced a record high at $120 in January 2026. The ratio recovered above 0.107 and continues to rally toward the resistance areas. The breakout above 0.107 in copper to silver ratio indicates that copper may continue to rally.
Bottom Line
Copper remains supported by strong manufacturing activity in China and falling production in Chile. The weak property investment in China may limit some demand, but the growth in electric vehicles, artificial intelligence, robotics and power infrastructure may offset the part of this weakness. The supply disruptions in Chile could also keep global market tight. These factors support the bullish long term outlook for copper.
But the copper price remains overbought after its strong rally in the last five years. This increases the risk of a short term correction. The $6 area is the first important support while the $5-$5.20 region provides stronger long term support. A break above $6.70 could trigger another rally. Therefore, short term volatility may continue but the broader trend remains bullish while the major support levels hold.