



Copper (XCU) remains strong near the record high after rising for five straight sessions. The drop in Chinese inventories and higher Shanghai spot premiums show that the supply remains tight in the short term. The disruptions at the mine also support the price. But the weak import demand and pressure in the property sector in China may slow the rally. The technical outlook remains positive while the ratios between copper, gold and silver suggest improving strength in copper. This article presents the important fundamental, technical and risk factors that may shape the next move in copper prices.
China Copper Inventories Fall as Shanghai Spot Premiums Rise
Copper trades near $6.70 a pound on Monday after a strong rally last week. The price has risen for fifth straight session. Fresh data show that copper inventories across major Chinese markets dropped by 14,500 tonnes over the past week to 74,800 tonnes. The stocks now stand 65,300 tonnes below the level seen a year ago. This drop supports copper because buyers have less availability of metal.
The Shanghai market also shows tight supply. Local inventories dropped to 43,900 tonnes. This was 14,700 tonnes lower than the level recorded on September 17. Spot copper premiums rose by 90 yuan to the average of 825 yuan per tonne. Some buyers later paid premiums near 1,000 yuan to secure metal.
The nearby SHFE backwardation also widened to 400-470 yuan per tonne. These moves show that buyers are paying more for immediate delivery. SMM also expects copper rod operating rates to rise to 68.12% this week. This suggests a modest improvement in near term downstream activity.
But the demand for imported copper showed some weakness. The Yangshan warrant premium dropped by $5 to $119 per tonne. The bill-of-lading premium also dropped to $113. Importers faced the estimated loss of 1,130-1,280 yuan per tonne.
This loss may discourage fresh imports in the short term. Meanwhile, ongoing mine disruptions in Chile, Indonesia and the Democratic Republic of Congo continue to limit supply. In my opinion, falling Chinese inventories support copper prices but weaker import demand may slow the rally near the record high.
Copper Price Forecast
Every new Copper analysis as it publishes, today's technical signal and key levels, live price — on one page.
See all Copper forecastsCopper Technical Analysis: Recovery Above the 50-Day SMA Supports Bulls
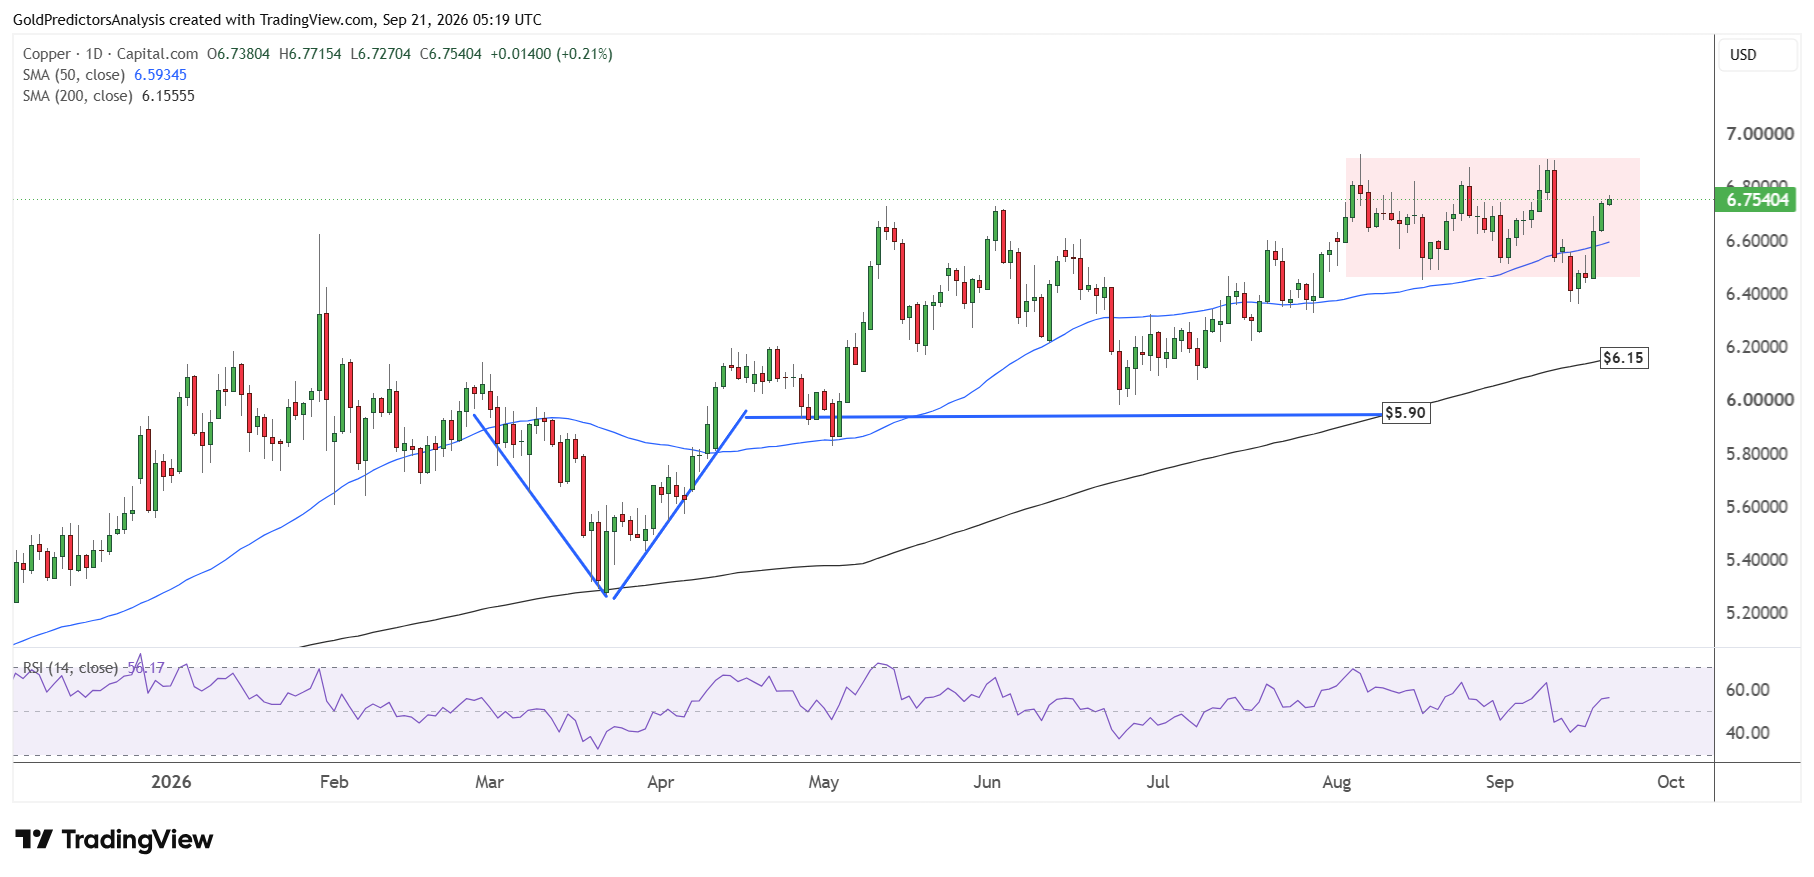
The daily chart for copper prices shows that copper formed a bottom on September 15 at $6.36 and triggered a strong rally. The price has already closed above the 50-day SMA and is looking to move higher.
The recent recovery from the bottom indicates that the price may break the key resistance at $6.90. A break above $6.90 will open the way for strong rally towards the $7.50 area in the long term.
On the other hand, immediate support remains at $6.60 and $6.30. A break below $6.30 will open the way for a drop towards the 200-day SMA at $6.15. The RSI remains above the midline, which suggests positive price action in the copper market.
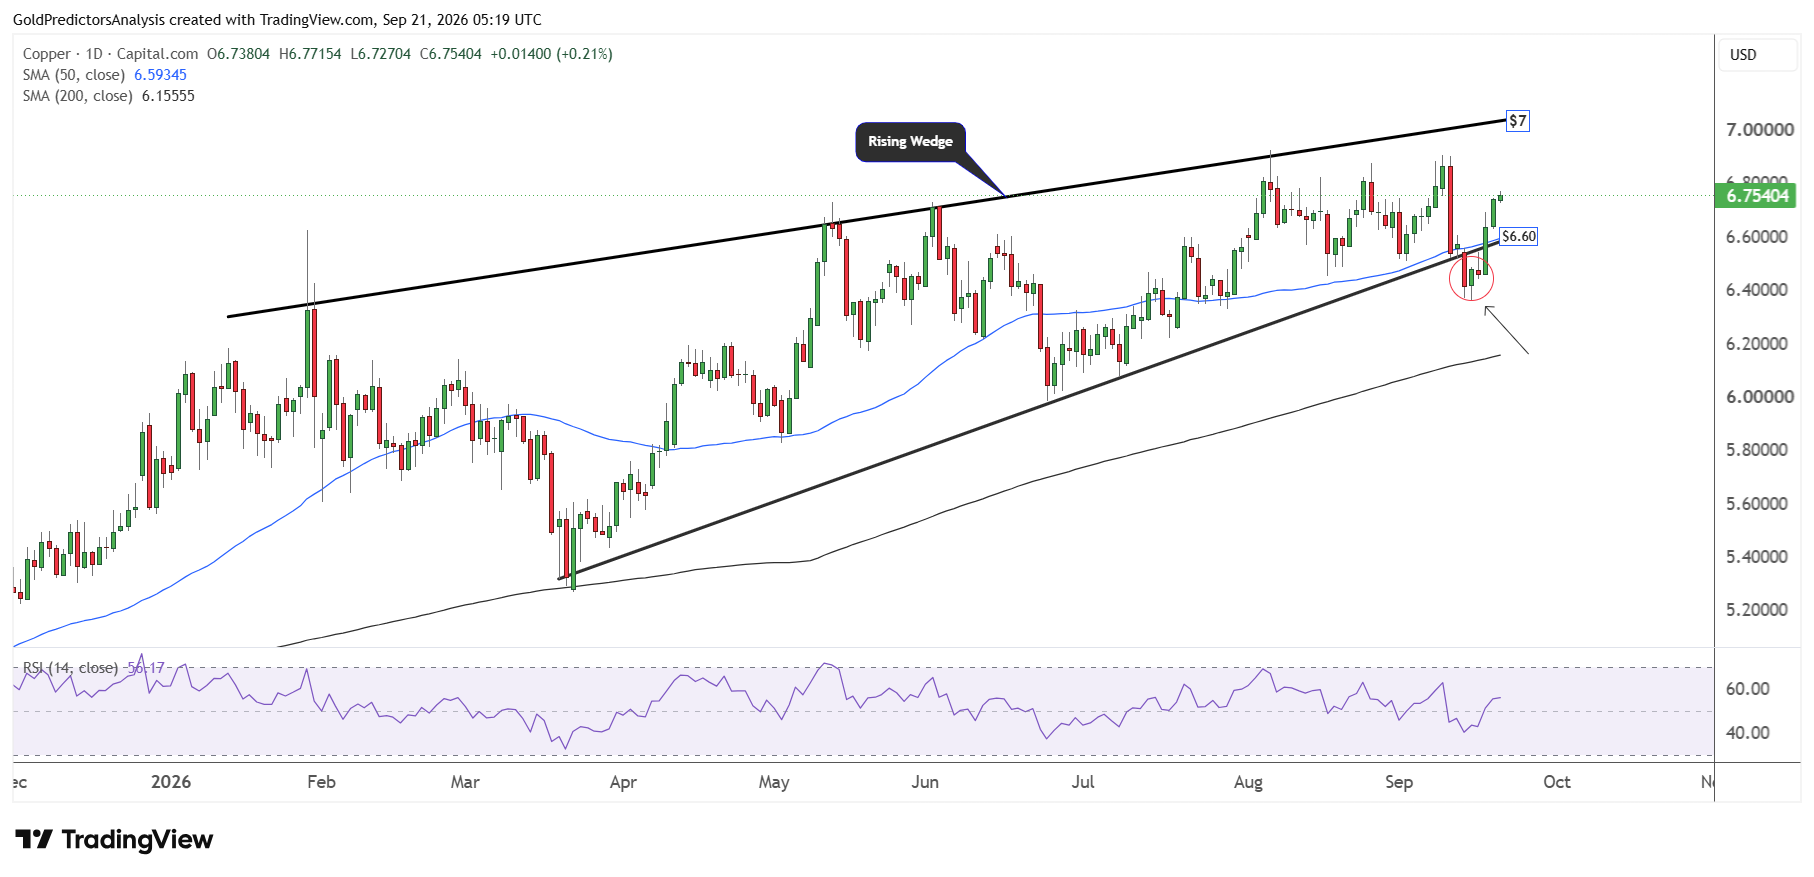
Another daily chart for copper prices shows that the recovery in copper last week has pushed prices back into the rising wedge pattern. The recent recovery above the 50-day SMA suggests that the price may break above $6.90 and move toward $7.03. This is defined by the resistance of the rising wedge.
A confirmed break above $7.10 is required to break this rising wedge and open the way for a strong rally towards the $7.50 area. On the other hand, a break below $6.60 will suggest further downside in the short term.
Copper Ratios Show a Recovery Against Precious Metals
Copper has gained strength against both gold (XAU) and silver (XAG). This strength is seen in the ratios between copper, gold and silver. The chart below shows that the copper to silver ratio produced a rebound from 0.064 after marking a low in January 2026.
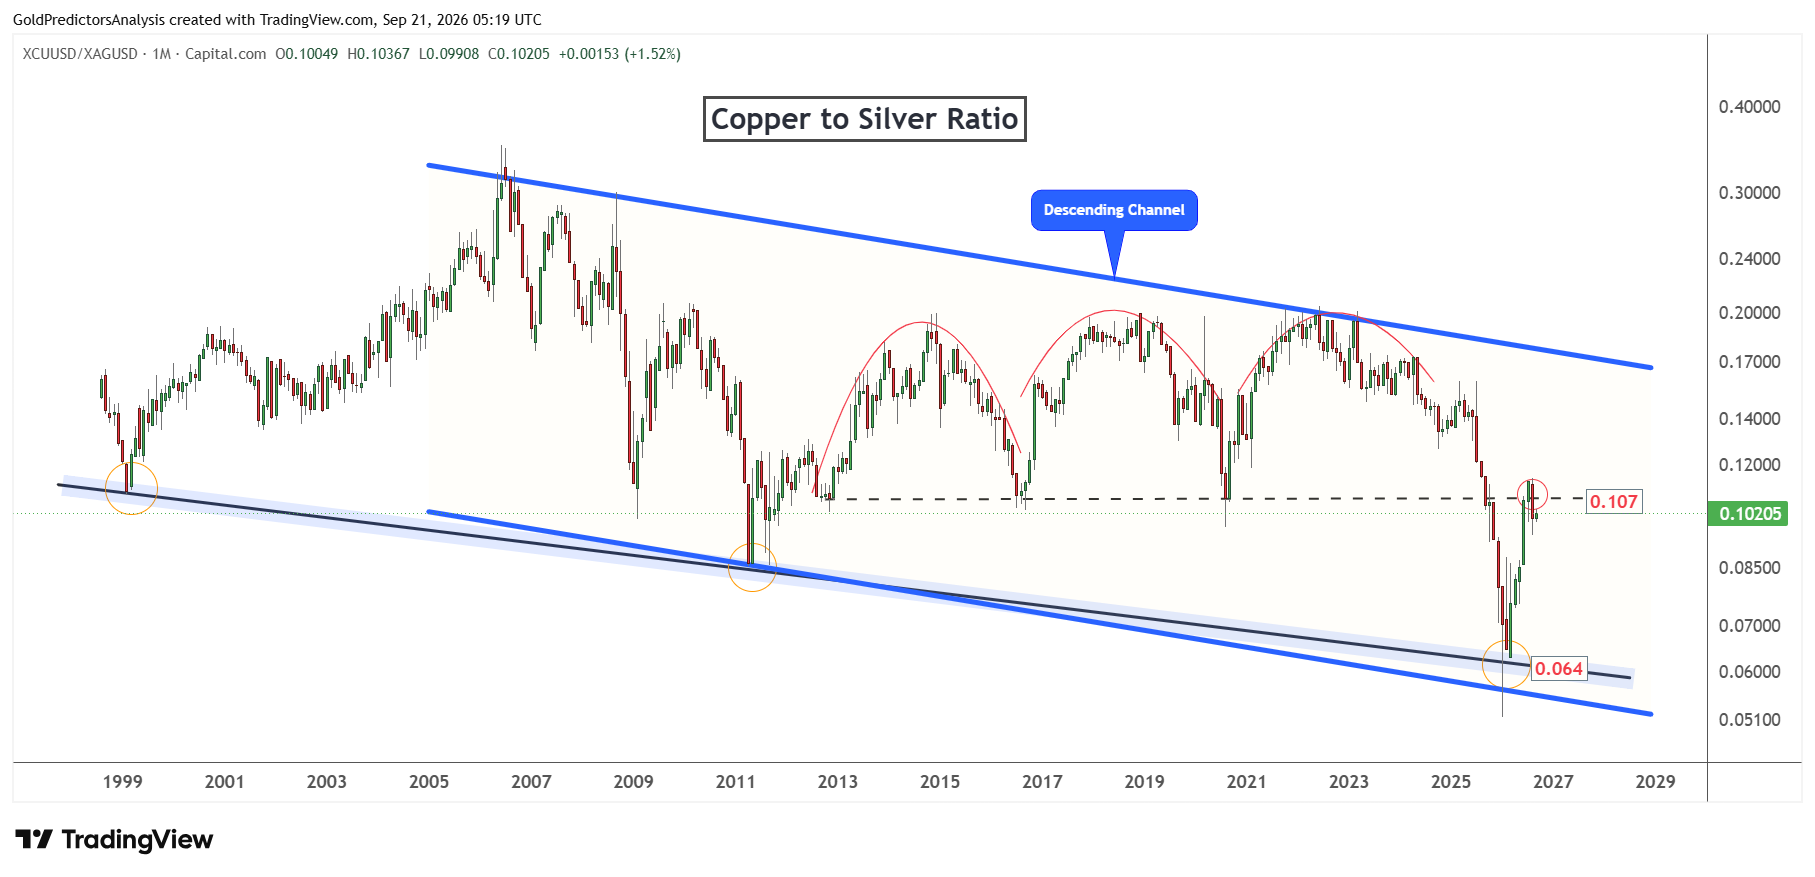
This rebound pushed the ratio toward the key resistance at 0.107. The ratio dropped in August but strengthened again in September. This indicates that copper is strengthening in short term compared with silver.
A similar trend is observed in the copper to gold ratio, which shows that the ratio has produced a rebound. The ratio is pushing higher in September, which shows strength in the copper market compared with the price of gold. This rebound suggests that copper is attracting better interest than gold. It may also point to better confidence in industrial demand. But the ratio remains within the declining channel.
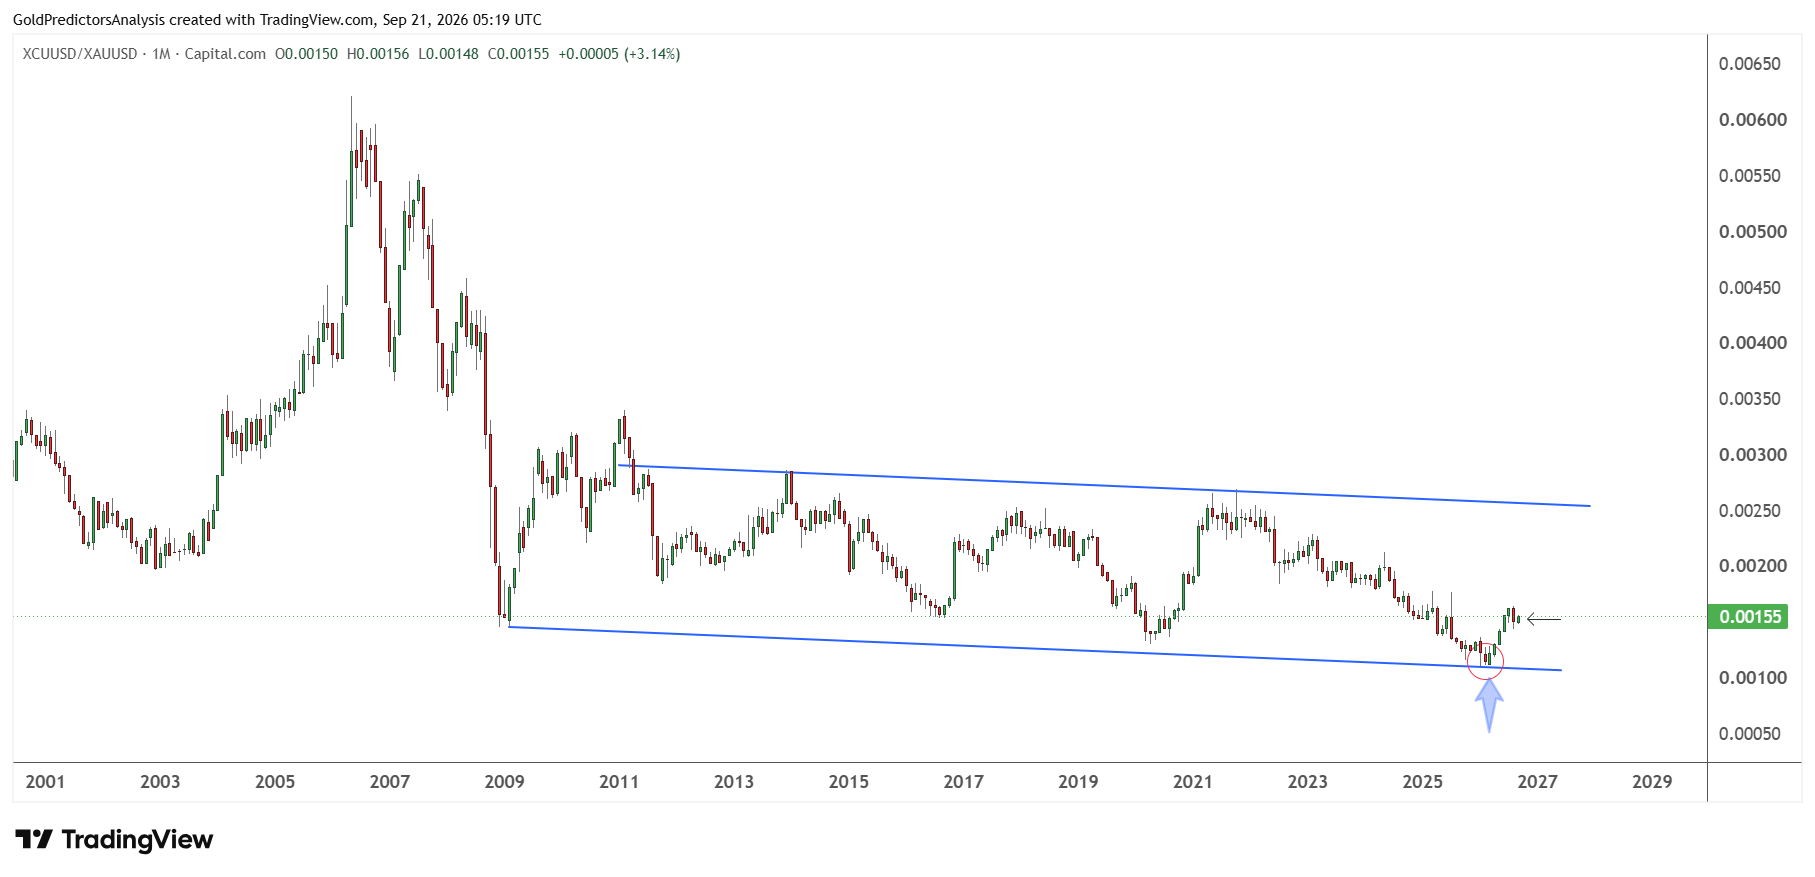
If these ratios continue to rally higher in the next few months, the chance of copper continuing the rally despite overbought conditions will be higher.
Risks to the Copper Price Outlook
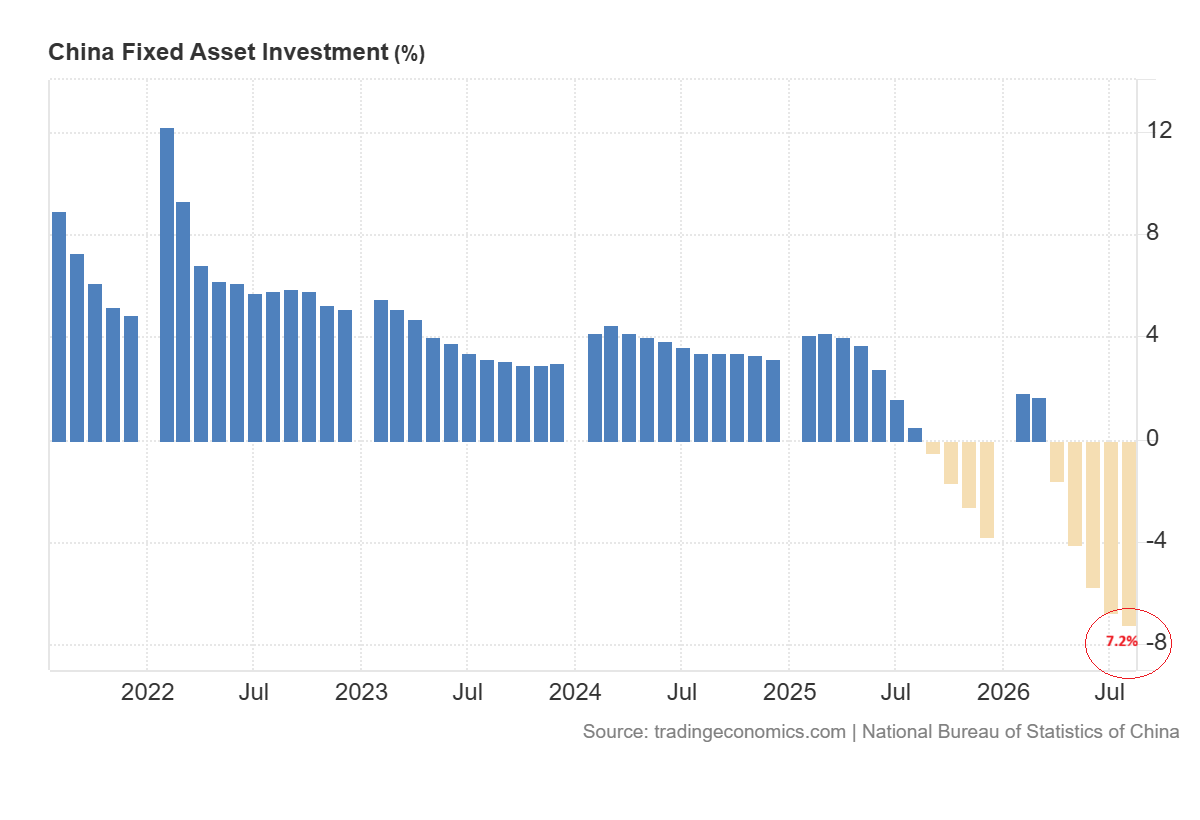
The biggest risk for copper comes from the weak construction demand in China. The property sector in China is still under pressure. Fixed-asset investment fell 7.2%, which points to softer activity in copper consuming sectors.
Refined inventories are also rising. High prices may force manufacturers to delay orders or use cheaper materials. Copper has gained more than 45% over the past year which may encourage traders to take profits. A break below $6 would weaken the rally and increase risk of deeper corrections.
But the tight supply creates the opposite risk. The production losses in Chile could reduce the availability of copper concentrate. Stronger buying from China could add more pressure to the market. The power grid expansion in China should also lift demand for cables and electrical equipment. The refined market may tighten if demand remains strong. A break above $6.90 would improve the bullish outlook. A break above $7.10 could open the way toward $7.50.
Bottom Line
Copper remains supported by tighter physical market in China. Falling inventories and higher spot premiums show that buyers want immediate supply. The mine disruption also limits the availability of copper concentrate. But weaker import demand gives mixed signals. This may slow the rally in copper as the price approaches the record high.
The technical outlook for copper remains bullish. The copper price trades above the 50-day SMA while the RSI remains above the midline. The copper to gold and copper to silver ratios also suggest that the relative strength among these metals is improving. A break above $6.90 would support the move toward $7.10. A confirmed break above $7.10 could then open the way to $7.50.
The main risks come from the weak property sector in China, rising refined inventories and profit-taking after the strong annual gain. A break below $6.60 would weaken the outlook in the short term. A break below $6.30 could push the copper price to the 200-day SMA at $6.15. In my view, copper keeps the positive bias while it holds above these support levels. But the next strong rally needs a clear break above $7.10.
Read more: Copper Leads as Lithium Weakens