


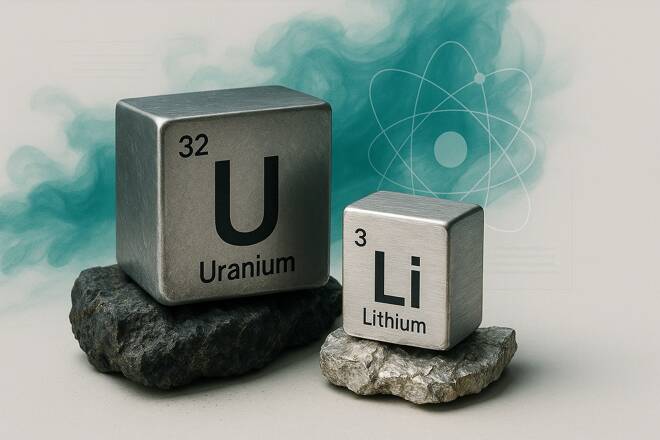
Copper (XCU), uranium and lithium present a weak short term outlook despite strong long term demand from electrification, energy storage and nuclear power. Copper is holding above the key support level but may correct before the next rally. Uranium and lithium remain under heavier selling pressure after breaking important technical levels. This article examines the main demand drivers, supply risks and price levels that may shape the next move in these markets.
China’s Energy Storage Growth Supports Copper and Lithium Demand
The energy metals outlook still depends on the global transition to energy security and electrification. The development in these sectors supports the positive outlook for copper, uranium and lithium. But there are supply and policy risks in each market. Copper depends heavily on industrial activities. Uranium demand depends on the nuclear expansion. Lithium is sensitive to the battery demand and changes in production.
China’s energy storage capacity has grown rapidly and reached close to 155 gigawatts. China expects this capacity to increase to 300 gigawatts by 2030. This surge suggests the robust investments in battery storage, renewable power, data centers and electricity networks. The increased investment in these sectors indicates that the demand for copper and lithium will remain strong in the long term. Copper is needed for grid expansion and power transmission and lithium is an essential component of large battery systems.
China will introduce the consumption tax on some types of lithium-ion battery products, which have been exempt so far. This policy may drive up the cost of batteries for producers and exporters. The policy can result in less production by less competitive producers. This would reduce excessive competition and provide better balance in the lithium market.
Lithium supply also faces uncertainty outside China. The sole lithium sulphate processor in Zimbabwe is unable to process the material of other miners due to lack of spare capacity. The country still plans to ban exports of unprocessed lithium concentrate from January 2027. Several new processing plants may not be in place before the deadline. This may lead to supply disruptions in the region and help prop up lithium prices. But it may be less impactful if production from other countries strengthens.
Copper Price Forecast
Every new Copper analysis as it publishes, today's technical signal and key levels, live price — on one page.
See all Copper forecastsNuclear Expansion Strengthens the Long-Term Uranium Outlook
The macro environment of copper is mixed. Demand for industrial use continues to constrain sales at higher prices with tight global supply. The investment in the power grid and in digital technologies supports the long term outlook. But the copper price may remain volatile if Chinese economic growth slows further. So the market needs strong physical demand to ensure another sustainable rally.
The uranium market is growing as nuclear energy is growing. Rosatom has 18 new nuclear units in various stages of development in Russia. These projects have the potential to increase demand for fuel in the future and thus contribute to the long term requirements for uranium. But the new reactors take years to complete. This activity is more of an indicator of the structural demand than of the immediate demand.
Copper Holds Key Support but Faces a Short-Term Correction
Copper prices are consolidating at an elevated level above $6, as seen in the monthly chart below. The price formed a double bottom pattern in 2016 and 2020 and broke above $3.35. This breakout pushed the price higher within the ascending channel pattern and marked a high at $6.70.
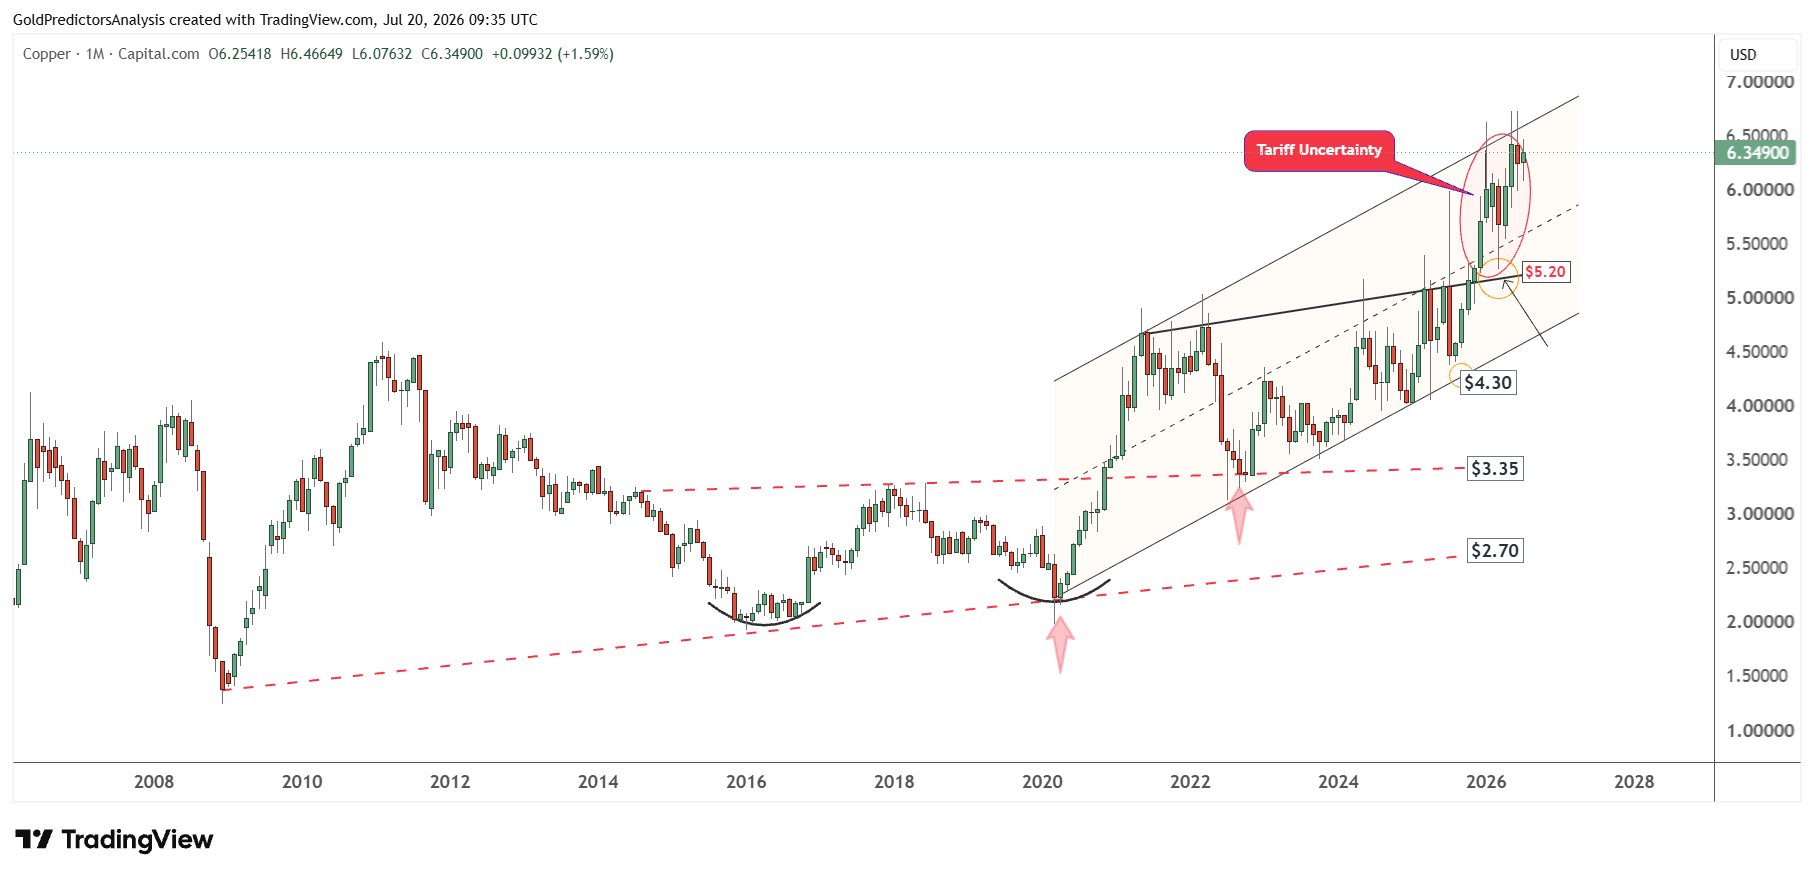
The strong resistance in copper prices indicates that prices may undergo a correction before the next surge. The immediate long-term support remains at $5.20. As long as this support level holds, the next move in copper will likely be higher toward $7.50.
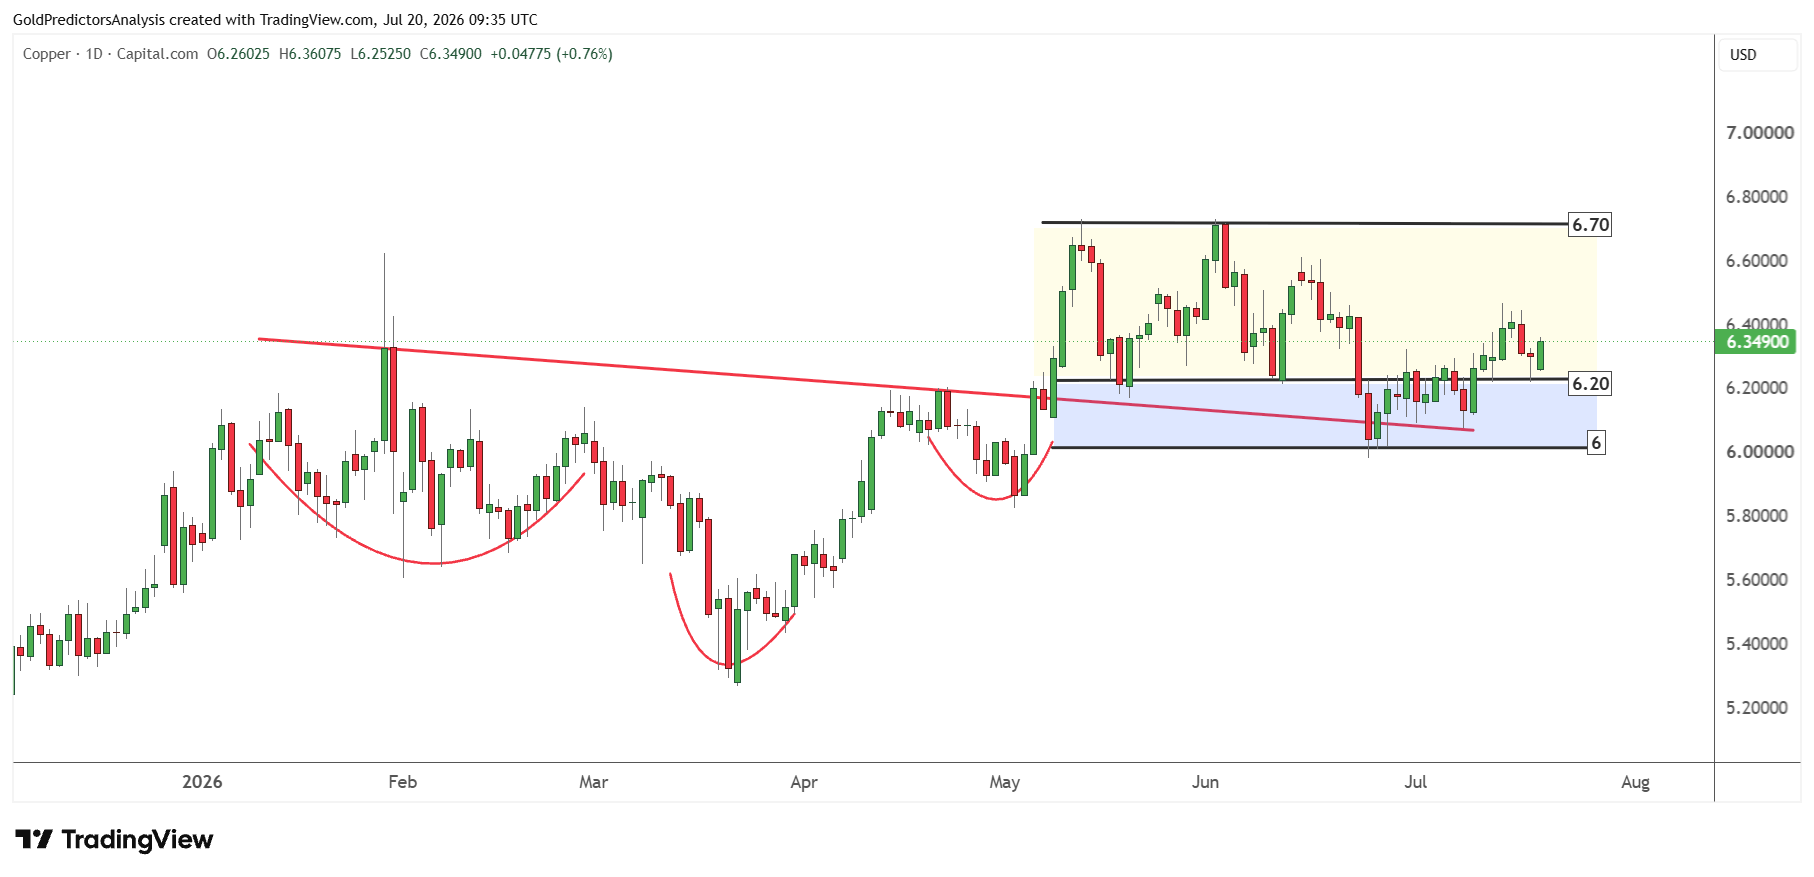
Despite the strong bullish structure, copper prices are showing significant short term uncertainty as the price is consolidating above the $6.20 area. Overall, the $6 to $6.20 area remains the short term support. A break above $6.45 will be a positive sign that could push the price toward $6.70.
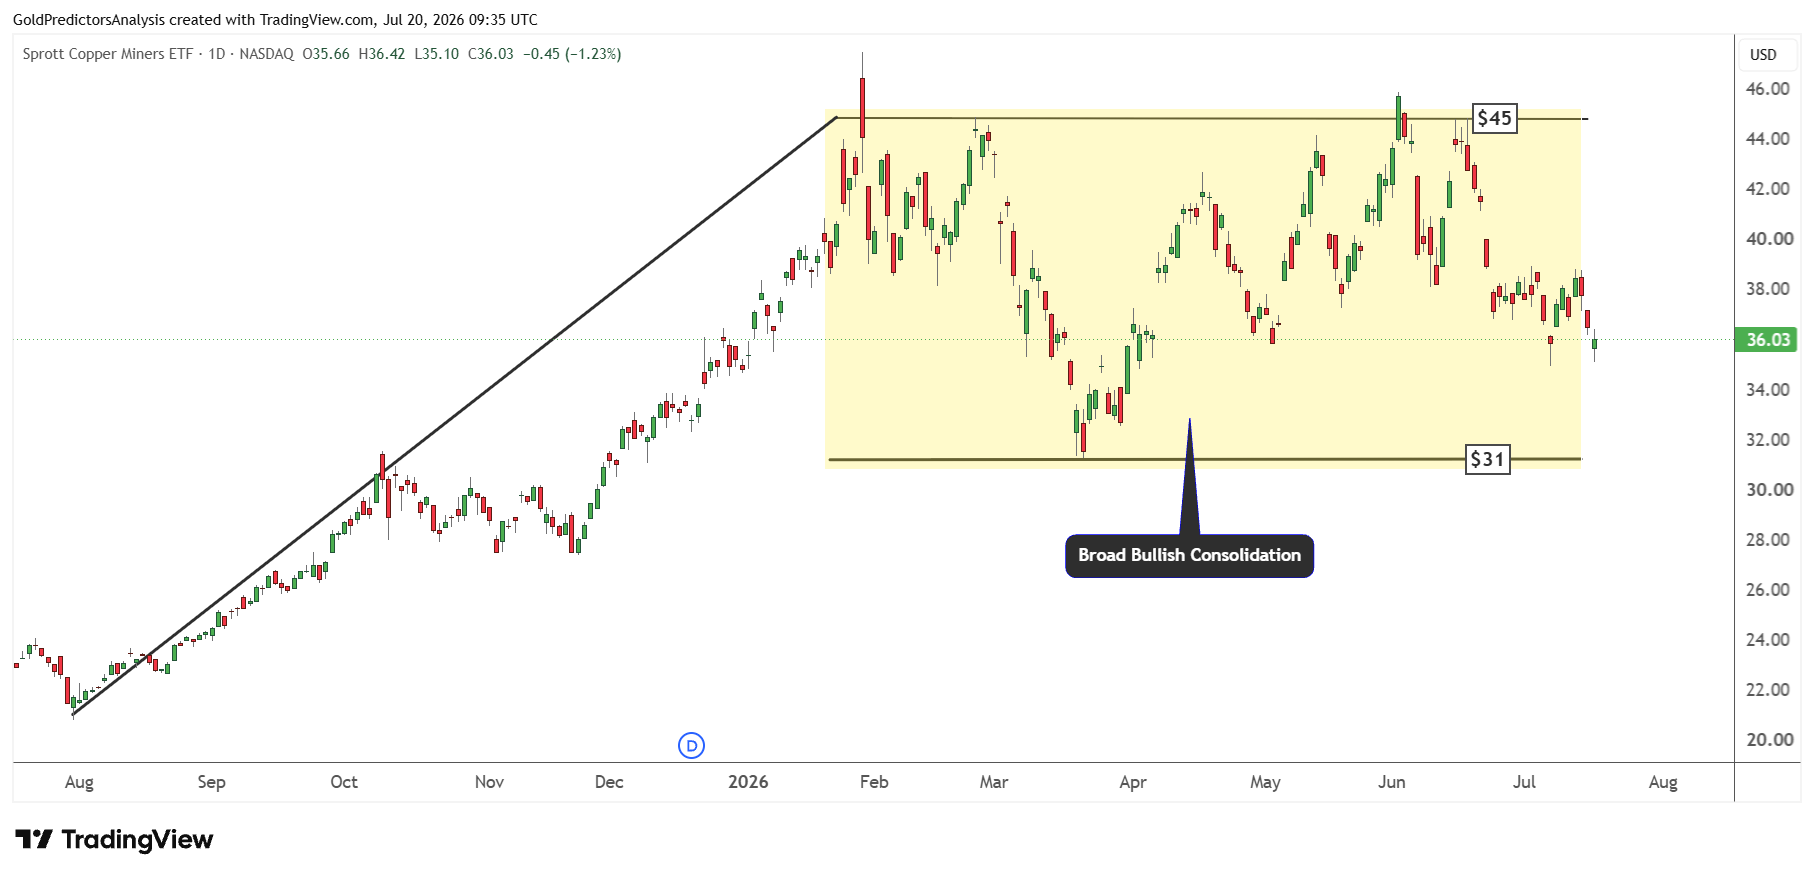
The Sprott Copper Miners ETF is also showing strong consolidation between $31 and $45. The short term direction looks negative and points toward the $31 region. The ETF must hold the $31 level to rally to the $45 level. But a break below $31 will likely push the price toward $25.
Uranium Breakdown Points to Further Downside
The uranium market remains under extremely bearish pressure in the short term as seen in the chart below. The Global X Uranium ETF has broken the support of the triangle pattern at $41 and declined to mark a low at $37.73. The immediate support for the ETF remains at $35.80. A break below this level will lead to further downside toward $33.
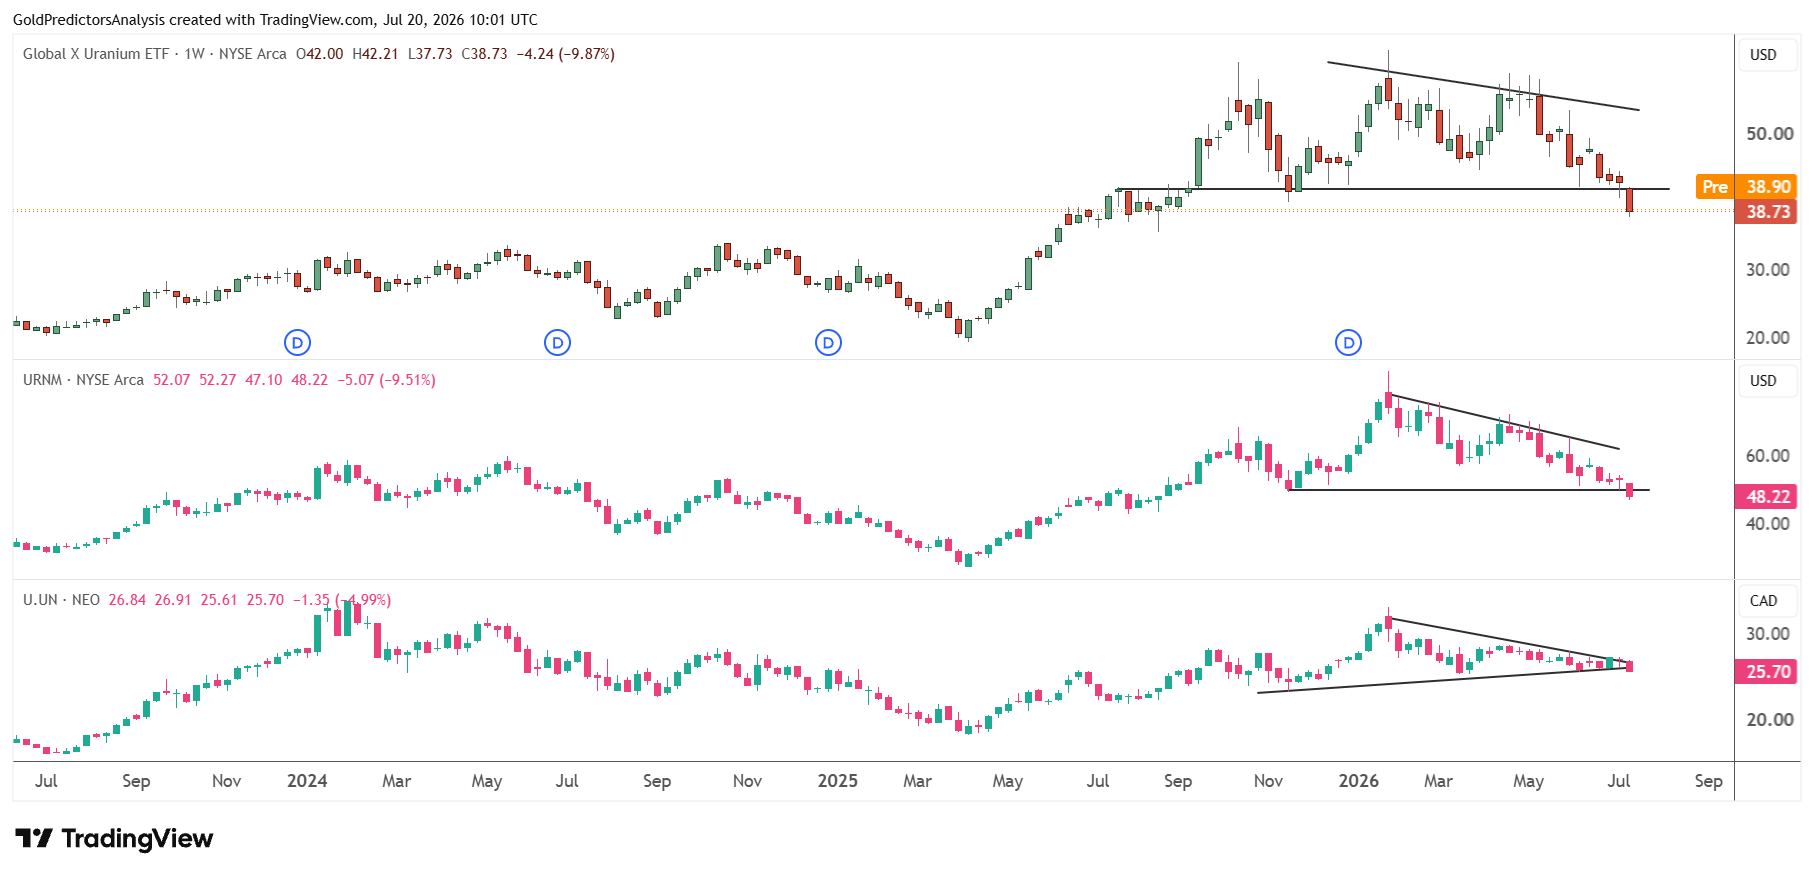
The Sprott Uranium Miners ETF has also broken the triangle pattern at $49.50 and looks set to move further downward toward the $44 region. The Sprott Physical Uranium Trust has also attempted to break the triangle from its apex at $26. The immediate support for this ETF will likely be $23.50. A break below this level will push the ETF toward $23.50.
The chart below also confirms that the uranium prices remain under extremely bearish pressure. The uranium equity basket has reached lower boundary of the descending channel pattern at 5,200. But the price pushed slightly below 5,200 to mark a low around 5,000.
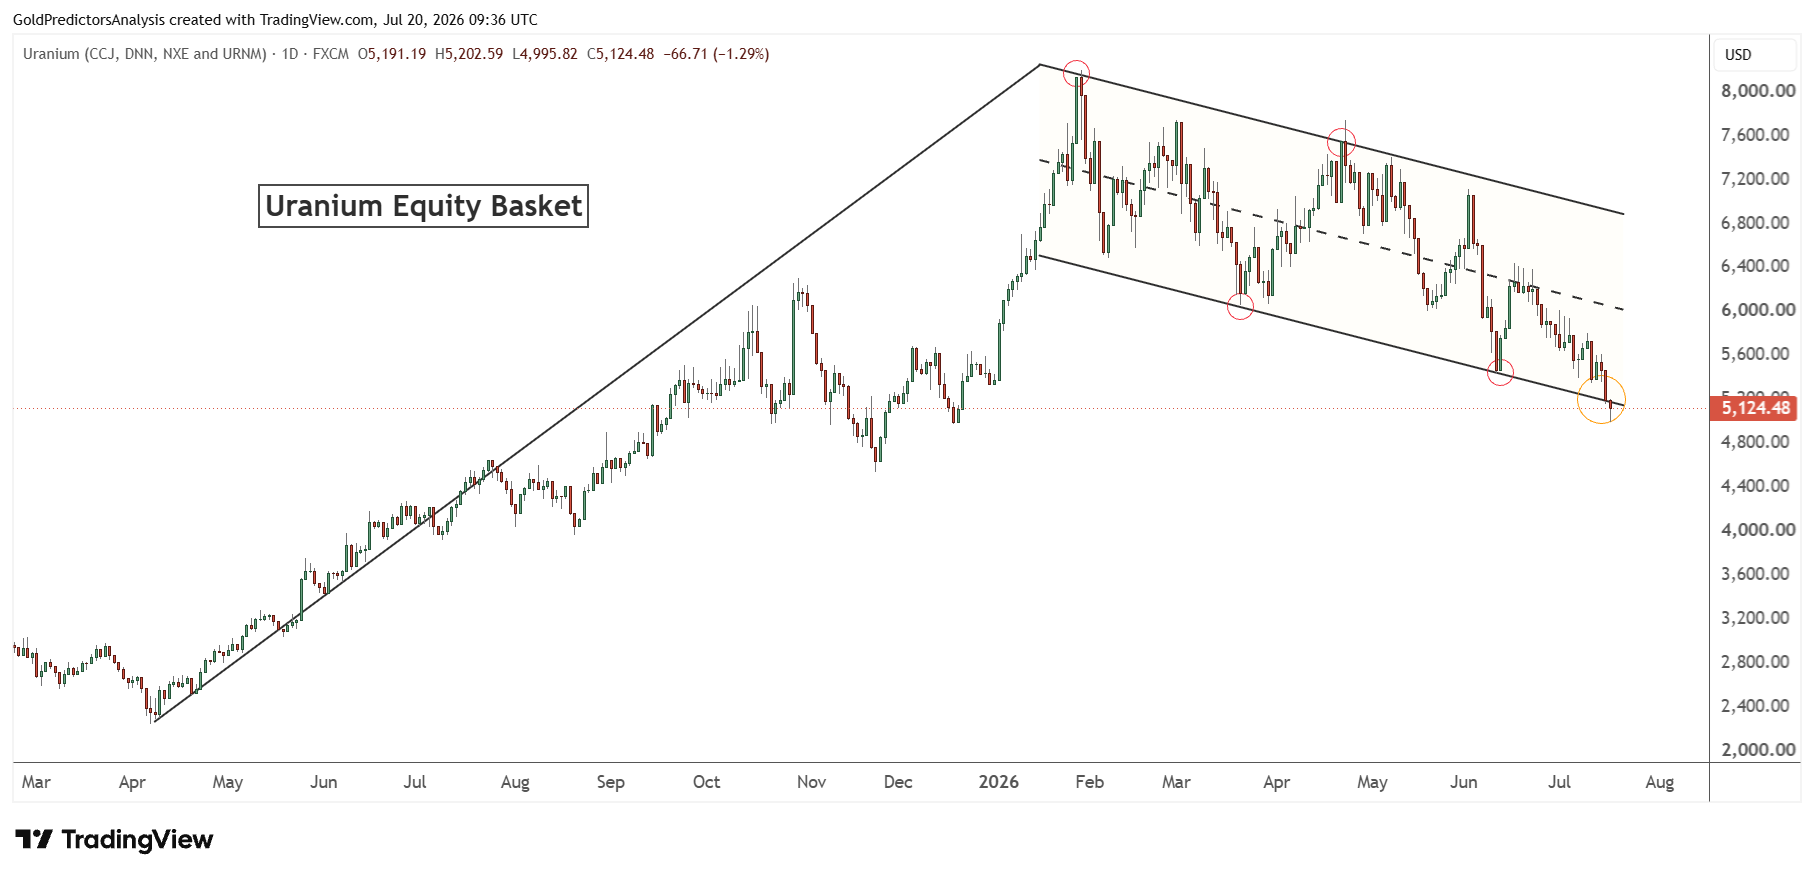
A break below 5,000 will push the uranium equities further downward toward the 4,500 level. But a strong recovery from this level is possible and may encounter immediate resistance around 6,000.
A break above 6,000 will likely push the uranium equities basket toward 6,500. The strong bearish pressure in the uranium is also evident on the long term chart which shows that uranium prices have been continuously dropping since May 2026.
The continuous decline indicates strong bearish pressure in the short term. If uranium prices continue to drop from current levels, they may reach the long term support at 4,200. Once uranium prices reach 4,200, they will likely form a long term bottom and rally higher again.
Lithium Looks Set to Test Lower Support
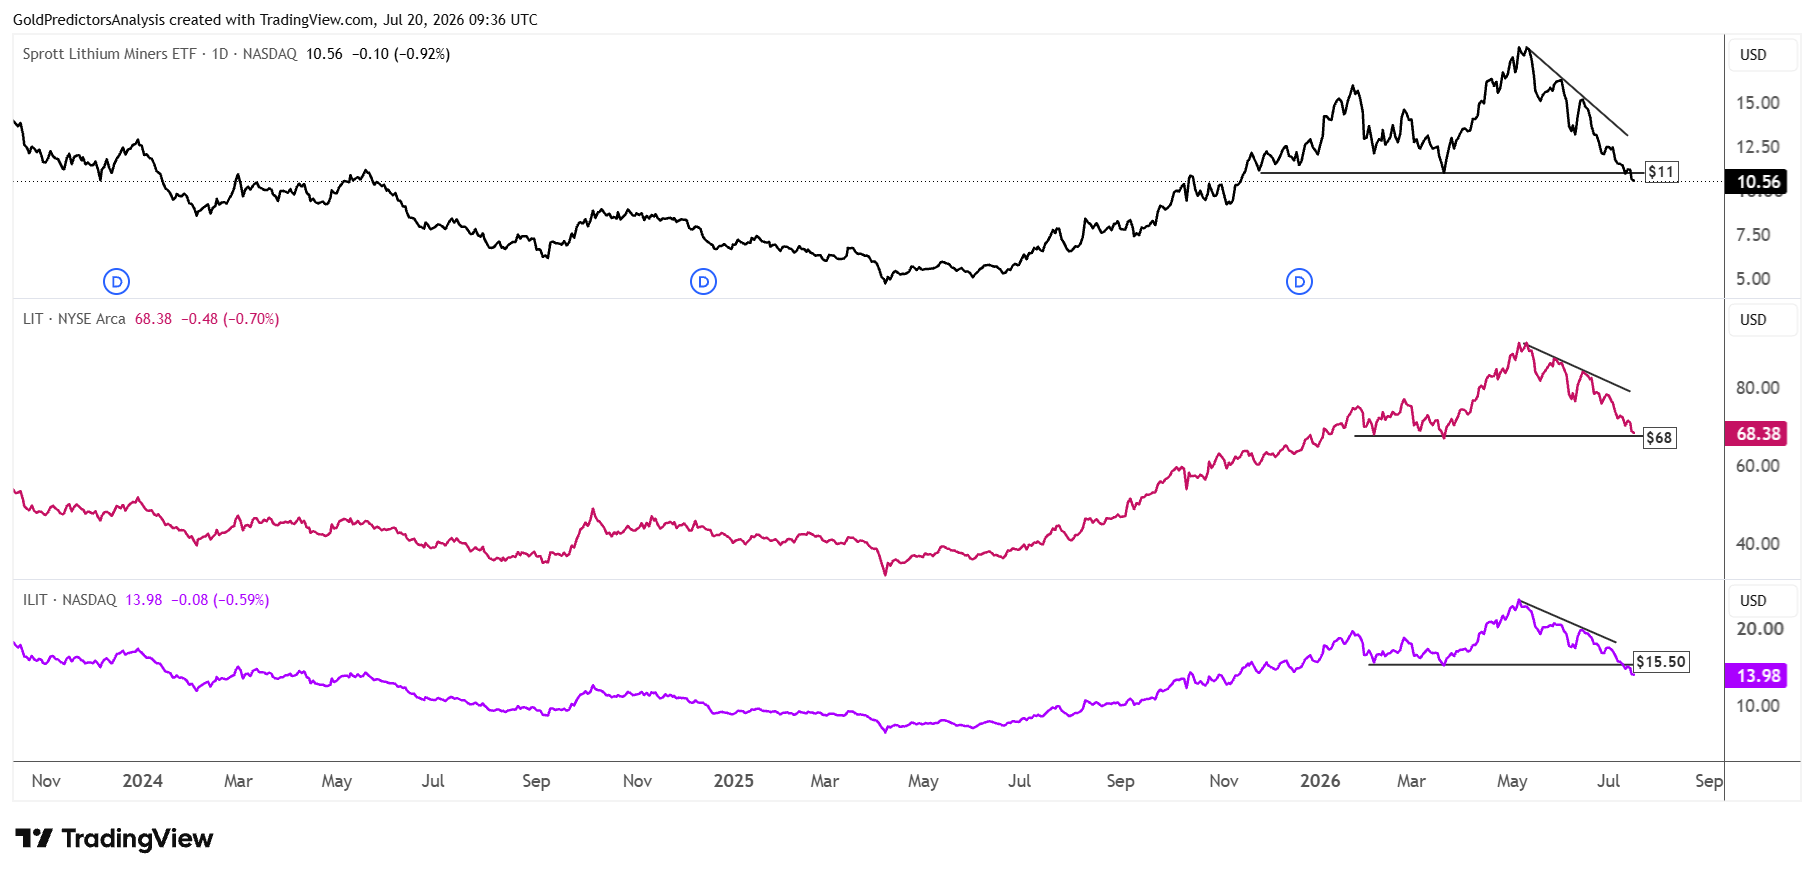
Lithium prices also show strong bearish pressure as the Sprott Lithium Miners ETF has broken below $11. This was the support of the triangle pattern as seen in the chart below.
The Global X Lithium & Battery Tech ETF is approaching the key support level of $68 which is the support of the triangle pattern. This ETF is looking for the next direction.
The iShares Lithium Miners and Producers ETF has broken the $15.50 support. This breakout indicates a move to the $13 area.
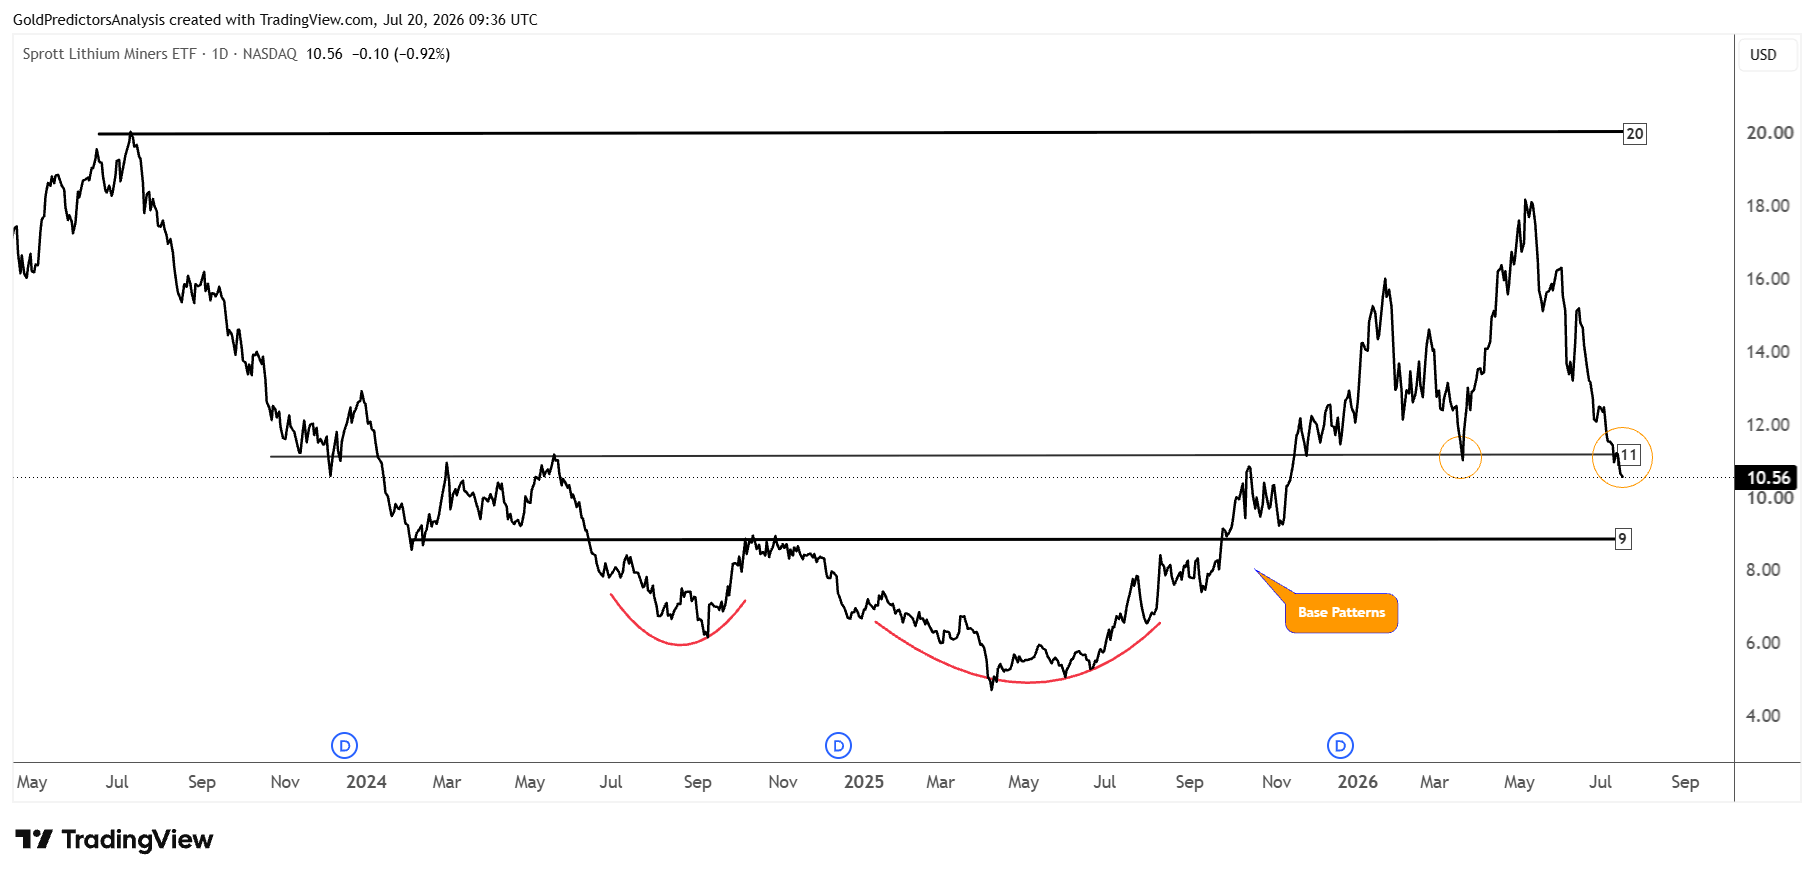
The daily chart for the Sprott Lithium Miners ETF clearly shows that the ETF price remains under bearish pressure. A break below the $11 region indicates that the ETF will drop to the $9 level.
Critical Materials Remain Under Bearish Pressure
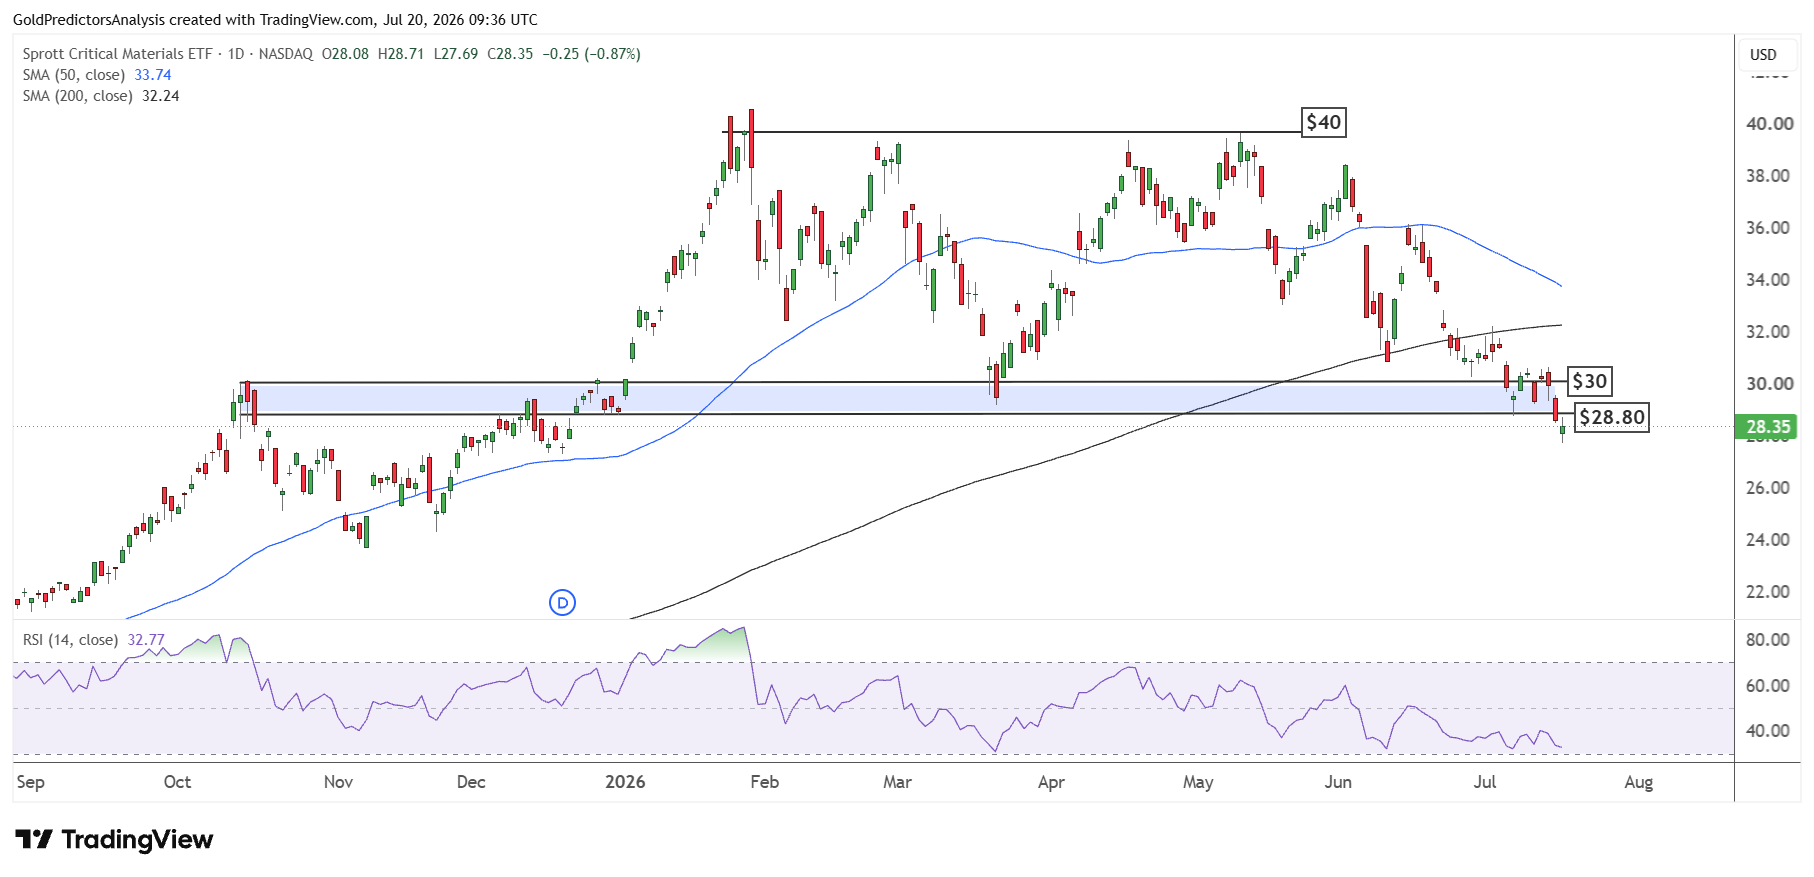
The Sprott Critical Materials ETF has broken the $28.80 support and now looks set for further downside. The 50-day SMA still remains above the 200-day SMA. But the 50-day SMA is trending lower which indicates that if the price does not recover above the $32 area in the short term, the trend may shift to negative.
But the RSI has also shown muted price action since the last week of June. This indicates that the prices remain under pressure. A strong recovery above $31 is required to ease the immediate pressure on the Sprott Critical Materials ETF.
Bottom Line
Copper, uranium and lithium prices benefit from the long term trend of electrification, energy storage and nuclear power. But the short term prospects are still weak. Copper has the potential to correct before the next rally, while uranium and lithium remain under strong selling pressure. The critical materials sectors also need a clear recovery before the trend improves. Copper prices must hold the $6 to maintain the short term bullish structure. But the uranium and lithium markets look to drop further before turning higher.
Read more: China Slowdown Could Drive Pullback Before Next Rally in Copper