This will be a long and volatile week for oil and equity markets. In short, talks are progressing, but Iran is keeping a tight leash on things by closing the Straight of Hormuz when the Memorandum of Understanding (MOU) is breached… by Israel. Flows are stop/start, and therefore I expect price to settle into a relatively quiet range before volatile moves towards the back of the week. More in the trade section below.
This Is Just the Beginning
US-Iran talks opened in Switzerland on Sunday with Vance present and Iran’s delegation (Ghalibaf, Araghchi) alongside Pakistani and Qatari mediators, but the session wobbled almost immediately: Iran reportedly threatened to halt talks over Trump’s threat to strike Iran over Hezbollah’s actions in Lebanon, calling it a violation of the MOU, though Al Hadath says the delegation never actually left, and was working a joint statement. It is also noted that the Iranians ‘never took Trumps threats seriously’.
The official mediator readout was upbeat – constructive first session, technical talks continuing all week, a de-confliction cell over Lebanon, and a roadmap to a final deal within 60 days. Trump’s is maintaining his maximalist rhetoric throughout threats to resume bombing and “take over” Hormuz, a contradictory toll position (none, unless imposed by the US), and a public warning that Iran must rein in its Lebanon proxies or get hit “only harder.” This is pretty rich considering The US can not rein in Israel, who are hell-bent on destabilising the MOU agreement. If there is peace, Netanyahu is out. It’s that binary.
Iran, for its part, claimed wins (oil and petrochem waivers, blockade lifted, some frozen assets released) while setting a hard condition – Hormuz stays shut and final-deal talks won’t proceed unless the Lebanon ceasefire holds and oil waivers are issued. How likely is this to happen? I put it at a 5% probability. I am certain that everyone wants the headline of ‘‘Israel and Hamas strike peace agreement in the face of US/Iranian talks’’. Unfortunately, history will dictate that the throughput will be otherwise and the two sides will not give any ground.
The gap between rhetoric and physical reality is the part that matters. Iran declared Hormuz closed Saturday over Israeli strikes in Lebanon, yet traffic kept flowing, Kharg Island loading restarted after a six-week halt, and India-linked supertankers reappeared in the Gulf of Oman – oil is resuming even as Iran threatens closure.
The whole structure hangs on Lebanon, and Lebanon is cracking. The Israeli army chief calls the ceasefire fragile with forces combat-ready, and an Israeli convoy pushed into Quneitra in southern Syria. One source caution – the “Iran walked out” and “Hormuz closed” lines are Fars/Iranian state framing, so treat them as leverage rather than fact; the reliable read is brinkmanship around a signed-but-unbuilt deal with Lebanon as the detonator.
Brent Oil Price Forecast
Every new Brent Oil analysis as it publishes, today's technical signal and key levels, live price — on one page.
See all Brent Oil forecastsAn Eye on the Flows
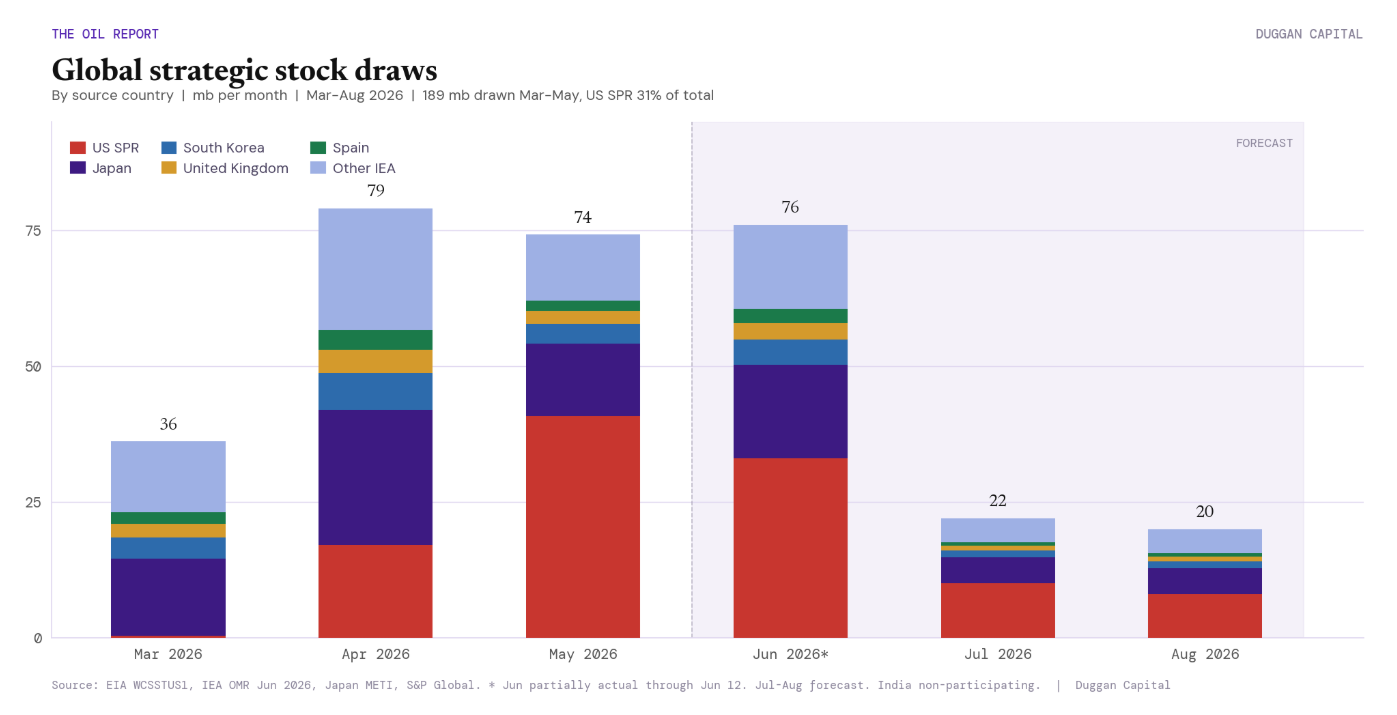
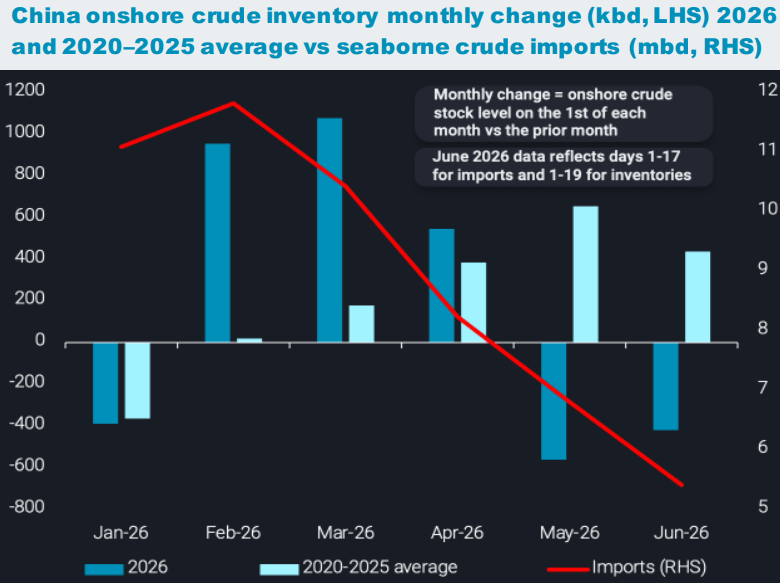
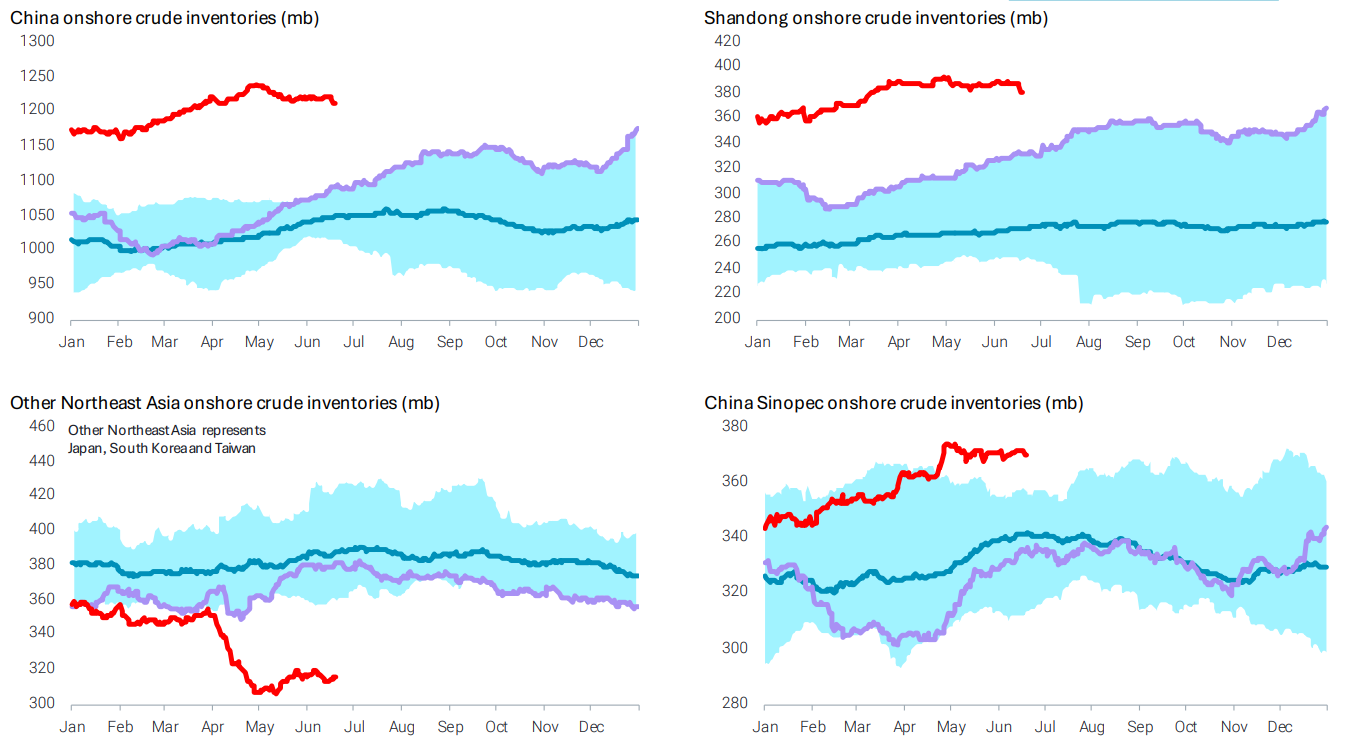
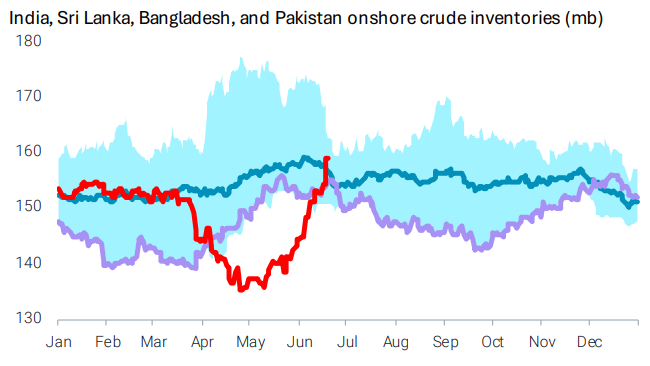
Kuwait is ramping production back up to 2mb/d. Khrag Island is loading again after a 6 week hault and Vance claims 16mb cleared The SOH in a single day. We have increased barrels coming into market with or without Hormuz flows. This is the persistent OECD strategic releases, (76mb in June) is a large amount of oil to market. About 2.5mb/d. Add this to the tracked flows, and we have about 4.5mb/d flowing – strategic + Hormuz flows. Some mental maths now puts the loss to global flows at10mb. Still 10% of global pre war flows.
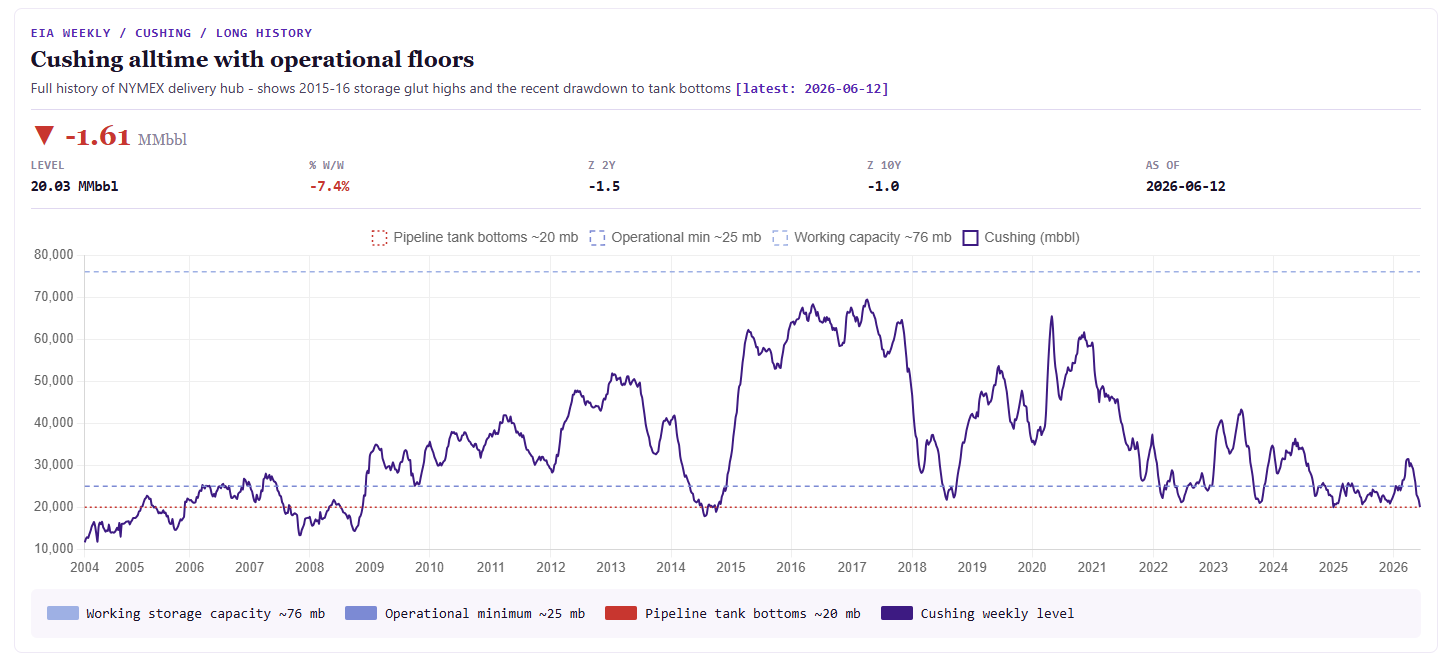
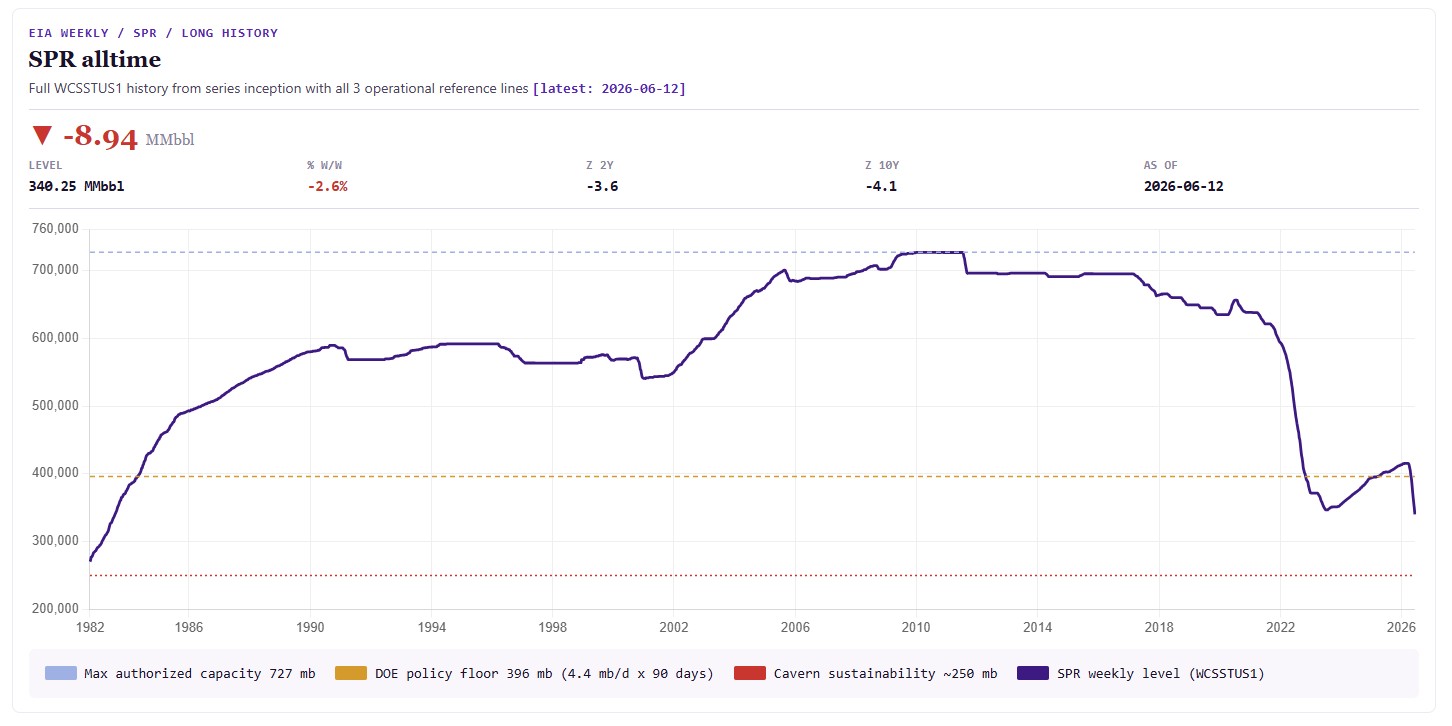
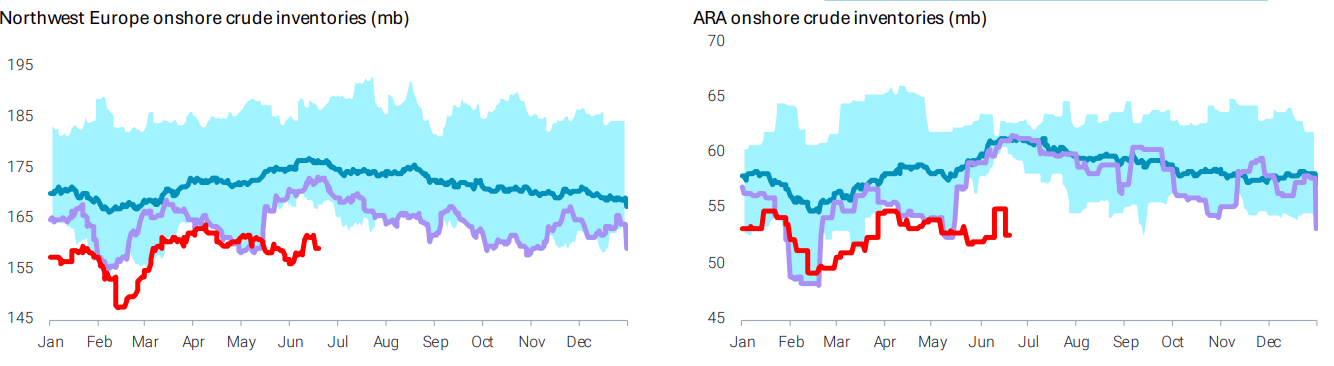
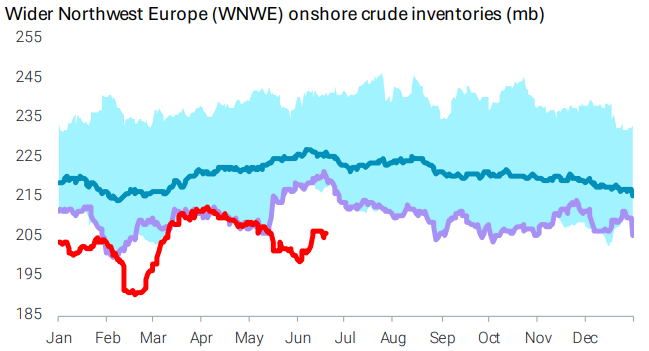
As covered in my EIA report last week, we are now at Cushing tank bottoms. This puts the US system firmly on watch for export bans, and brings into focus the 418mb left circulating through the wider national US system. I highly suggest having a read of that full report, where we can see that we are below minimum guidance levels set out in 1979.
Well Supplied Will Flip
So there continues to be this wall of oil from strategic reserves as covered in ‘‘Don’t fight the SPR’’ May 31st. While this, coupled with increased transits, provides the headwind/downside pressure on prices, it will leave the cupboards bare once we get to the other side.
Coordinated draws are masking the physical gap and exhausting the buffer that’s holding price down.
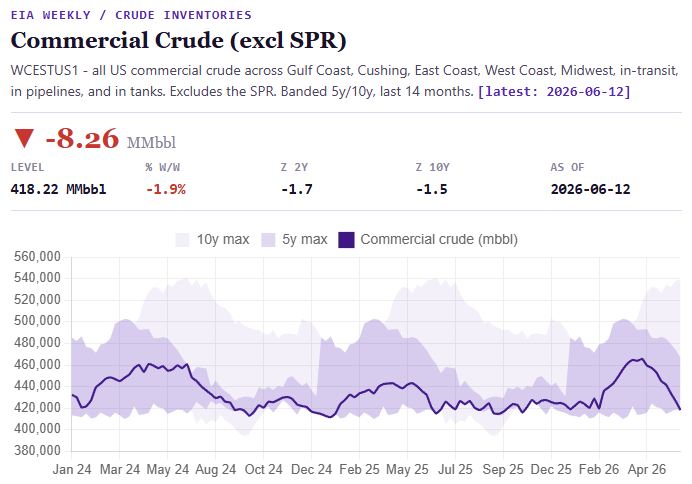
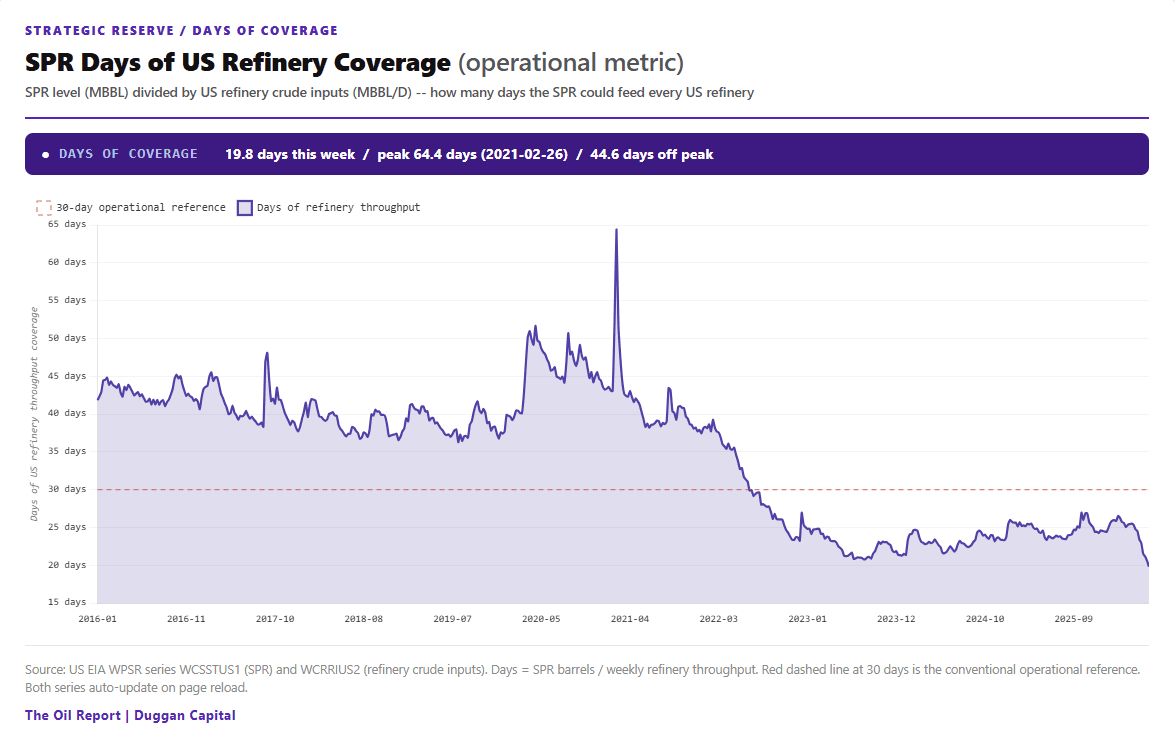
Running down OECD supplies another 4 weeks will put us at critical levels. No more talk, just hard realities. Cushing might drop below 20mb as in 08/09. Lets see in my Wednesday report. If it does, some hard decisions are going to have to be made about who gets their oil from where. Nations will be either a net exporter or a price taker.
This supply holding price down is borrowed. I will aim to cover the return schedule in later reports, as it will be extremely helpful in the 12 to 24 months of trading ahead.
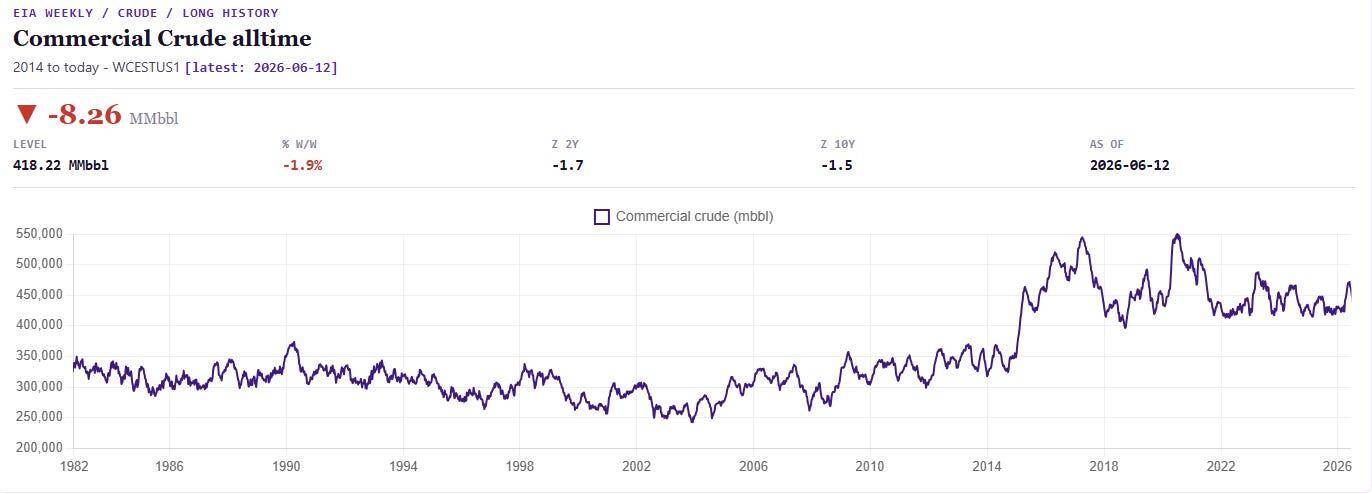
Here is what the US SPR looks like right now. Note the levels for the DOE mandate line and the critical salt cavern operability line.
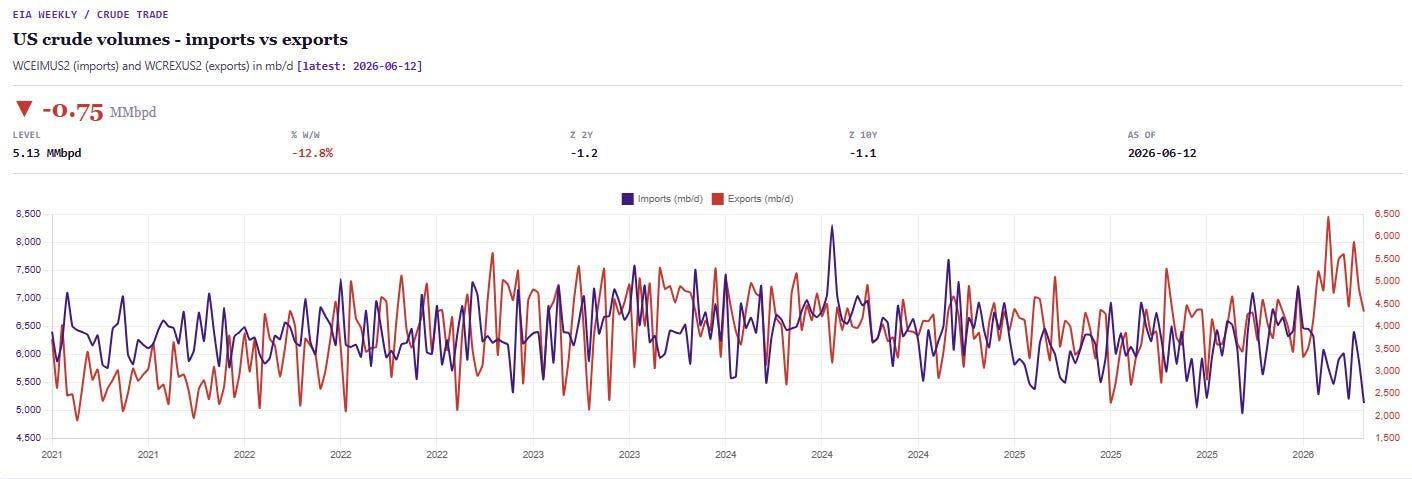
We are already seeing distress in this data via the imports v exports chart. With exports coming off the top, I see no universe where these exports can reaccelerate. Imports also down as there is just no supply out there to get. Deal or no deal, export bans are coming!



The Net Net
Things are bad. This is exactly where Iran want negotiations. And I salute their tactics and gamesmanship. They are exerting maximum leverage. I feel like I’m watching an episode of late night poker where we have one card left to see. The US has been trying to make a busted straight the whole hand and Iran have been playing pocket aces.
I firmly believe that despite this Swiss bluster, there are men trying to move history where it just won’t go. The real negotiation is between The IDF and Hamas. Lebanon is the pitch. This is not a negotiation that any of us would take on. As long as peace in Lebanon is a dependency, the deal will not be done. So Iran’s sticking point is Israel’s survival button!
All in all, the negotiation dependency is set on the impossible. And say we break the impossible, well how long do we think that will last? My outlook is dim on negotiations and therefore is dire for OECD stock levels, SPR levels and the ability for Trump to put the toothpaste back in the tube.
Commitment Of Traders Report
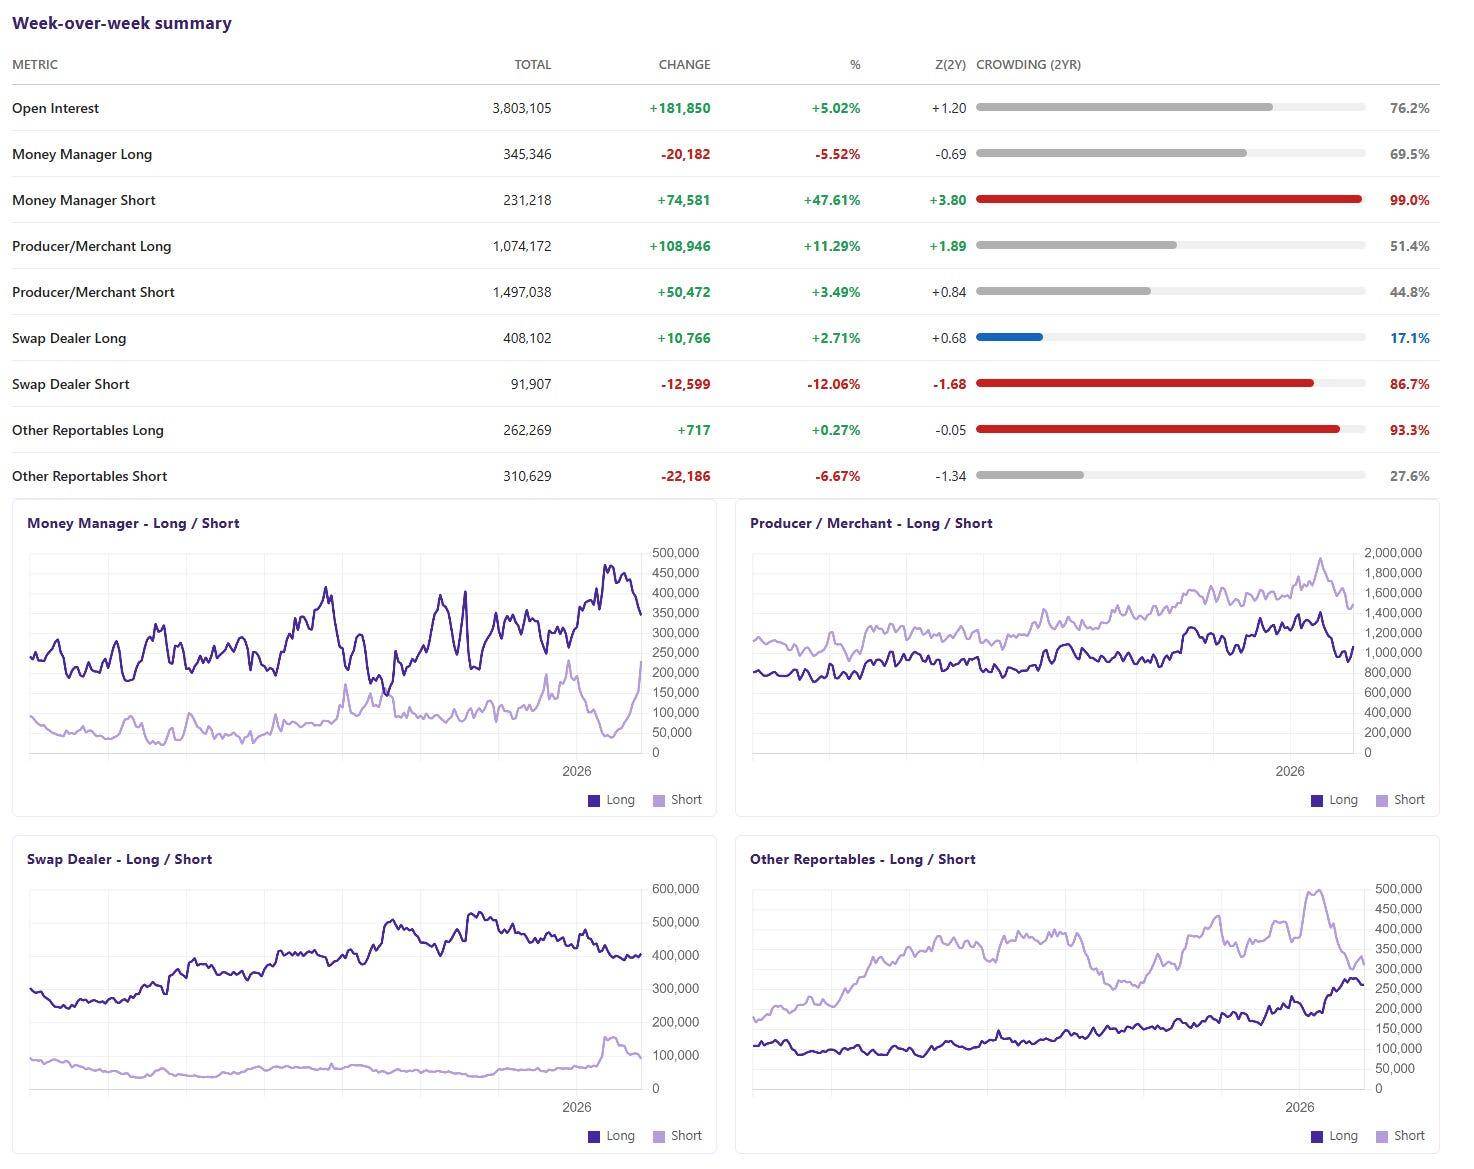
The read: MM short is the dominant signal. The WoW move (z +3.82) pushed shorts to the 99th / 100th / 100th percentile (2Y / 5Y / All-time) — extreme crowding across every look back. Speculative conviction is firmly and decisively bearish. However, the net MM position is still long. This data factors in all contracts on all expiries- its not just front month positioning, and it also includes options positions.
Details: MM pressed shorts +47.6% (+75k) this week while trimming longs -5.5% (-20k). That moved MM from 2.3:1 long to 1.5:1 long — at the 69th percentile (2yr) on the long side. OI expanded +5.0% (+182k) — fresh money entering even as positioning shifts. OR covered shorts -6.6% (-22k), though OR longs still extreme at the 93rd percentile — reads as hedging exposure rather than a flip. PM added longs +11.2% (+109k). SW covered shorts -12.0% (-13k), with SW shorts at the 87th percentile (extreme hedging-cover regime intact) and longs at the 17th.
What’s the Next Move?
Regards to the larger trade window, I have my view that we are about to hit a whipsaw price wave we have not seen in years. On WTI, We are set to roll to August tomorrow June 23rd and put July trading to bed. It has been my view for several weeks now that the market will flip hard to the upside while we trade the August contract as the front.
With the most volatile upside to come in the September contract. Traders will already be positioning in Sept for the long side.
We already trade August as front month on Brent, this will roll to September on the 30th of June. So timing wise, I think we can pinpoint to the 1st July for the bid to really kick in.
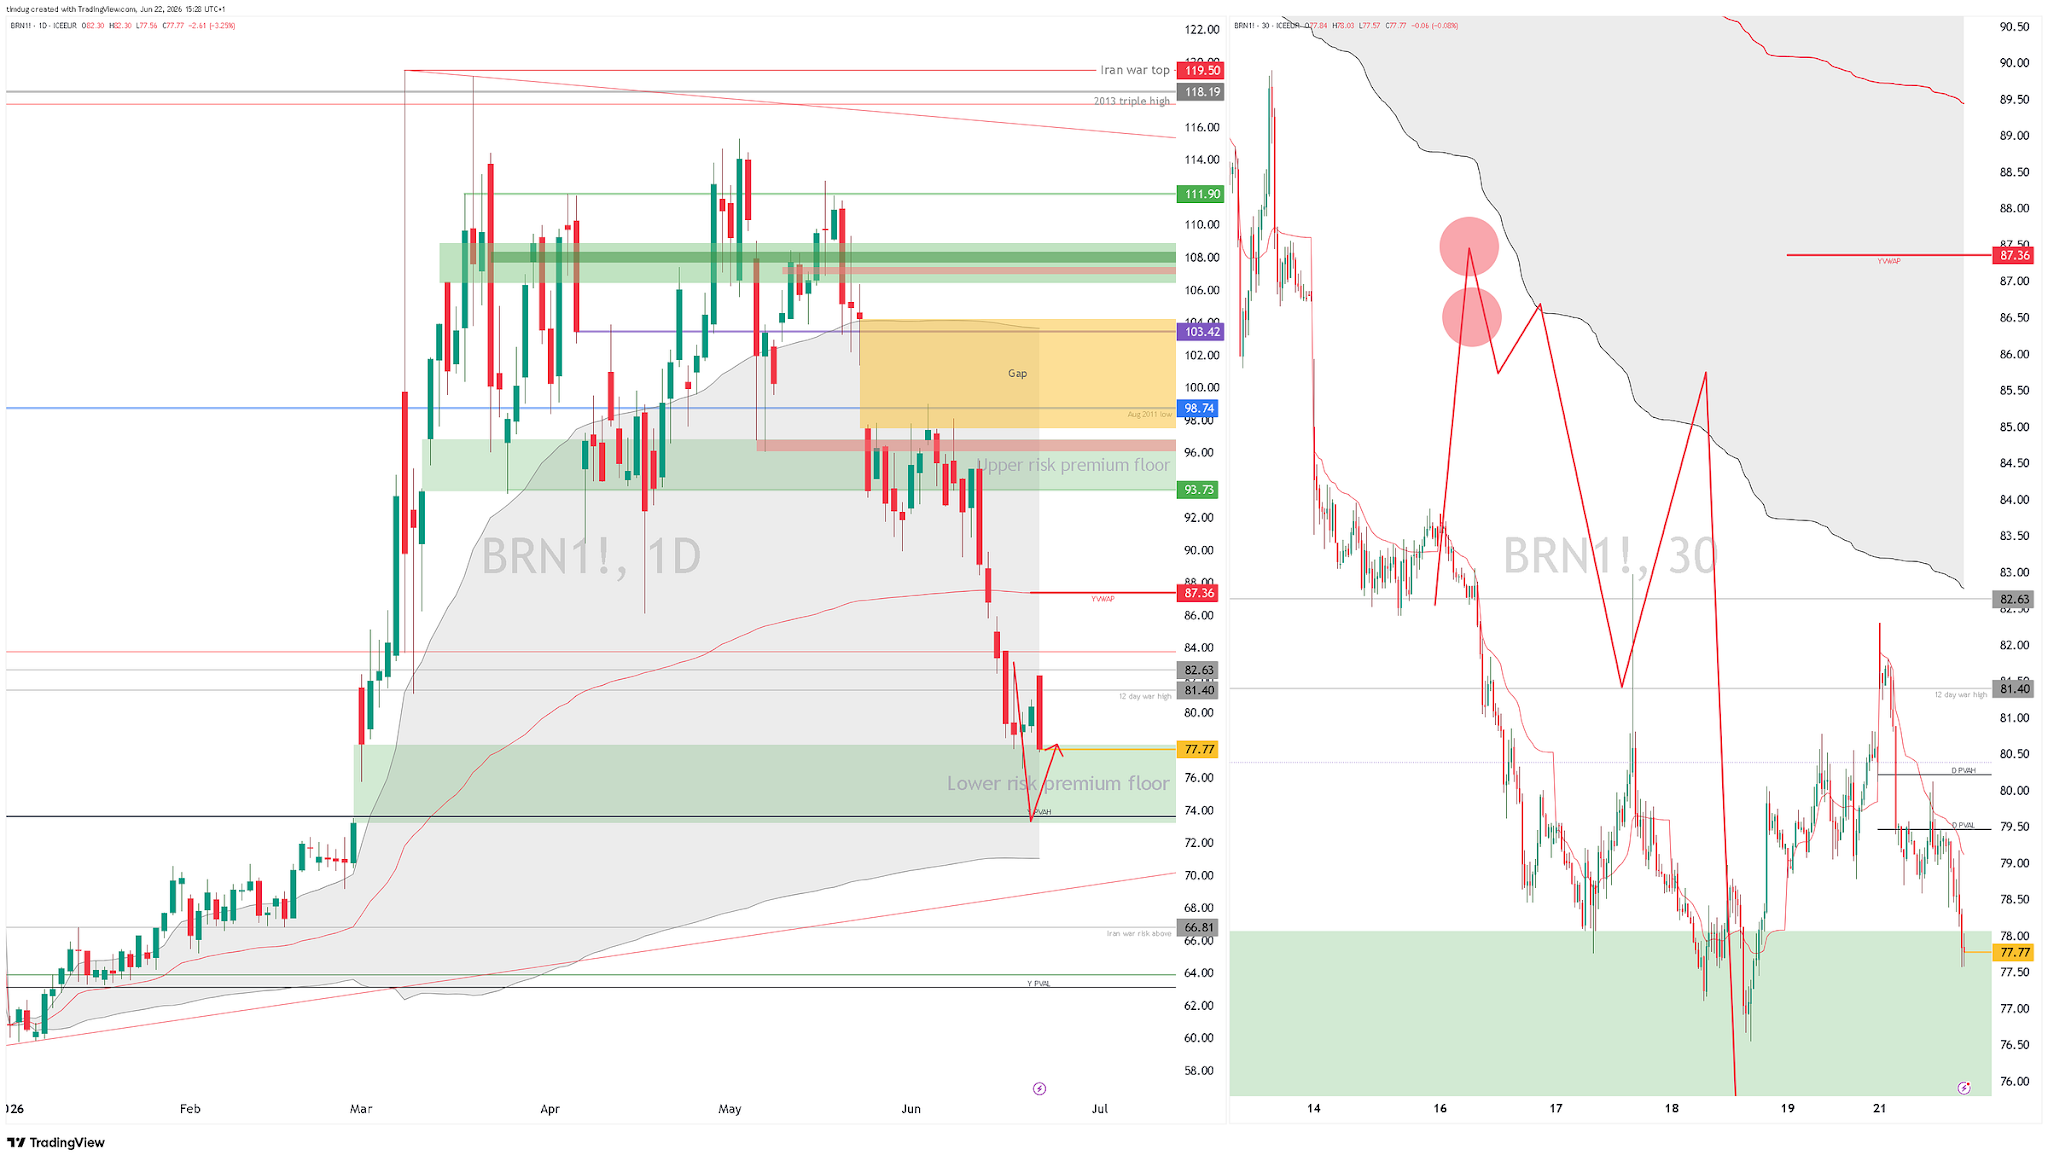
Here is a spread expression of what I’m talking about regarding the whipsaw.
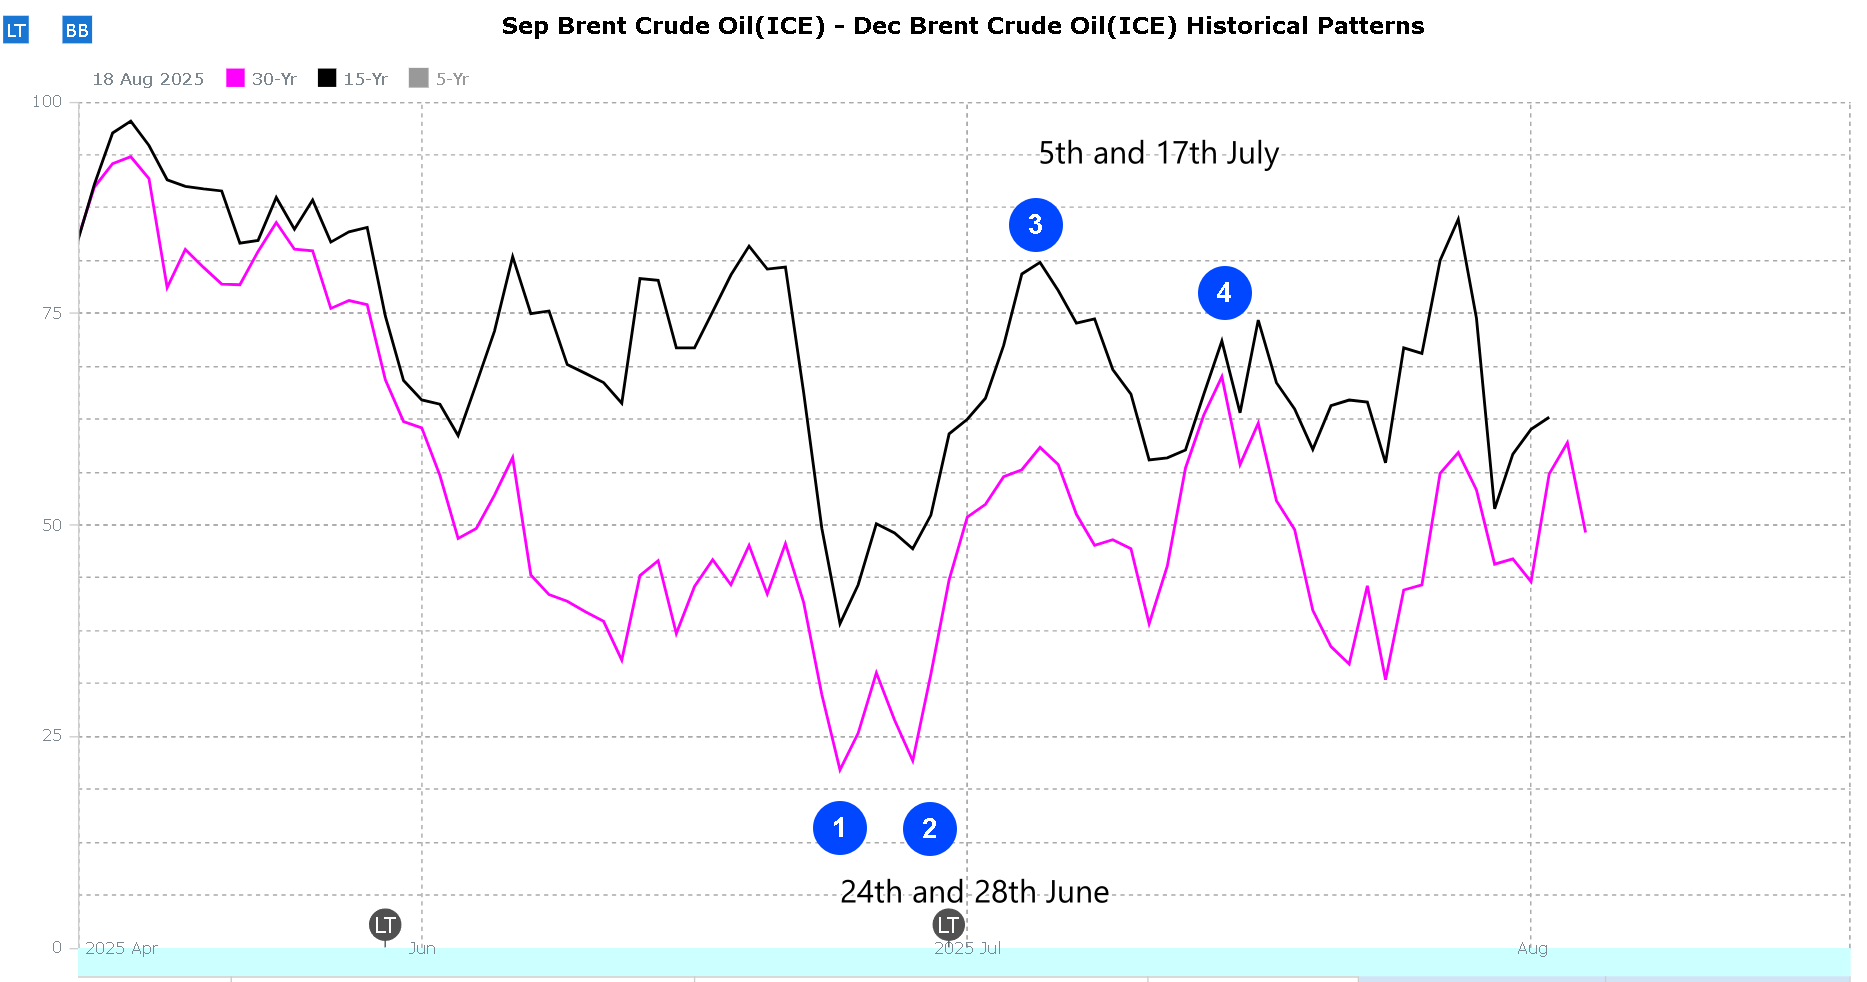
Looking at buying the September/December 2026 Brent spread. Our system shows me that we should be buying dips on this starting from 25th June – this week and out by the 7th July. I won’t be hanging around in here and will be turning 100% bearish on this spread once we get to mid-July.
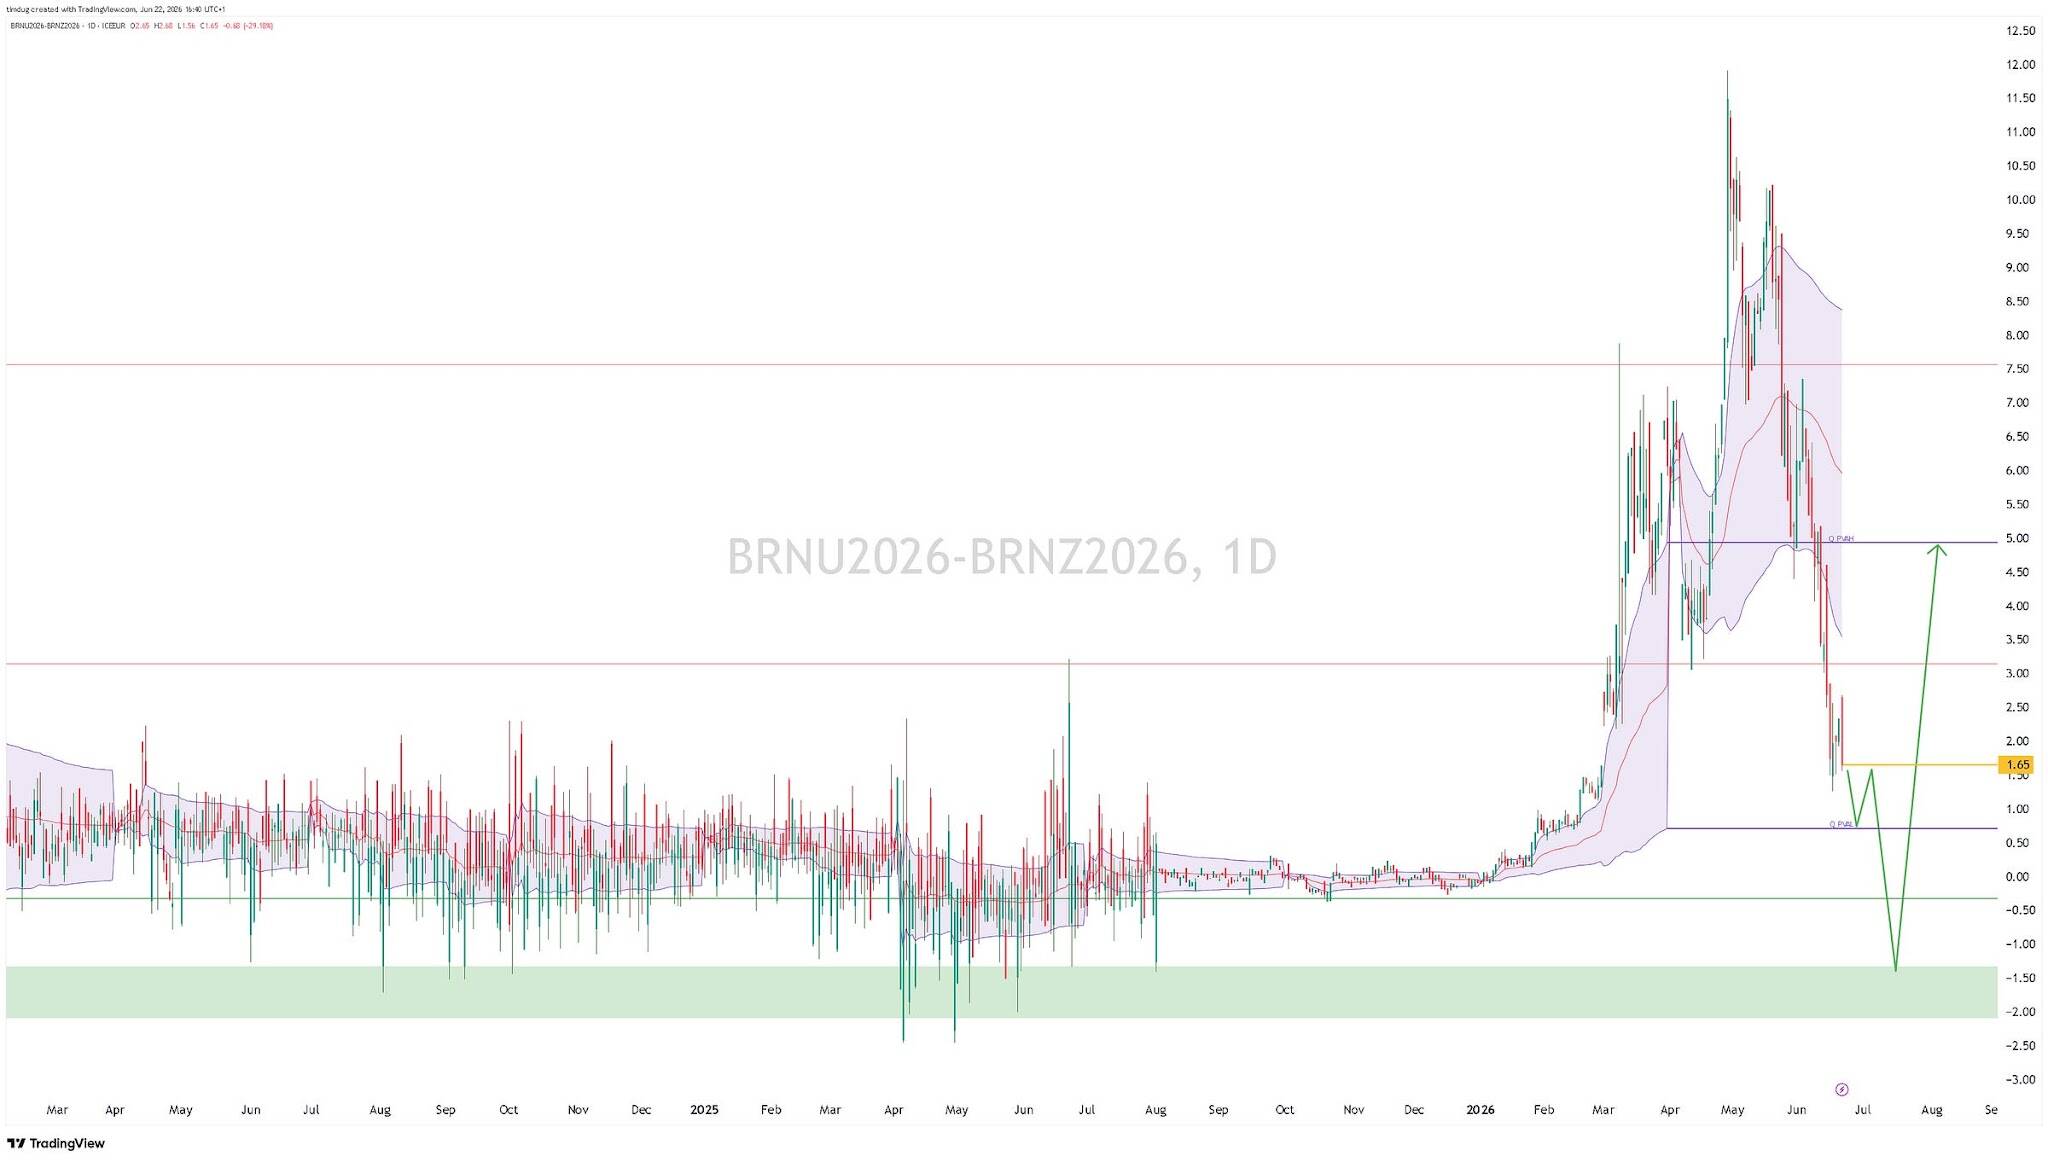
Here is our look back data on this exact spread. Black line is a15yr sample, pink is a 30yr sample.