


1. Monday’s 10% Brent drop reflects record crude sitting on ships, but refined product on water is the tightest since 2021 and the diesel crack is near $81 a barrel against a $25 five-year norm.
2. The US Strategic Petroleum Reserve is down to 311.4 million barrels, the lowest since 1983, and can only pump at 61% of its design rate, so it can no longer cap prices the way it has since March.
3. Product exports through the Strait of Hormuz have collapsed from roughly 4.5 million barrels a day to about 500,000, between half and two thirds of Russian refining is offline, and China may halt its own product exports in August.
‘’Texas oil fields have been like a reliable old warrior that could rise to the task when needed. That old warrior can’t rise anymore’’-Byron Tunnell on the lack of spare capacity of US drillers in the post Suez crisis world. Today, US drillers are in the same situation.
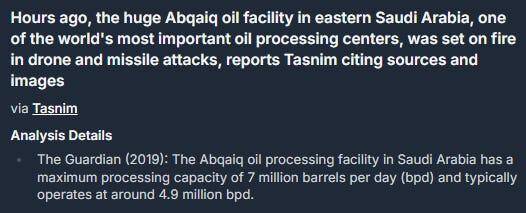
Newsquawk alert reporting an attack on Saudi Arabia’s Abqaiq oil processing facility. Source: Newsquawk.
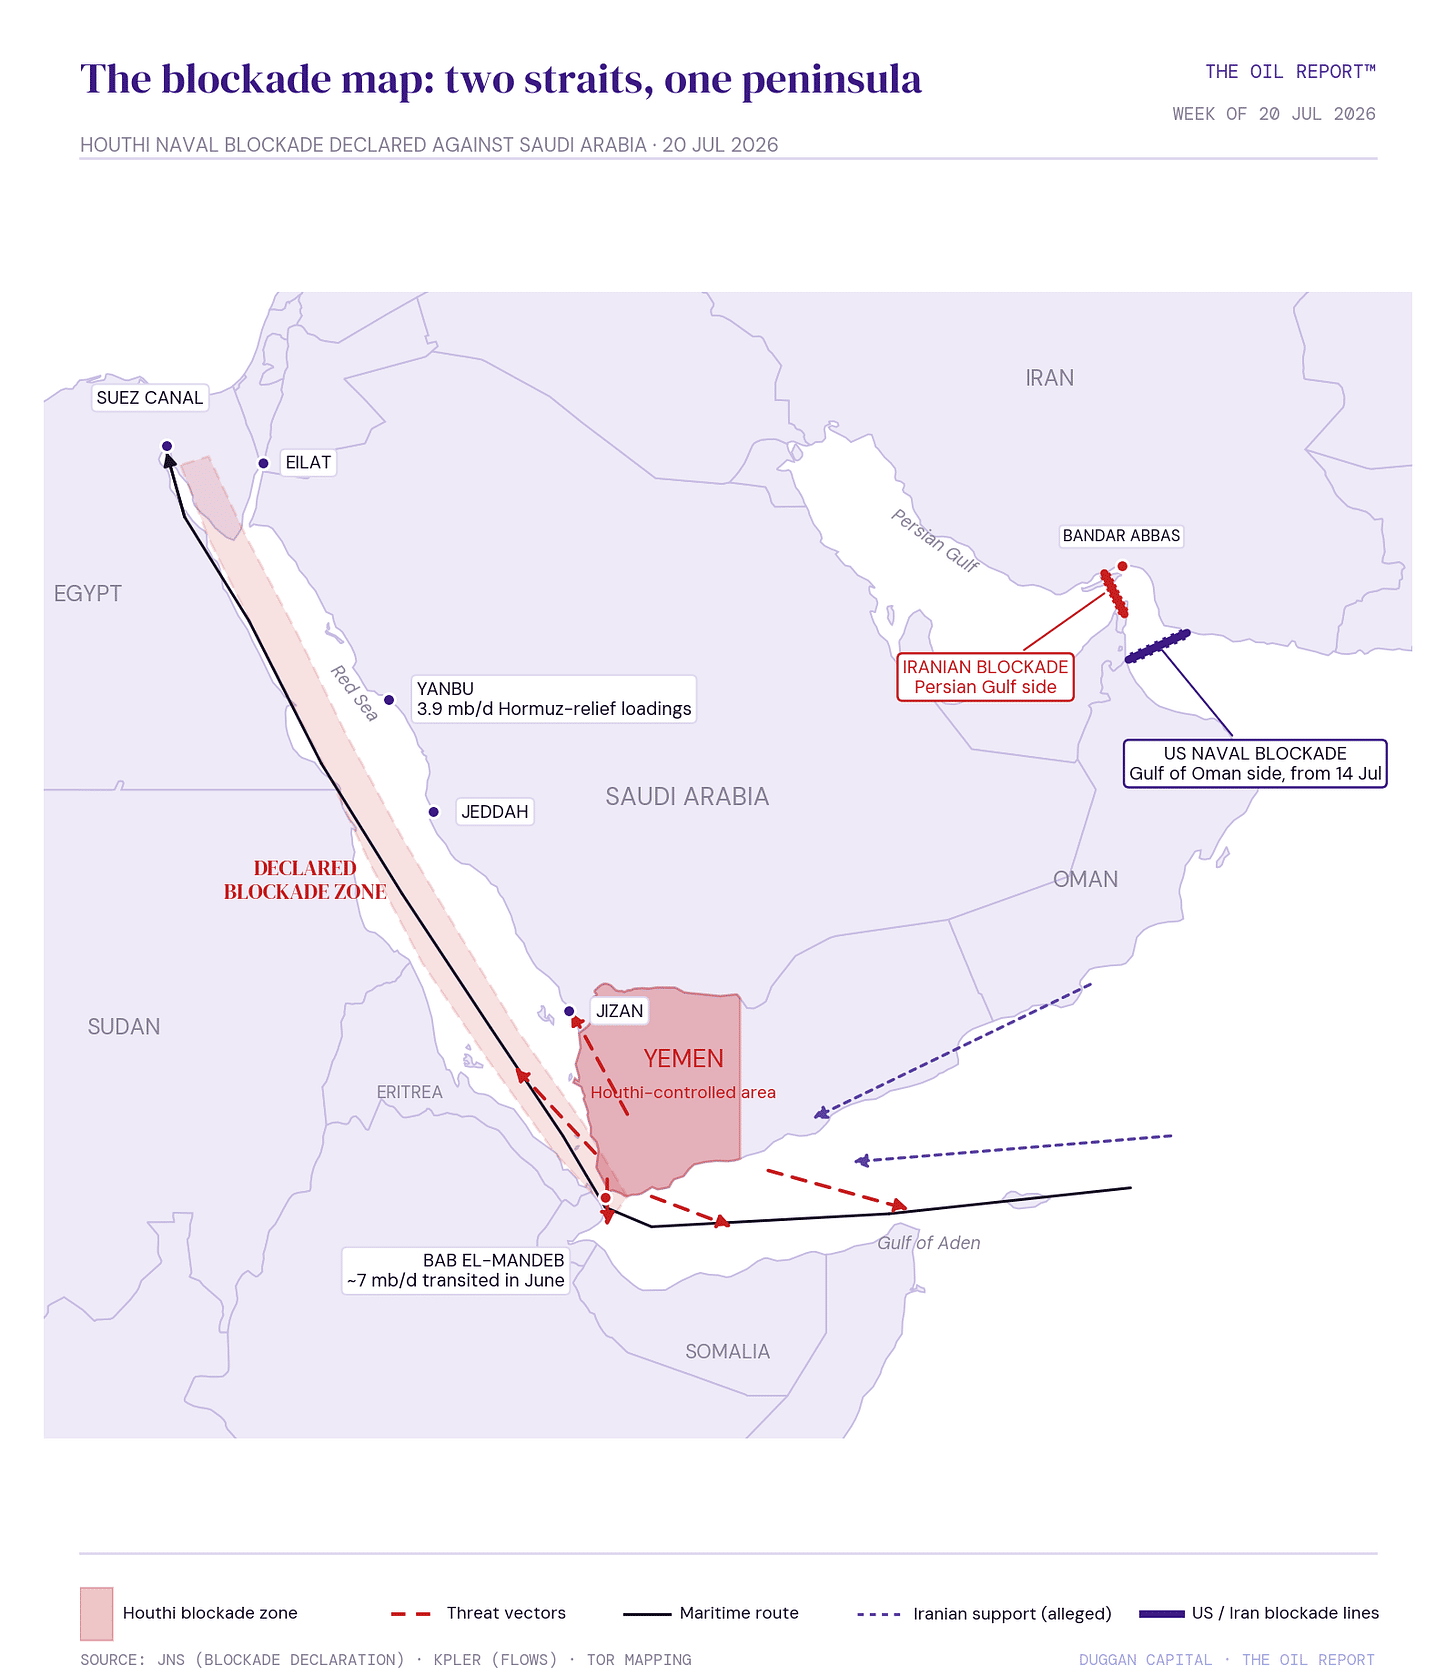
Blockade map showing maritime routes, threat vectors and the chokepoints around Bab el-Mandeb and the Strait of Hormuz. Source: Duggan Capital, The Oil Report.
Oil Supply Risks Build Across the Strait of Hormuz and Bab el-Mandeb
The designs of empire are being battle tested across two of the world’s 7 key oil choke points.
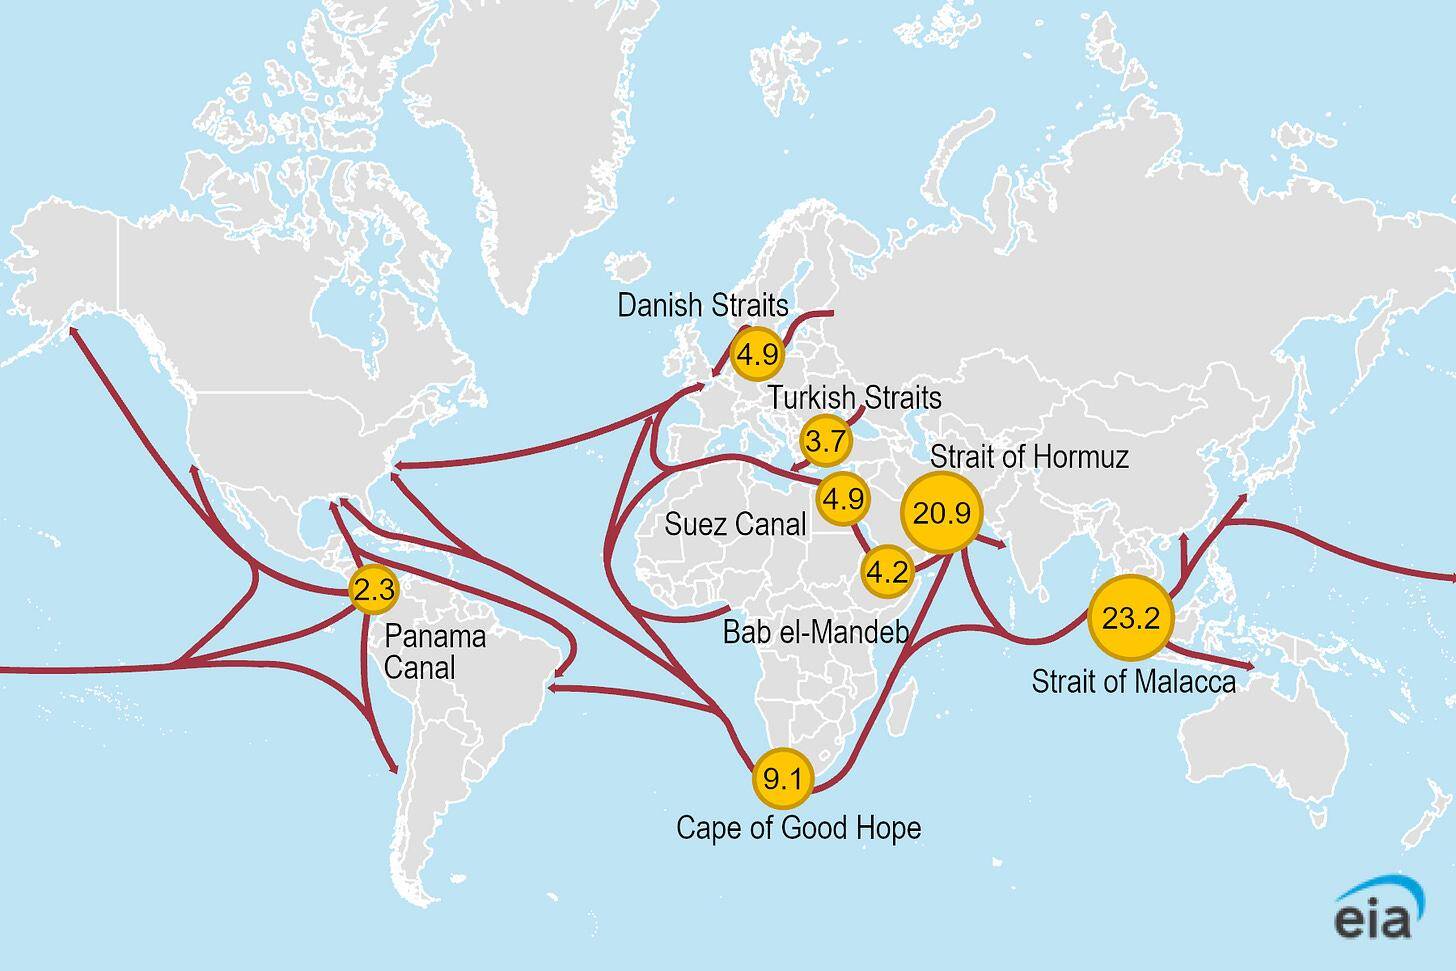
Daily petroleum and liquids transit volumes through major global maritime oil chokepoints. Source: U.S. Energy Information Administration (EIA).
The US administration is at war with Iran at the behest of Israeli desires for a greater Israel plan. American lives and taxpayer money are grist for this geostrategic mill.
Trump is now as they say, in too deep. The outcomes from here are becoming increasingly binary. With dwindling military options bar a nuclear strike in Tehran, The US faces pulling out of the Middle East completely. The far reach of Empire is failing, regardless of all attempts to win the war through narrative control. According to Rubio and Vance, this war was over 3 months ago and Iran have zero military capabilities. What complete horseshit! Stating at almost every hot point ‘Iran are desperate to make a deal’ – more bollox. To steal a line from the great Logan Roy (Succession), They are ‘Not serious people’. You can not run around the globe playing Alexander the great, like the world is all for the taking. The mistake here is that it is not.
America is clearly a vassal state to Israel, and there are 1.5trillion dollars to prove it.
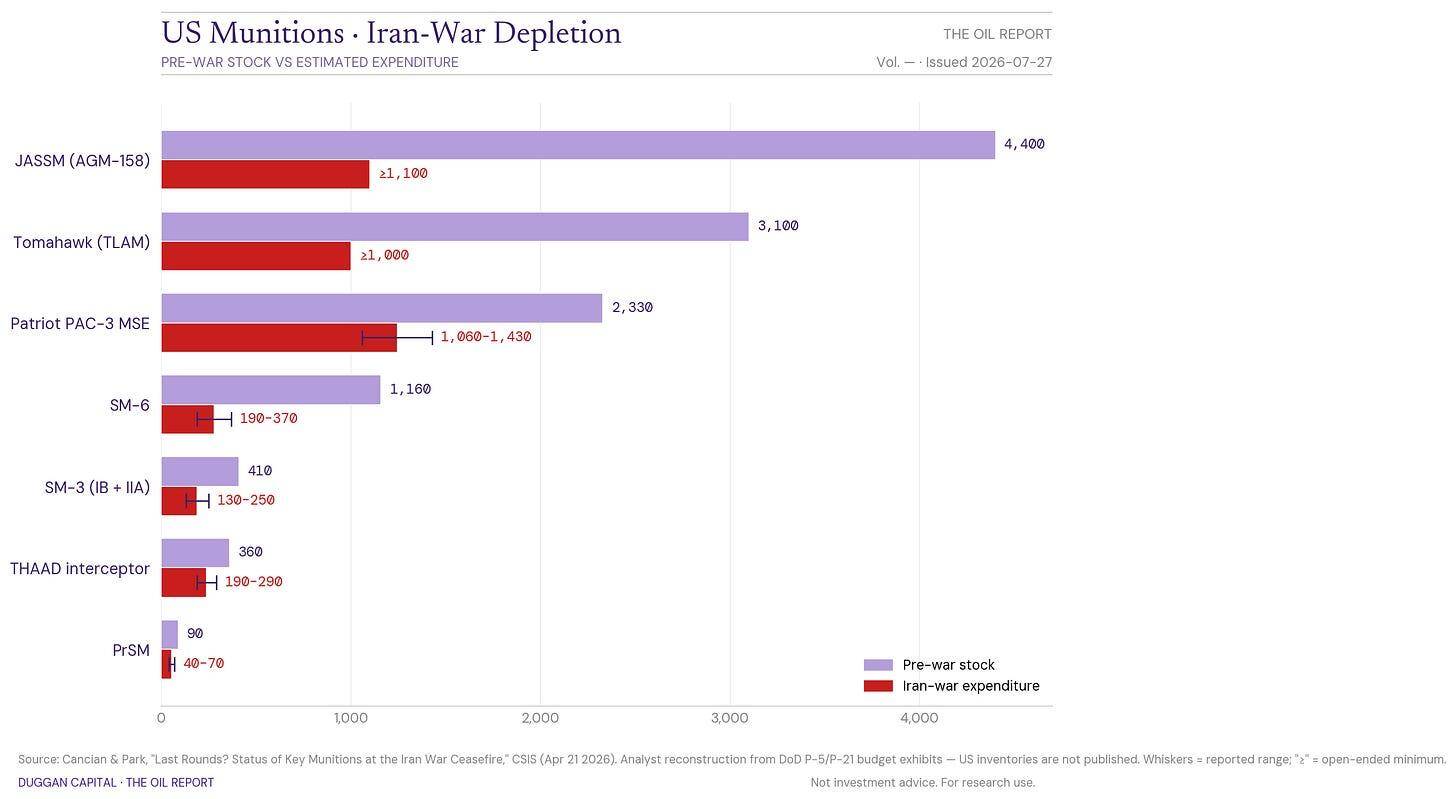
Estimated pre-war and post-war availability of selected U.S. missile systems. Source: Duggan Capital, The Oil Report.
Brent Oil Price Forecast
Every new Brent Oil analysis as it publishes, today's technical signal and key levels, live price — on one page.
See all Brent Oil forecastsCrude Oil Outlook Turns Bullish as Global Refining Capacity Tightens
I have never seen a more bullish picture for crude oil and energy in my life.
- Closure of The Straits Of Hormuz & Bab El Mandeb strait
- 20% IEA OECD coordinated release of 400mb (20% of global stores) coming to an end.
- We are approaching Autumn, where refiners will only have 1 major buying program phase left in the year – seasonally observed.
- Russia refining is out about 40-50% and more may fall. Globally, 10% of refining is closed.
- Demand is tapering in China, but we have not reached traditionally high enough prices to start real demand destruction across the western world – Europe, Americas.
- The SPR release has successfully sheltered consumer markets from real price impact exposure……. so far. That is about to close in the next 4 weeks. Refiners margins will compress.
This is all known and pricing in right now. Despite the bullishness, I would not chase these highs on Front month futures-read more in the trade section below.
Refinery Tightness Keeps the Oil Market Structurally Bullish
In the last report, I wanted to bring awareness to the refinery situation that is unfolding. Effectively global refining capacity is tight, then we had a massive pullback on price that directly correlated to giving refiners cheaper oil with gang buster demand. Higher prices now, will serve to contain that spread back into its historical range.
The way I see it, it’s like the market has been living off of its SPR savings for the last 6 months. Those savings have taken a serious hit- about 20 to 30%. There are still ample amounts left in the tanks.
What Could Invalidate the Bullish Oil Thesis?
The falsifiable test of this is that Iran come back to the negotiations table and call off Ansar Allah (The Houthis). Once we have this confirmed by Iranian negotiation leaders/ political leaders, the bulls have to shift – we will see oil prices crash back down. But until then, we are on the opposite side. Trump is turning up the heat and so is Iran/Ansar Allah.
Diesel Price Outlook: Tight Product Supply Raises Pump-Price Risk
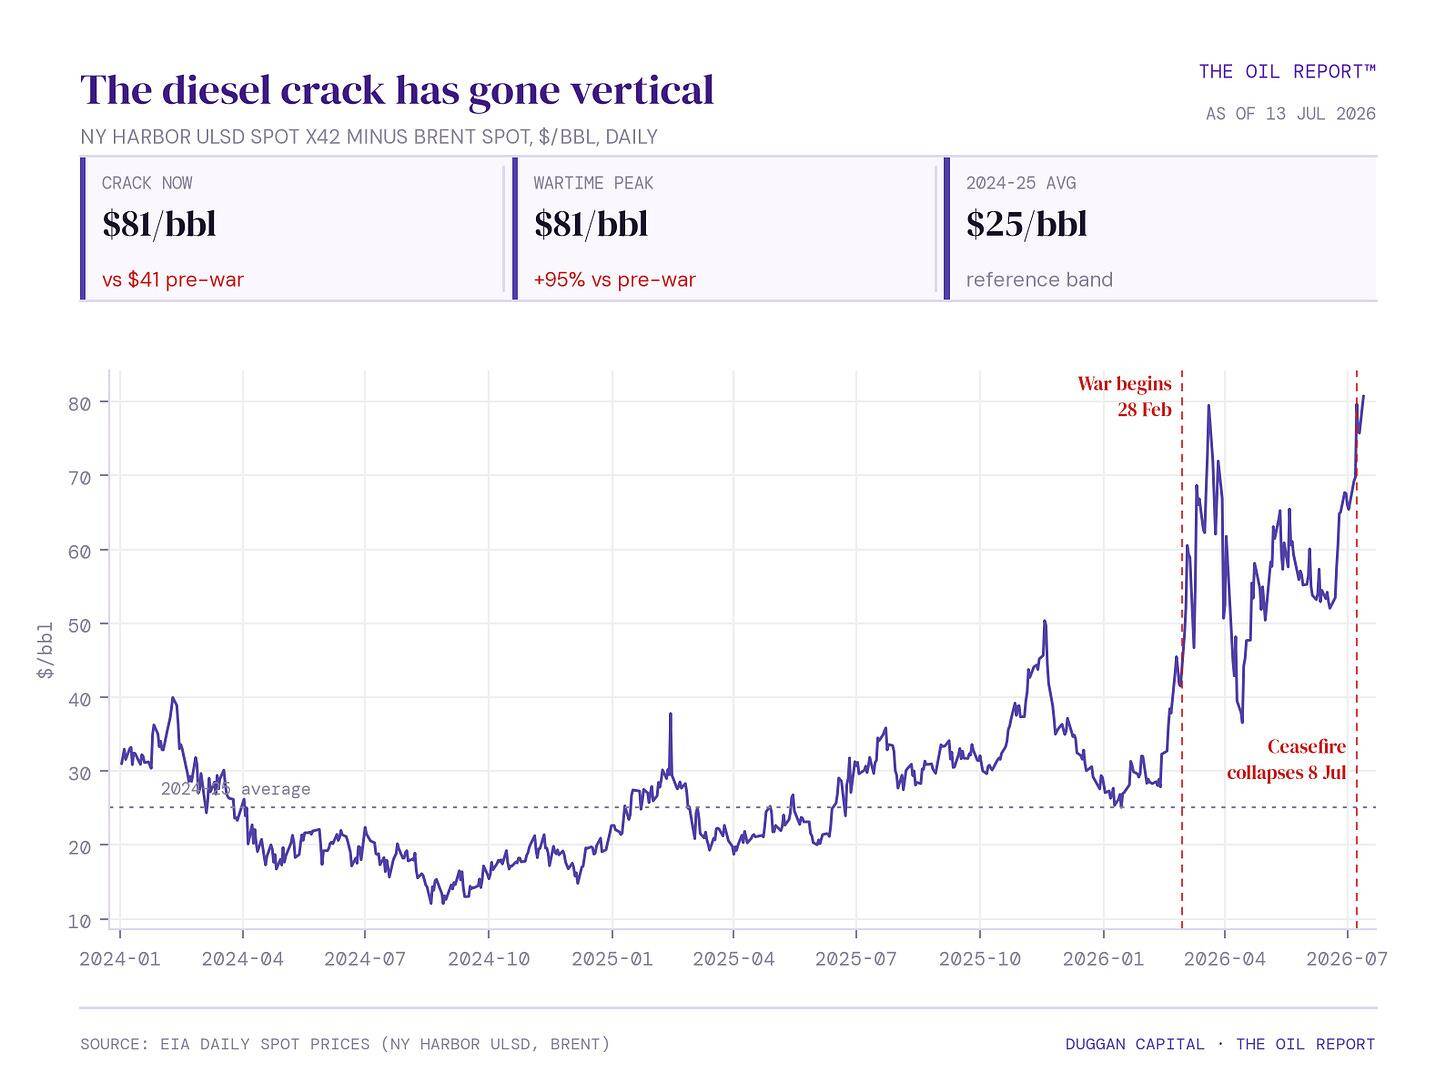
New York Harbor ULSD-Brent diesel crack spread, showing a rise to about $81 per barrel versus a $25 five-year average. Source: EIA and Duggan Capital, The Oil Report.
There is a real risk to diesel prices at the pump rising again drastically. The crack has gone vertical and it is going to come back down if we hold the $80+ handles on WTI. Do not read that as the problem going away though. Here is what actually happened. When we slid down on price in the MOU phase, refiners were buying crude cheap and still selling product at the pump for the same money as before. That is a golden run, and their margins showed it. Now crude has come back up and the run is over. Think oil up, margins down, oil down, margins up – easy.
Record Crude Oil on Water Is Buying the Market Time
Crude on water is at a record high.
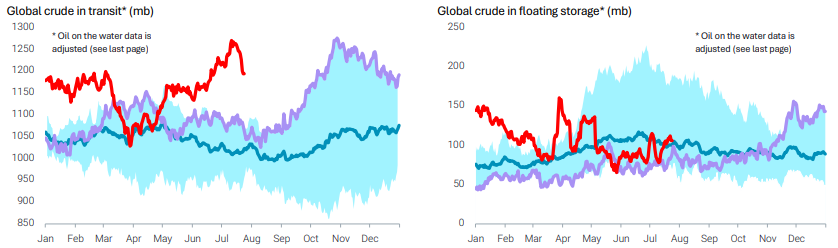
Seasonal comparison of global crude in transit and floating storage, with current-year volumes above historical averages. Source: Vortexa.
Fuel Products on Water Fall to Their Lowest Levels Since 2021
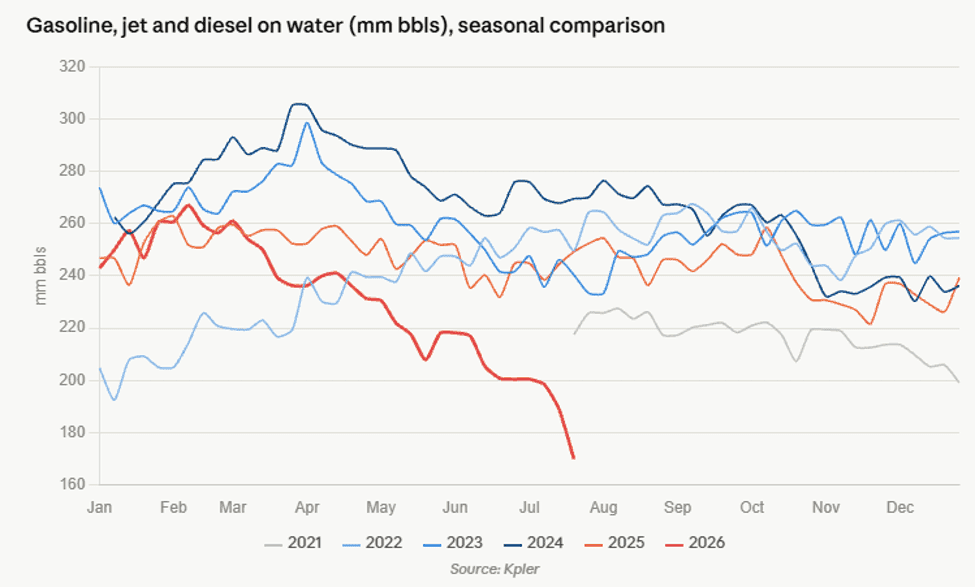
Seasonal comparison of gasoline, jet fuel and diesel volumes on water, showing a sharp current-year decline. Source: Kpler.
Products look like a shit show. Now we see the fine line!
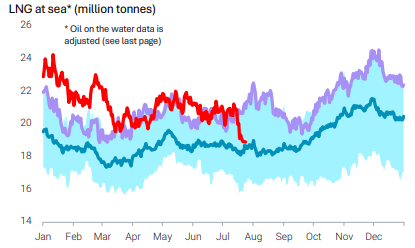

Seasonal comparison of LNG volumes at sea, with current-year levels declining into July. Source: Vortexa.
Russian Refinery Outages Deepen the Diesel Supply Squeeze
Russia has lost somewhere between half and two thirds of its refining to drones and banned diesel exports on top of it. Product coming out through Hormuz has more or less stopped. China is holding its barrels at home, and there is talk it stops exporting altogether next month. And the strategic reserves that have quietly papered over all of this since March are drying up – the coordinated draws have fallen off a cliff since June. So Europe walks into winter restocking with less coming from everywhere at once. Products look like a shit show. Now we see the fine line.
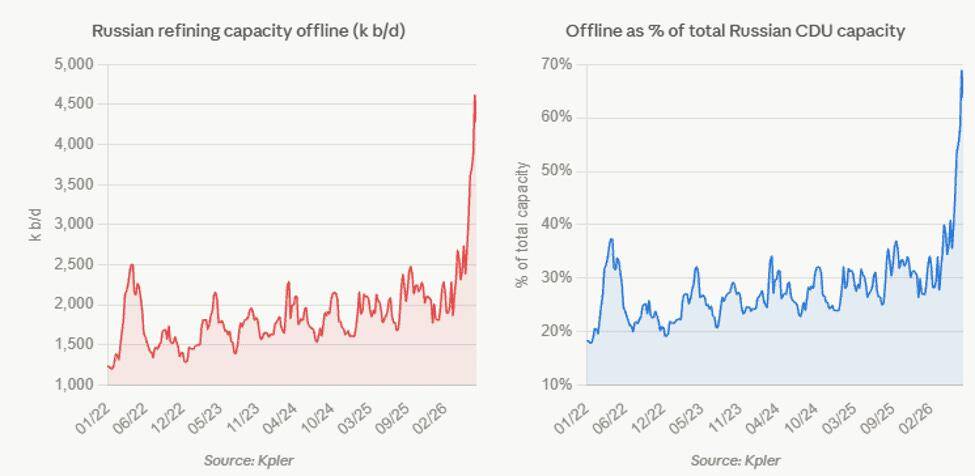
Russian refining capacity offline in barrels per day and as a share of total crude-distillation capacity. Source: Kpler.
Europe Faces Higher Winter Fuel Costs if U.S. Exports Tighten
If the US tightens up on diesel exports (not currently), Europe and the ARA market will get less of the exports of product and crude that it did during the initial phase (March – August). Consumer prices will inflect much higher than the initial phase.
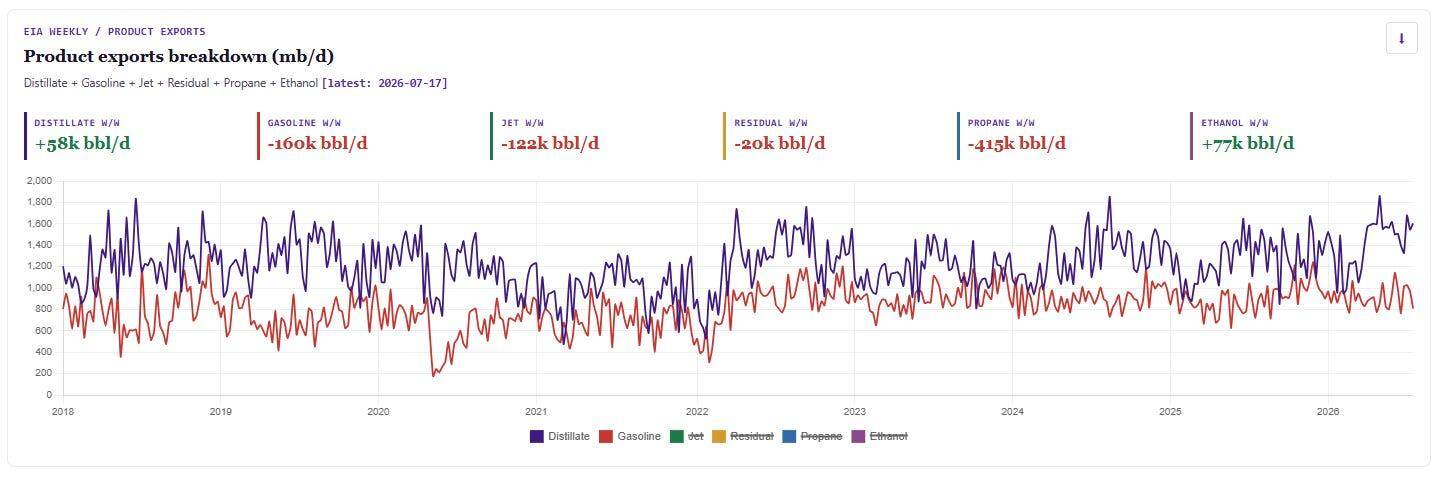
Weekly U.S. petroleum-product exports by category, including distillate, gasoline, jet fuel, residual fuel, propane and ethanol. Source: U.S. Energy Information Administration (EIA).
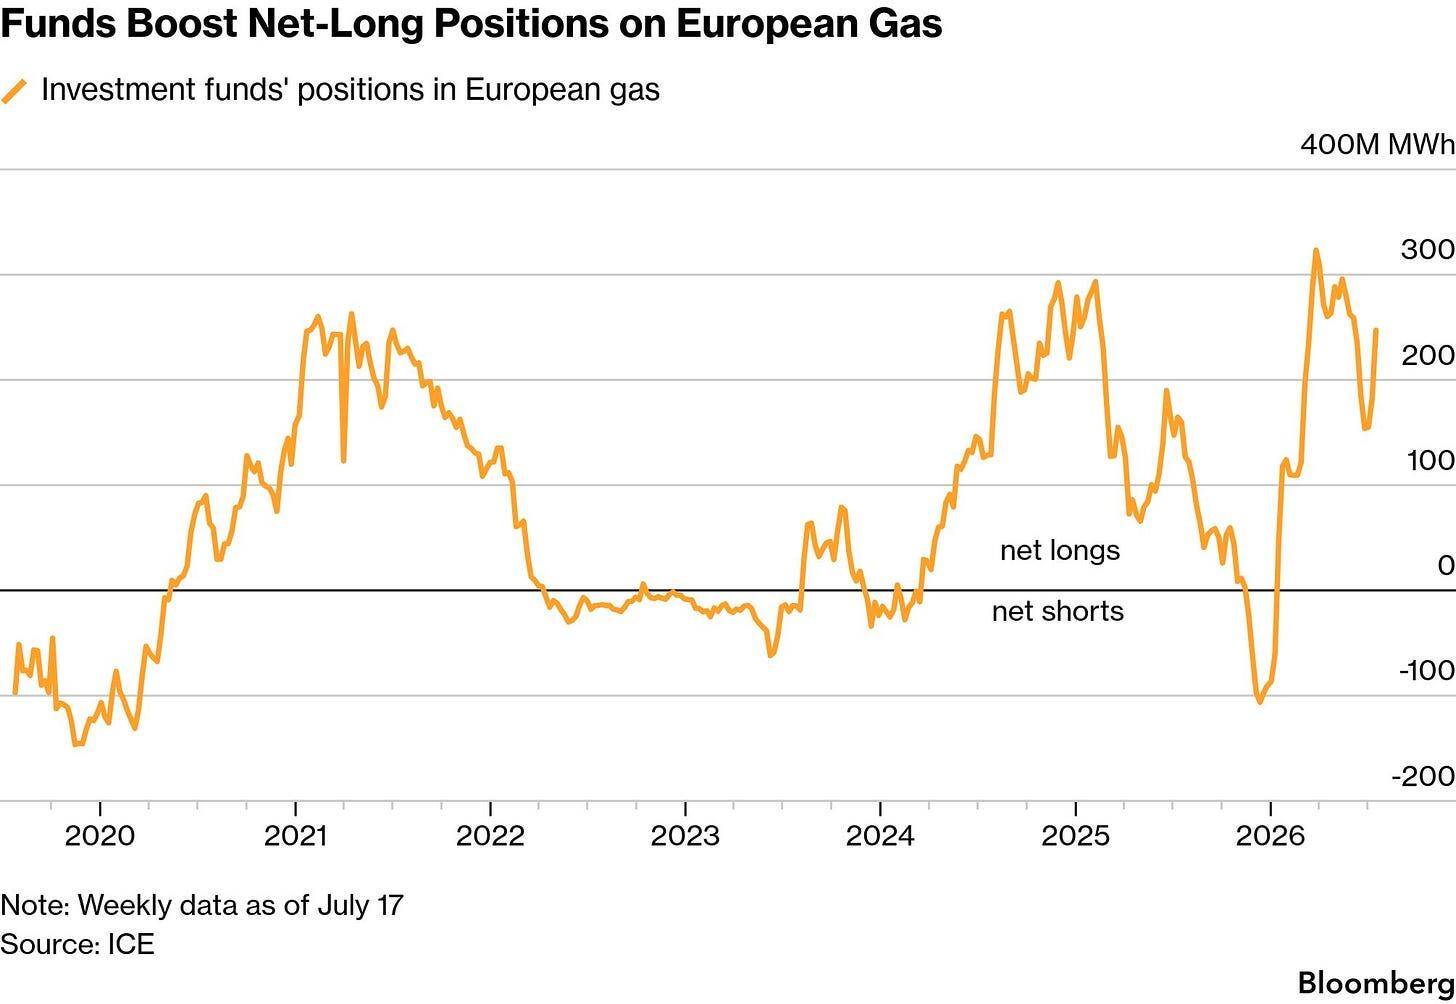
Investment funds’ net-long and net-short positioning in European gas. Source: ICE and Bloomberg.
Record Floating Oil Inventories Offer Only a Temporary Supply Cushion
Middle East Gulf Exports Slide Back to 4.5 Million Bpd
Despite crude exports from MEG getting back to 12mb/d, they have now slid back to 4.5mb/d, with products exports sliding 4.5mb/d to 500k bp/d.
‘‘Record oil-on-water inventories are buying the market time rather than eliminating supply risk. Gulf exports have fallen to 4.5 mb/d over the past 10 days, including around 1.7 mb/d from Iran following the reimposition of the US blockade on 14 July. If these lower export rates persist, the current inventory cushion will gradually erode, forcing refiners to compete more aggressively for replacement barrels.’’ From Kplr
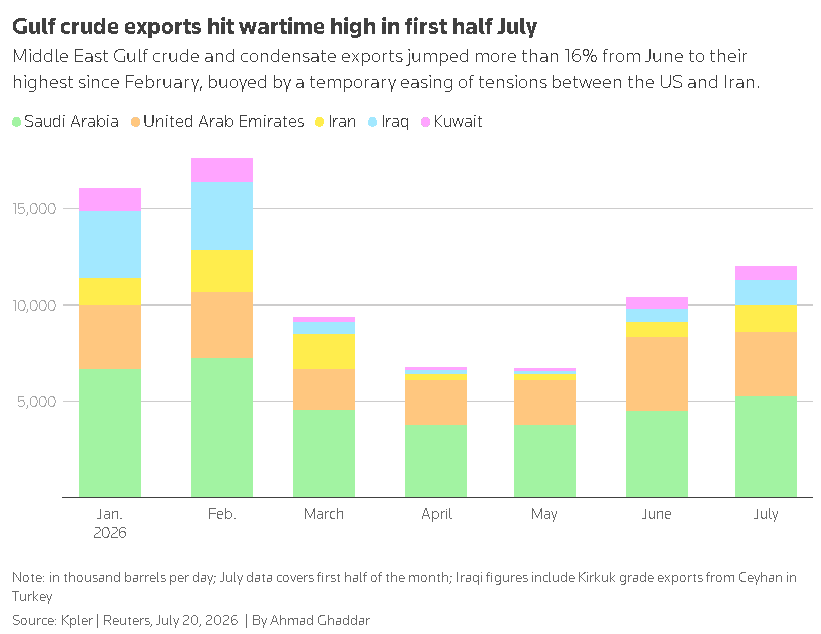
Middle East Gulf crude and condensate exports by country from January through the first half of July 2026. Source: Kpler and Reuters.
U.S. Strategic Petroleum Reserve Draw Capacity Is Fading
The one thing to note that is a big game changer here is that over the past week, multiple sources cite the US Department of Energy stating that the actual operation bottom on the SPR is 70mb. This was widely previously touted at 250mb. I suspect there is the hand of Trump and Rubio in this statement to ease concerns about SPR stability.
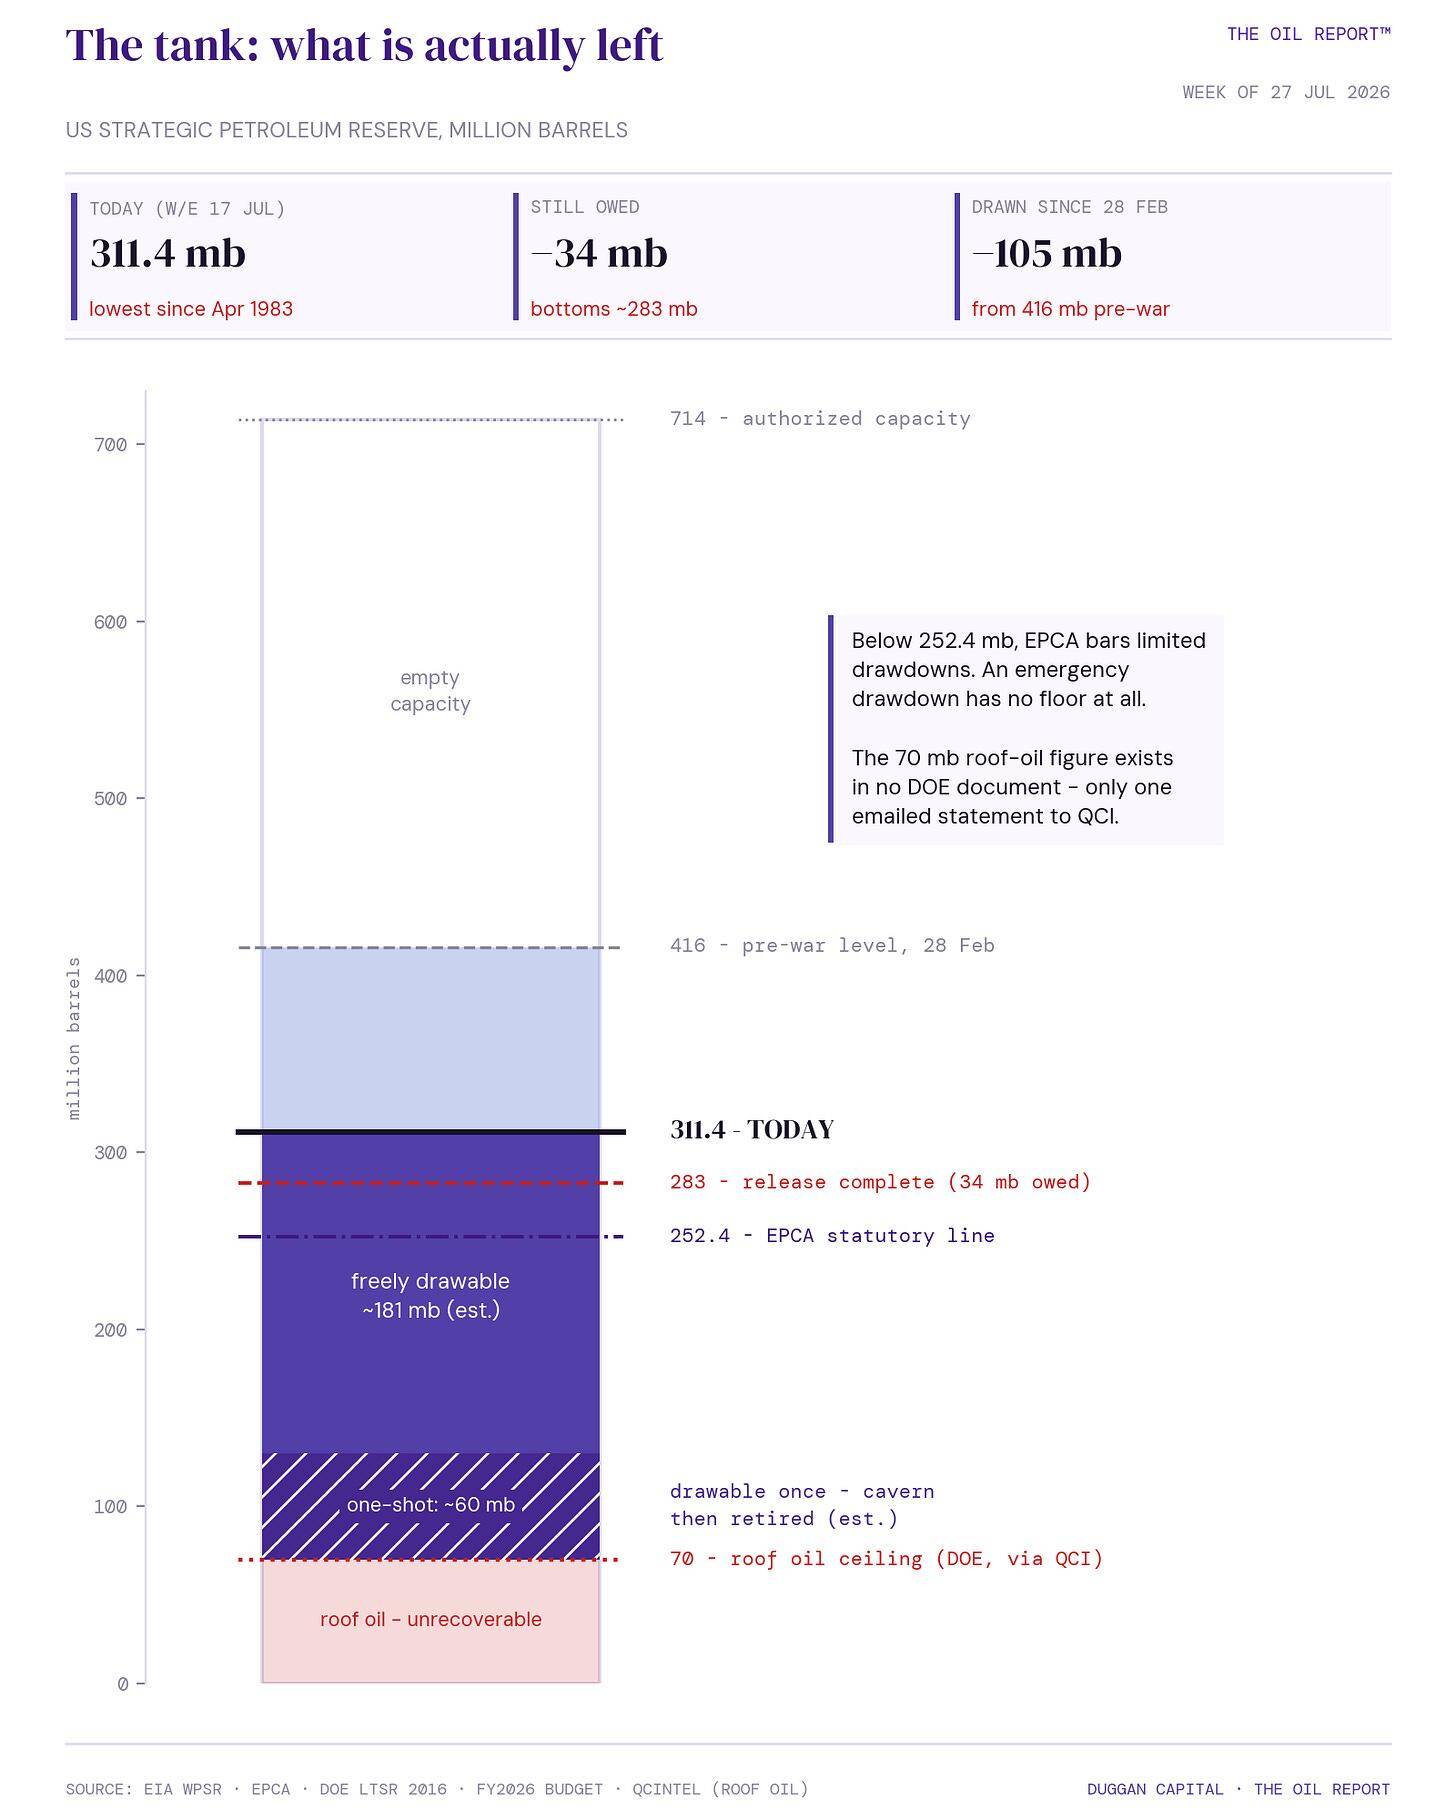
Estimated composition and drawability of the U.S. Strategic Petroleum Reserve at 311.4 million barrels. Source: EIA, U.S. Department of Energy, Duggan Capital, The Oil Report.
SPR Flow Rates Matter More Than the Headline Inventory
The one clear impact on SPR to be aware of is flow rate. As we draw down reserves at this level, the draw rate also drops.
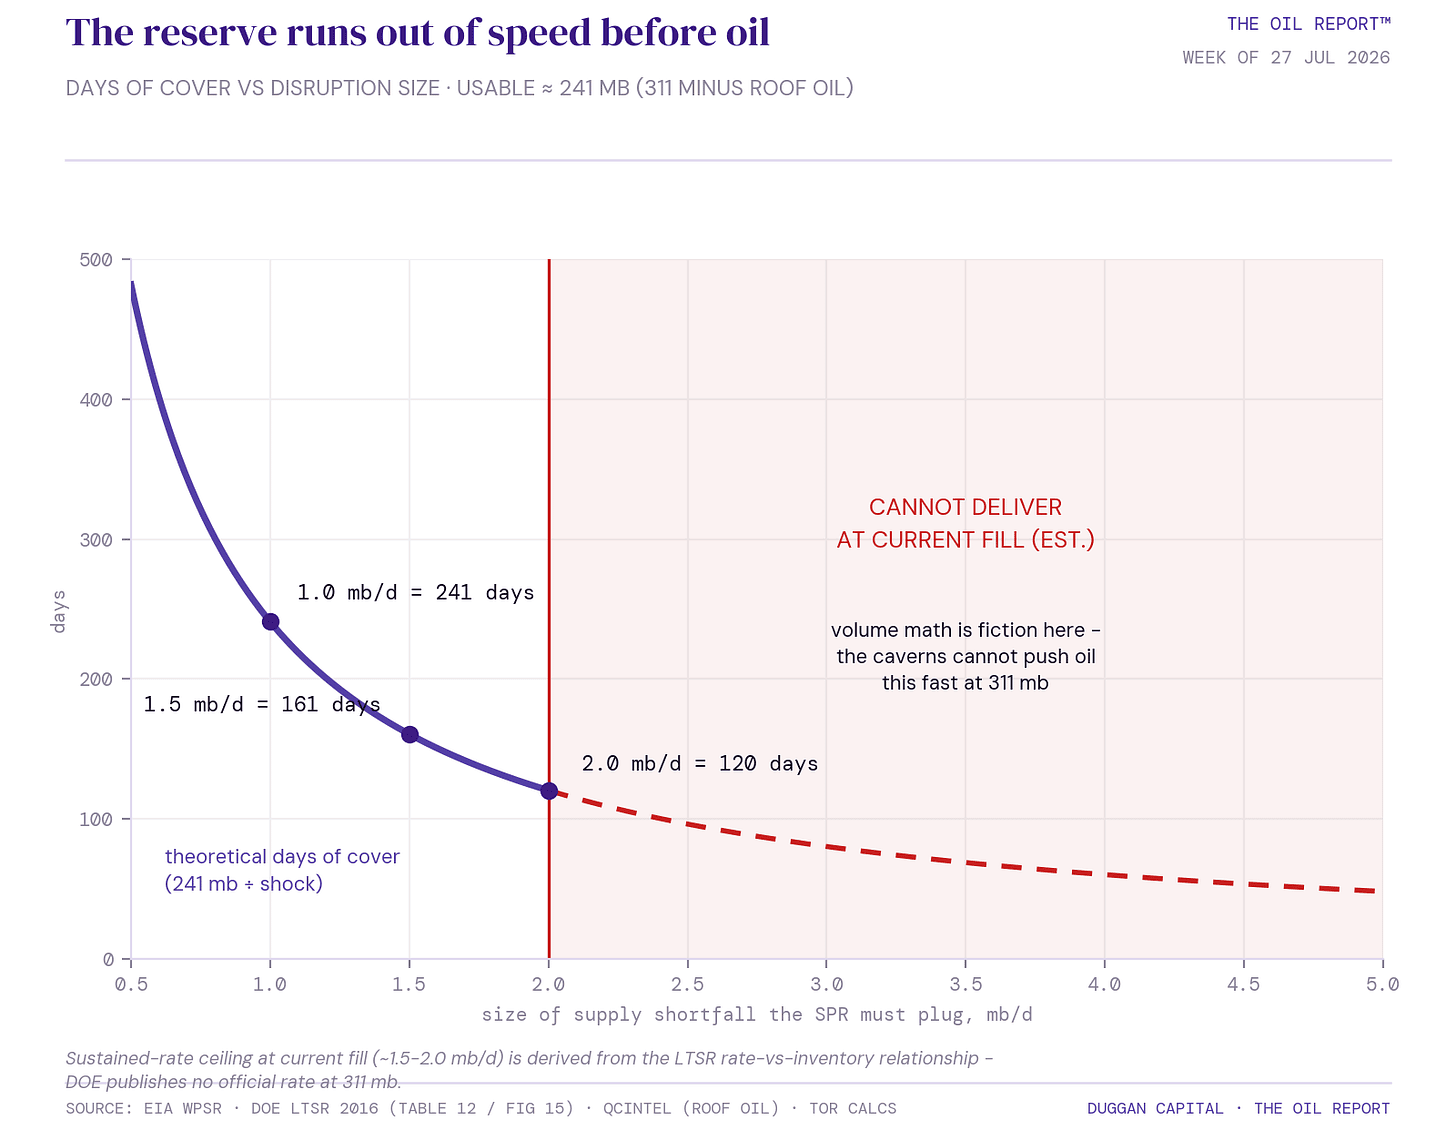
Estimated days of SPR cover at different supply-shortfall levels, showing declining deliverability as inventories fall. Source: EIA, U.S. Department of Energy, Duggan Capital, The Oil Report.
Brent Oil Outlook: Red Sea Risk Is Not Fully Priced In
We priced in what we knew over the last 10 days, The Houthis getting to work in The Red Sea. Tankers are getting hit, and we can presume maximum effectiveness of this operation. Today-Monday has seen a large pullback in price, falling from Friday’s close on Brent $98.70 to down -12% to electronic open $88.80. This is a reaction function of floating crude levels being relatively very high.
Red Sea Disruption Could Drive the Next Brent Price Spike
I think the market has not fully priced The Red Sea risk and the impact that will have on this storage picture. If The Houthis continue to press, we have more upside to price in. Watch for immediate price inflections on not only crude front month, but on distillates stocks over the next 2 EIA reports. If we see contraction in products exports from the US, we will see this become a serious fiscal issue for Europe, not to mention inflation risks. Case in point is here-Monday morning report-Houthis hit the Abqaiq facility.
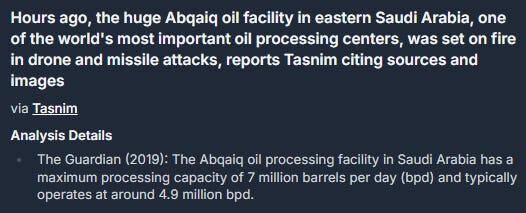
Newsquawk alert reporting an attack on Saudi Arabia’s Abqaiq oil processing facility. Source: Newsquawk.
The unnerving thing here is that there is a non-zero probability here is a US nuclear strike. With depleted munitions depth and boots on the ground not then viable. Let’s all hope this is not an option and that clearer heads prevail.
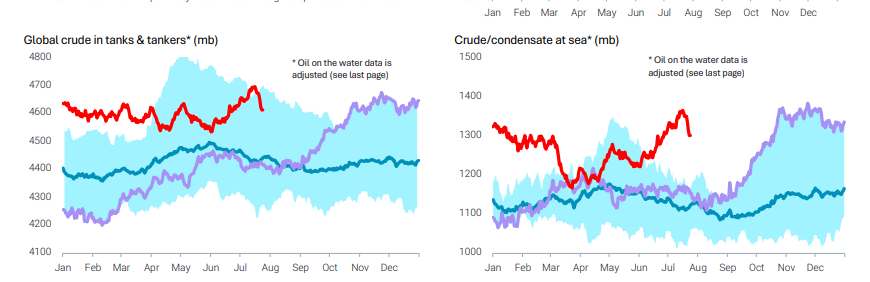

Seasonal comparison of global crude held in tanks and tankers and crude or condensate at sea. Source: Vortexa.
Brent COT Data Signals Further Short-Squeeze Potential
Money Managers Continue to Cut Brent Short Positions
COT Shows us that WoW MM Cut their shorts 13.7%, in the prior week it was -17%, totalling about 64000 shorts flattened out. Swappies increased their shorts 9% and pushed into 82% short.
In brief summary, the Specs (MM) short squeeze has played out over the last 2 weeks of reports and I think there is more squeezing to do. Considering, they are still 94% short on the 5yr look back and 97% all time. So while they have puked 60k shorts over the last 2 weeks, there is more in there!
Other Reportables Add Shorts as the Bullish Setup Persists
OR (other reportable) cohort are busy. Getting net 23% more short, adding 22k contracts and dropping 11k longs. Traditionally, this is the cohort to fade.
This action here says longs are still in play to me.
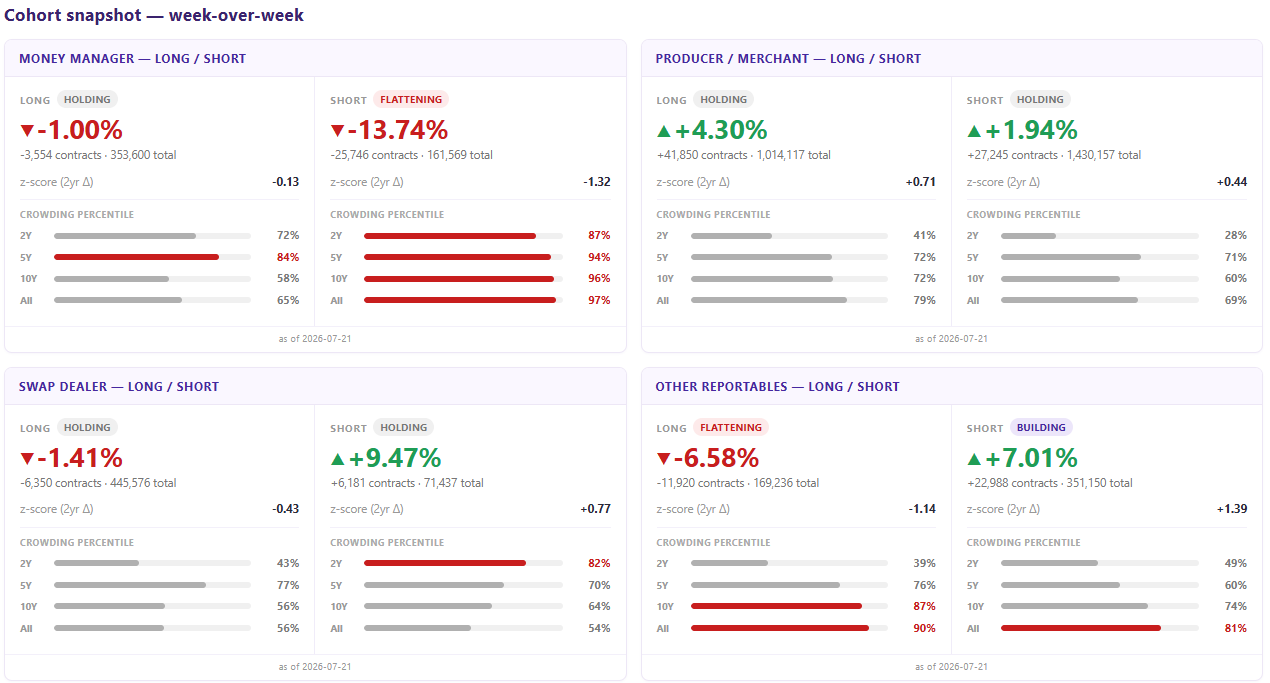
ICE Brent COT cohort snapshot showing week-over-week changes in money managers, producers, swap dealers and other reportables. Source: ICE.
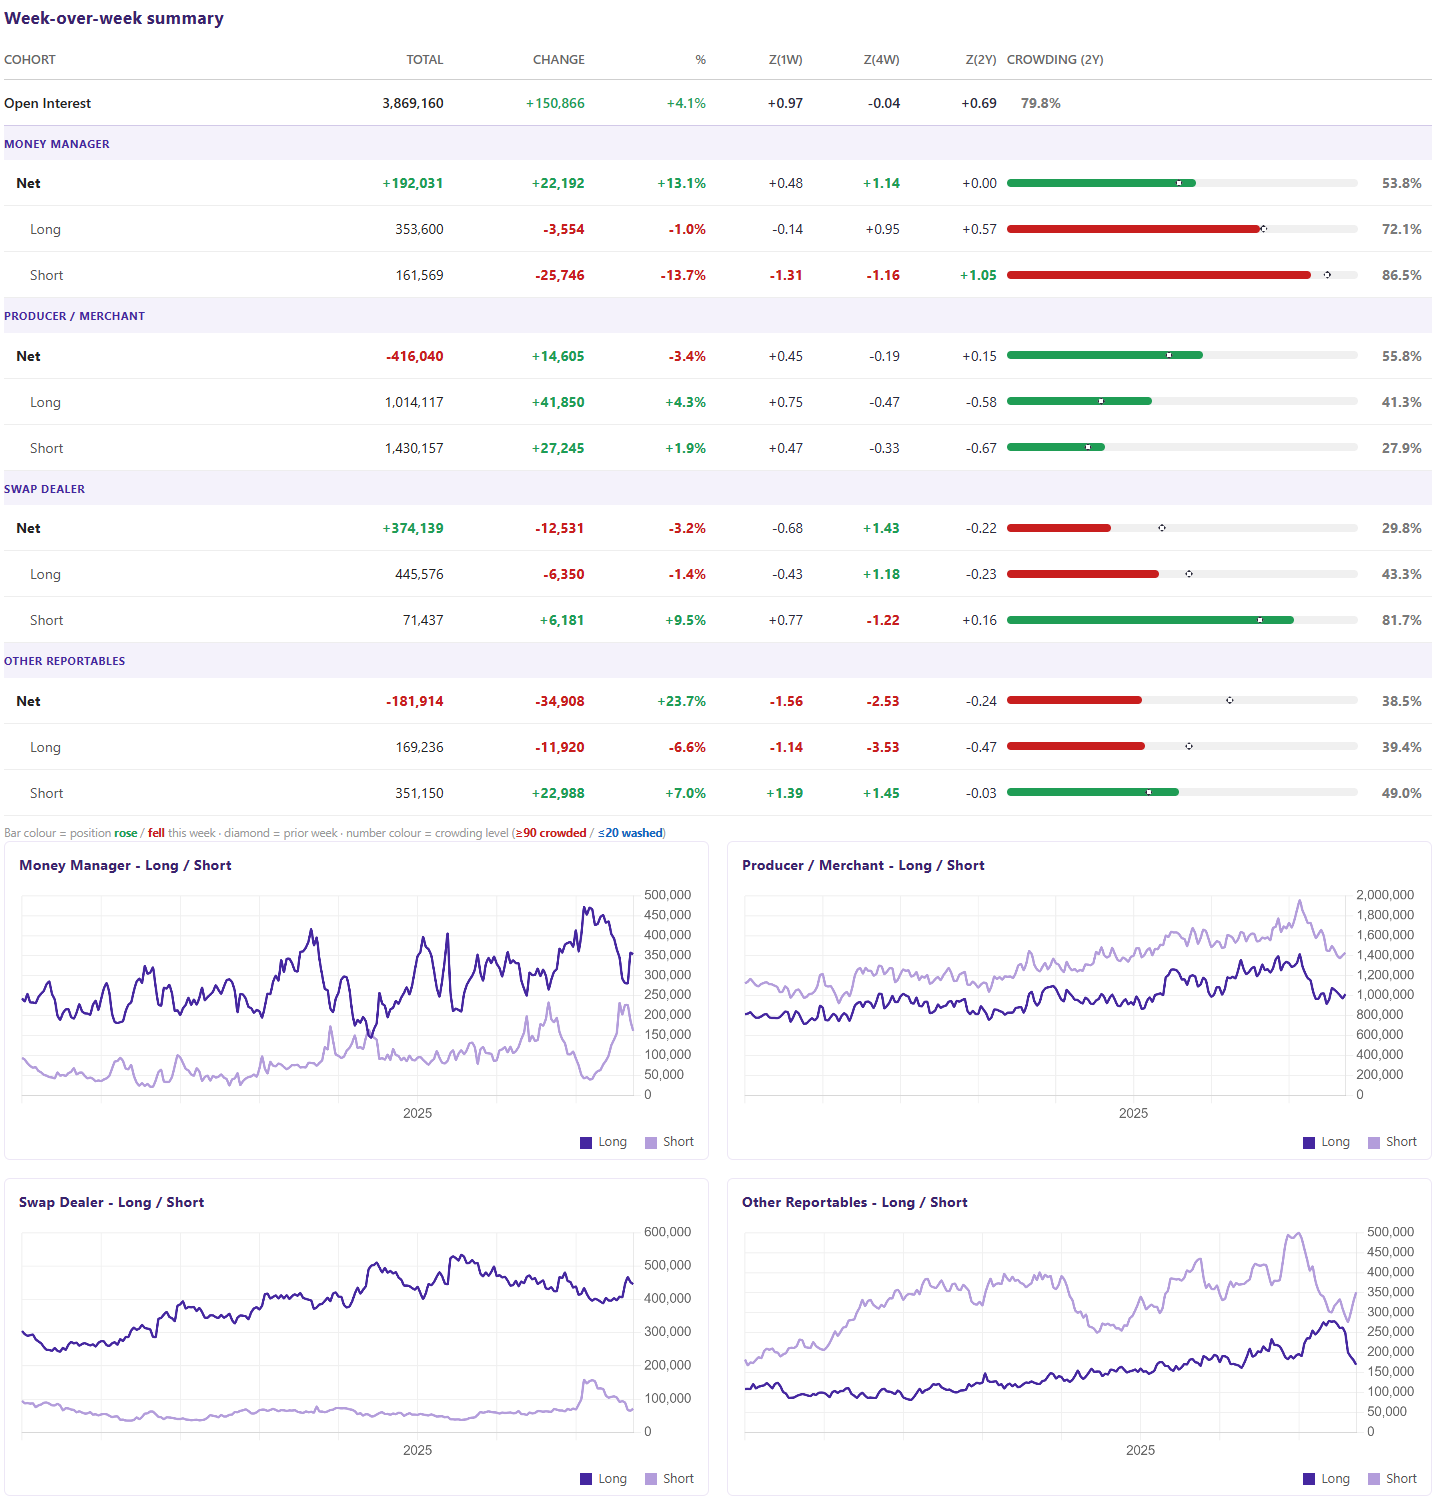
ICE Brent COT week-over-week summary and historical long-short positioning by trader cohort. Source: ICE.
Brent Crude Trade Setup: Pullback Before Renewed Upside
The main direction of travel right now is the downside pullback. I believe the market is mispricing the floating storage against Red Sea risk right now. We are a wet week into this new risk. So let’s see how strong these sellers are.
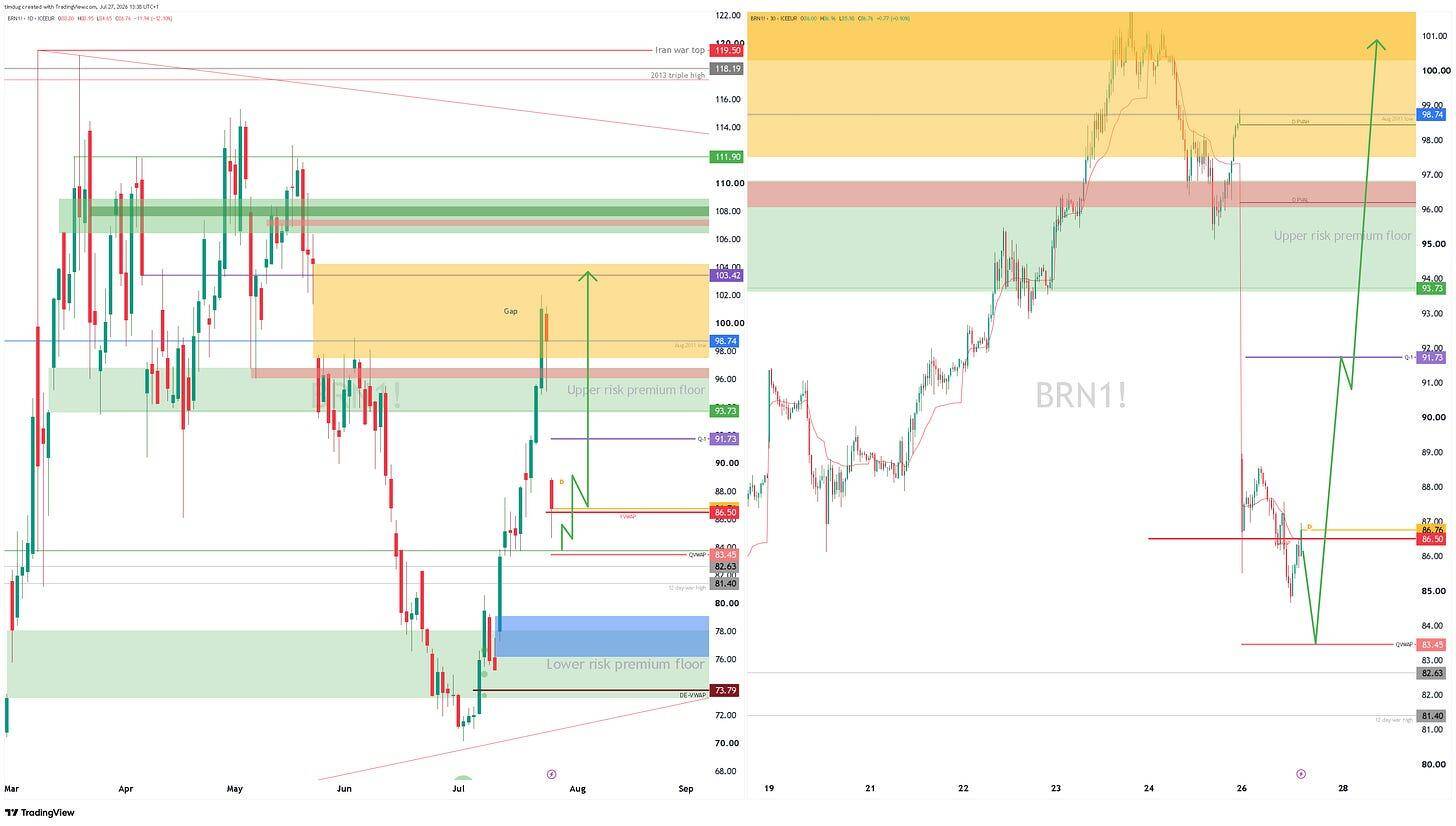
Brent price charts illustrating the author’s downside-pullback scenario and projected recovery path. Source: TradingView.
That’s the report.