



Last week Brent: -11.86% (-$12.36). Open $97.50 High $97.81 Low $89.93 Close $91.89
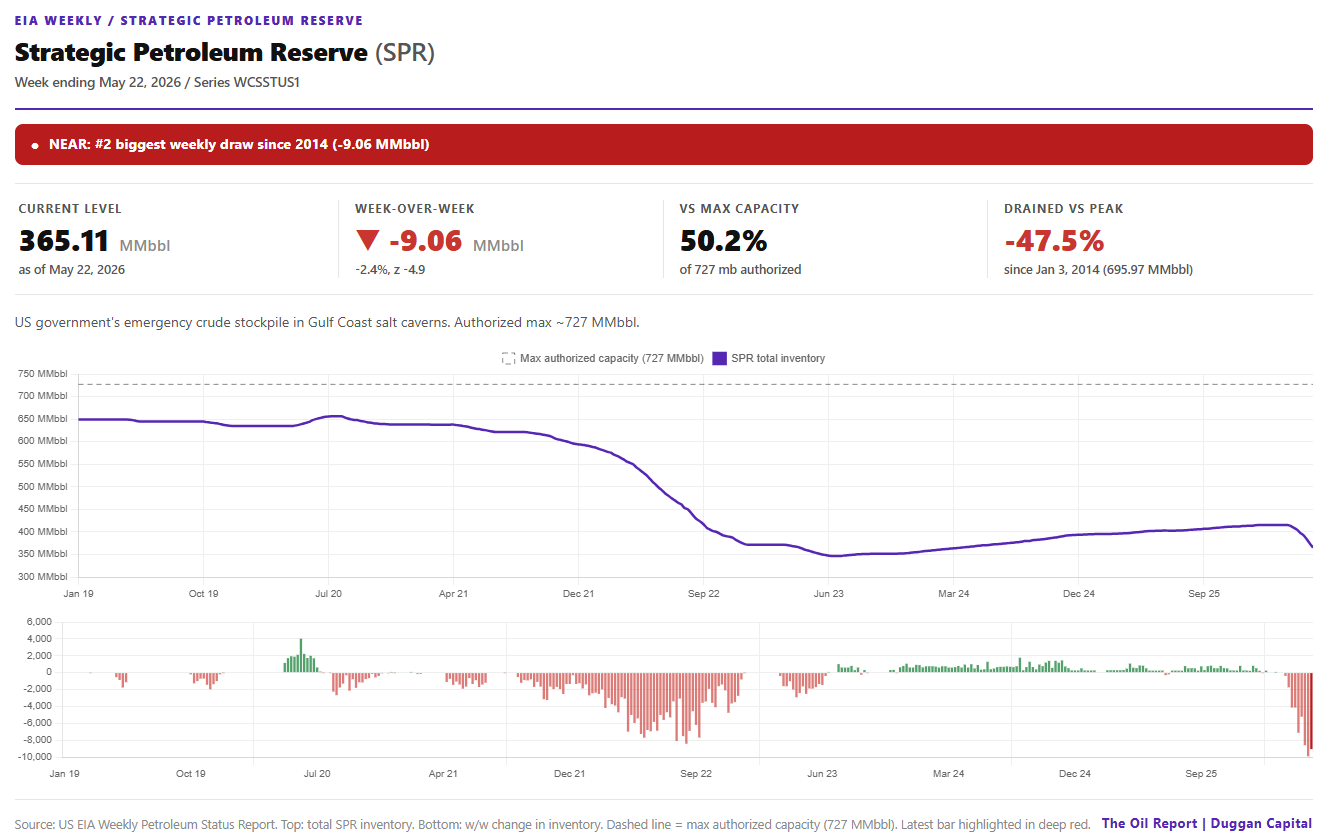
US Strategic Petroleum Reserve: weekly inventory and week-over-week change. The SPR sits at 365.11 MMbbl, 50.2% of authorized capacity, after a 9.06 MMbbl draw. Source: US EIA Weekly Petroleum Status Report.
The War-Market Rhythm Just Broke
We have had a nice rhythm to the market since this war began. The US would talk the market into a softening outlook, then Iran would respond, reversing the entire market read to hard stance negotiations. During this time, the market would sell the rumour of a deal being done, then buy the fact that there is no chance of a deal. This price range was approximately- Brent $93 to $110 average $98.50s. WTI $86 to $105 average $94’s. Last week Brent was down 12.6%.
This week, there has been a large shift in this pattern. And here is why.
In short, 400mb of oil is feeding into the global system, while the comedy act of deal, no deal plays out in the headlines. The US releasing at a clip of 9mb a week now, translating to a rate of 1.3mb per day! Their share of the 400mb is a total release of 172mb.
In the same way you ‘can’t fight The Fed’, you can’t fight the SPR. It is often at times of extreme volatility, that emergency levers are pulled. During those exceptional times, like in COVID-19, while main street talks intensely about the world ending, Wall Street fades the emergency. In the Dot.com and COVID-19 cases, that was QE (quantitative easing- tons of bailout cash). In this case, it is the SPR release that we trade now, not the fear porn and ‘doom window’ story.
The coordinated OECD release of 400mb has acted to cap prices throughout this entire war so far and still is. The chart below highlights when the US portion (172mb) will be completed.
What I am getting at in this report is simple. I think that until we get to the end of the SPR planned releases, prices are going to shake the ground that we think we are walking on. There are risks to buying the next move. More in trade section below.
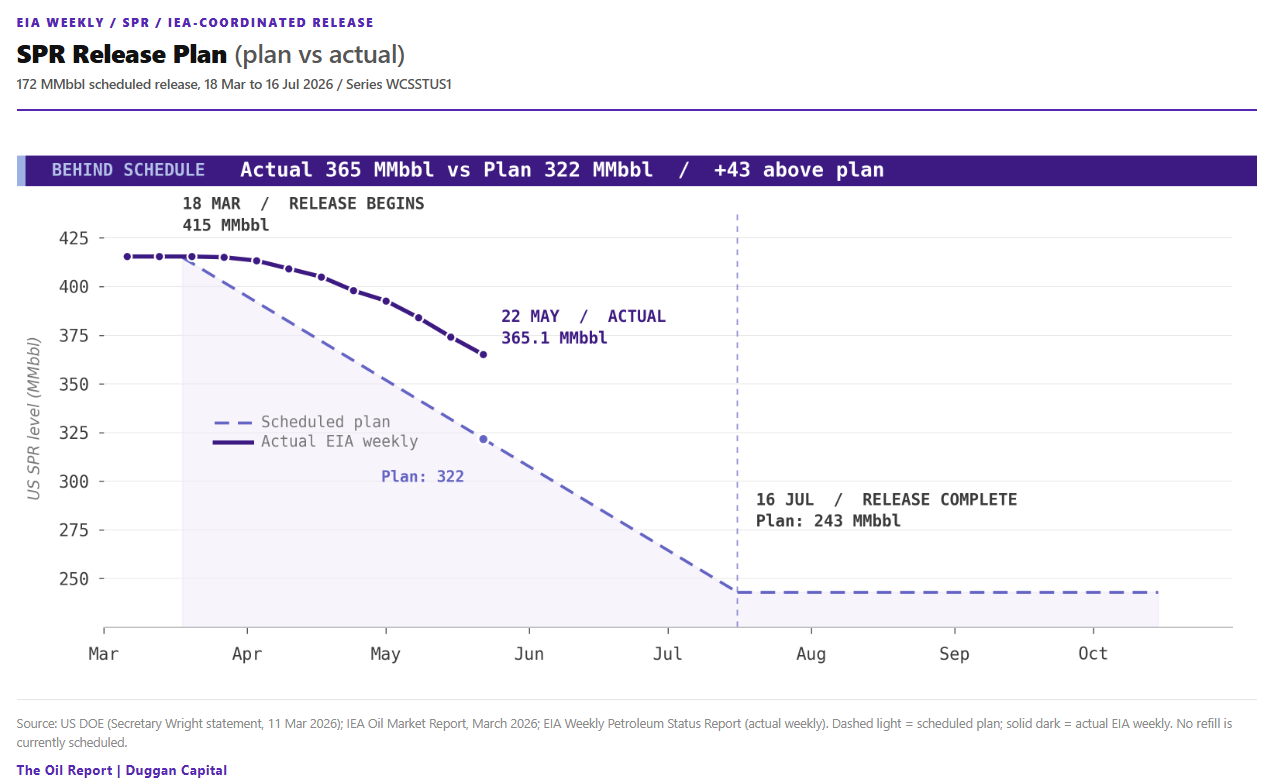
SPR release plan versus actual draw. The US portion (172 MMbbl) runs through 16 July 2026, with actual inventory currently above the planned glidepath. Source: US DOE, IEA Oil Market Report, EIA Weekly Petroleum Status Report.
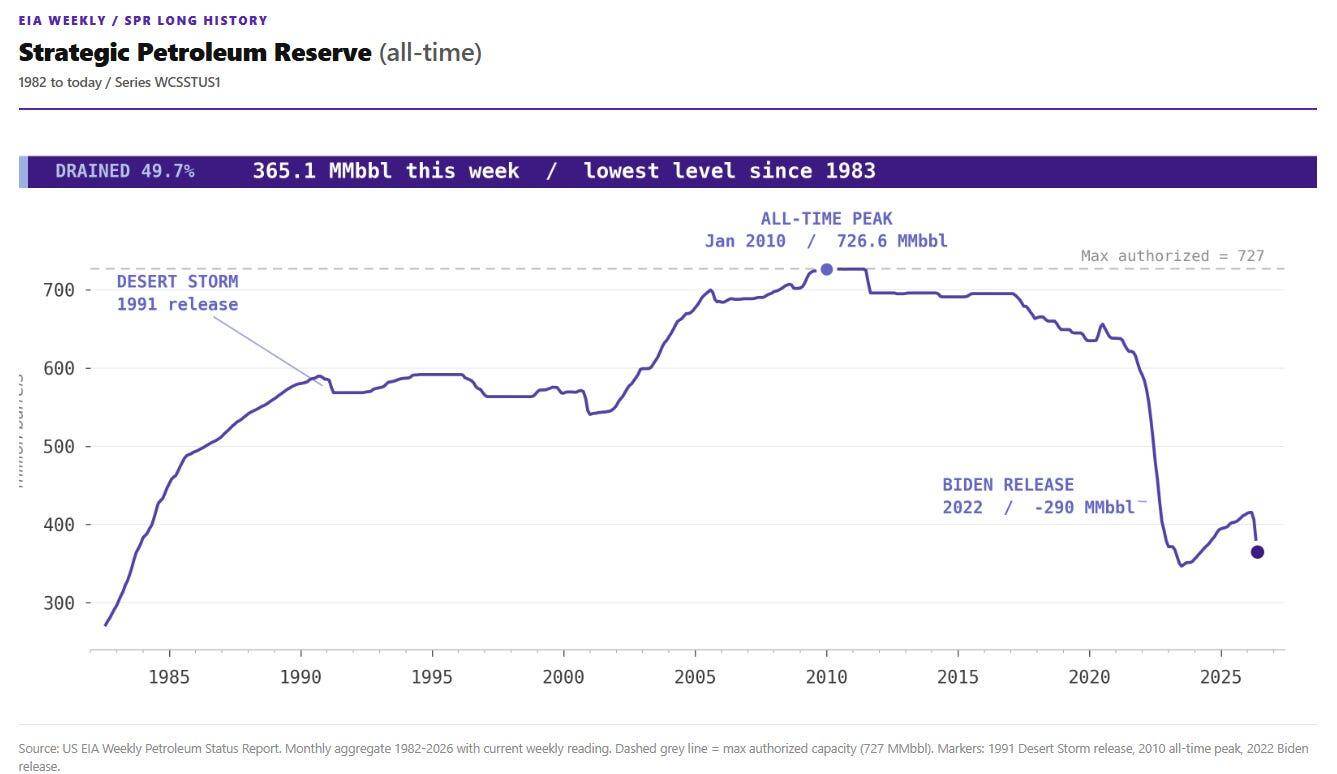
The SPR, while drawing at large levels, will and can survive this. It is still at 50% max capacity.
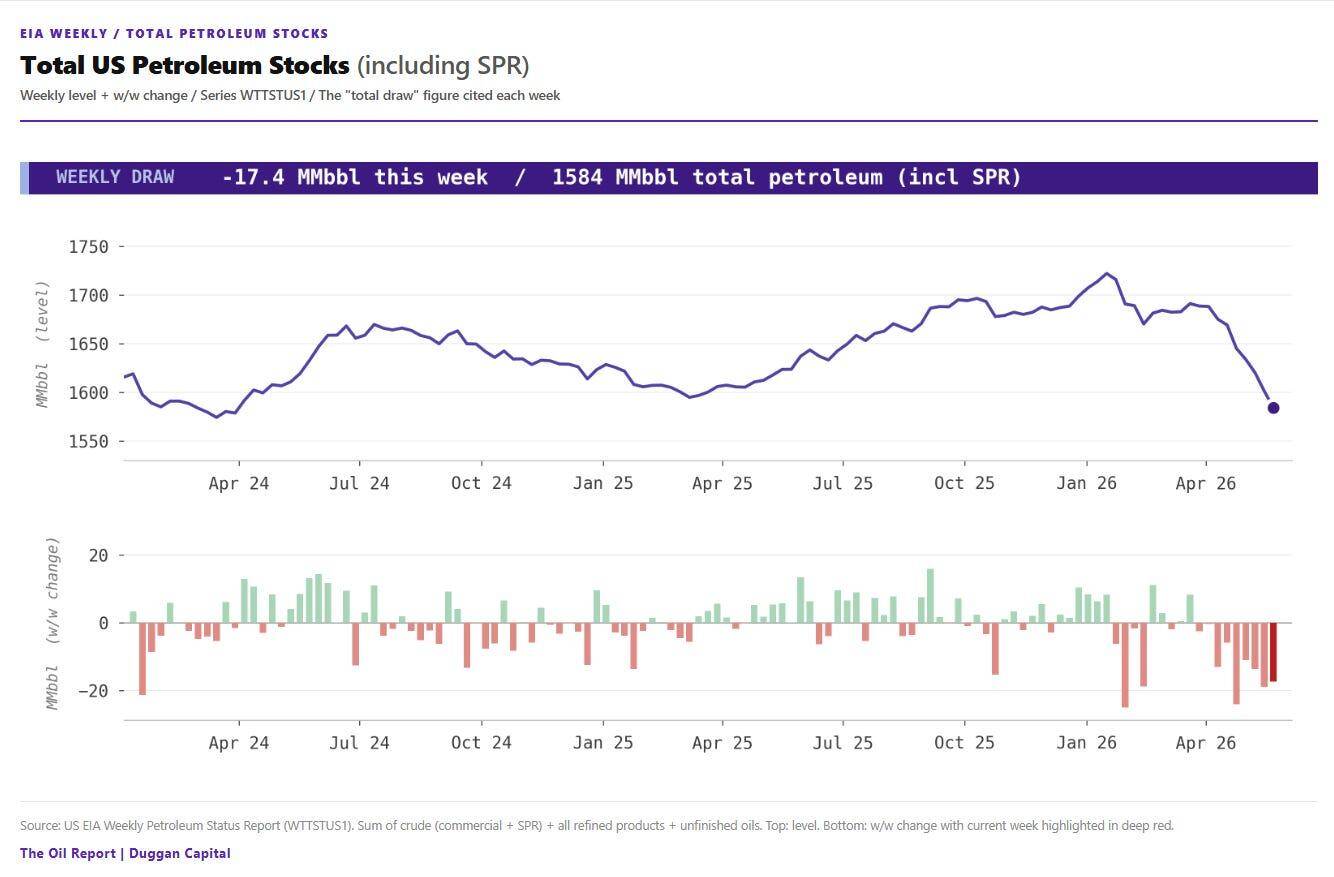
Total US petroleum stocks including the SPR, the headline “total draw” figure cited each week, down 17.4 MMbbl to 1,584 MMbbl. Source: US EIA Weekly Petroleum Status Report.
At the same time, the other acting OECD countries are also releasing. Across all coordinated OECD draws, monthly contributions collapse from 76mb in June to roughly 20mb by August, a three-quarter reduction in the supply that has held this market in range. The releases don’t stop on a single day. It tapers across the summer.
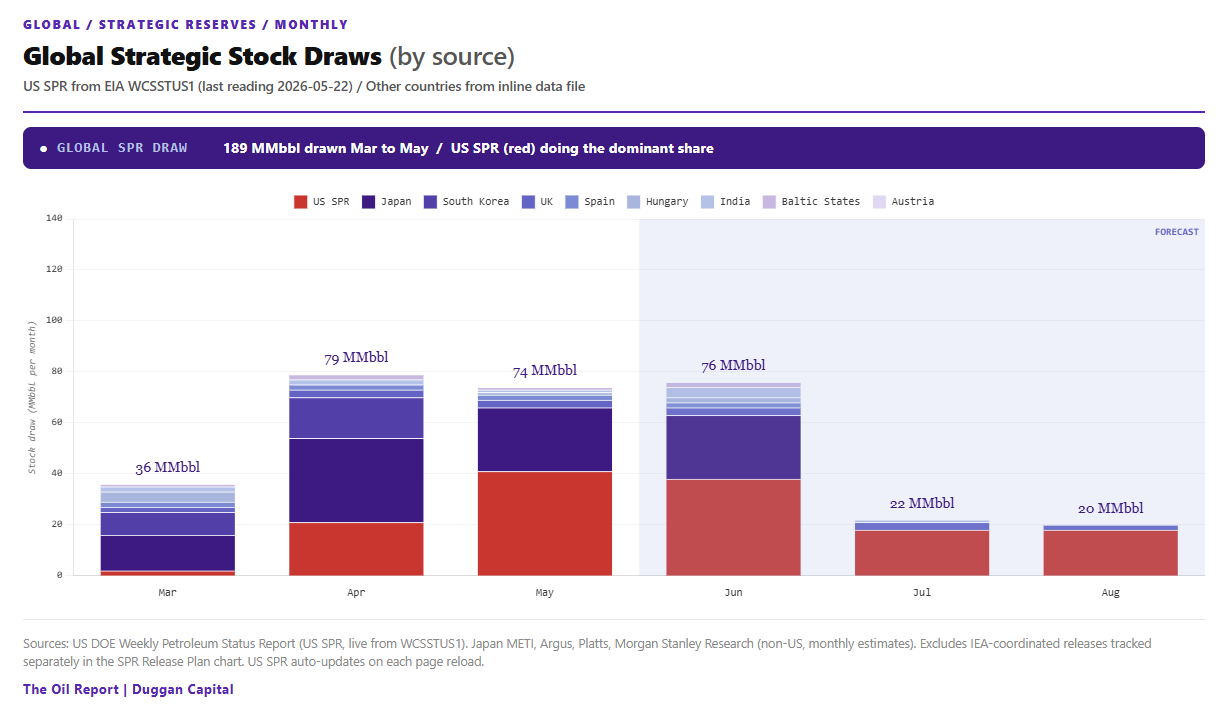
Global strategic stock draws by source. US SPR (red) does the dominant share; combined monthly draws taper from 76 MMbbl in June toward about 20 MMbbl by August. Sources: US DOE, Japan METI, Argus, Platts, Morgan Stanley Research.
Brent Oil Price Forecast
Every new Brent Oil analysis as it publishes, today's technical signal and key levels, live price — on one page.
See all Brent Oil forecastsPolitics in Reverse: The Sanctions Charade
It’s been a hell of a week for negotiations. Starting out Sunday with Trump stating that a deal was about to be done, no- seriously this time. Then an AXIOS dreamscape MOU fiasco mid-week, followed by false comments that US ships were to commence escorting ships through the SOH. Net Net, we are MAYBE going to enter a 60-day window of negotiations. With this, it is touted that traffic will resume while the US and Iran hash it out. Iranian red lines remain firm. Nuclear enrichment, the toll booth, a ceasefire between Israel and Lebanon and the sanctions/release of Iranian funds currently tied up. I don’t see any progress being made here. And I don’t see Iran too enthusiastic about resuming traffic to pre-war levels, ie. giving yards when they don’t have to. It is not over.
The US is now placing sanctions on the shiny new PGSA (Persian Gulf Strait Authority). This will work to hamper the Iranian toll booth, in theory. Sanctioning it creates secondary-sanctions exposure for any tanker owner, P&I club, or bank that transacts with it. The flaw is that PGSA was designed to operate completely outside the USD system. Iran’s immediate response was to reframe the toll as an “environmental tax” delivered via a draft Iran-Oman joint protocol, a non-sanctioned cutout via Muscat. Washington responded by threatening Oman directly. Iranian FM Baqaei called that blackmail of a UN member state. Tehran then published the PGSA map, asserting jurisdiction over a maritime zone that extends deep into the UAE and Omani territorial waters, a planted flag, not a negotiating opening. So until The Whitehouse extends those sanctions to include the myriad of workarounds that can occur, the sanctions will be as useful as the prior sanctions were. Not very.
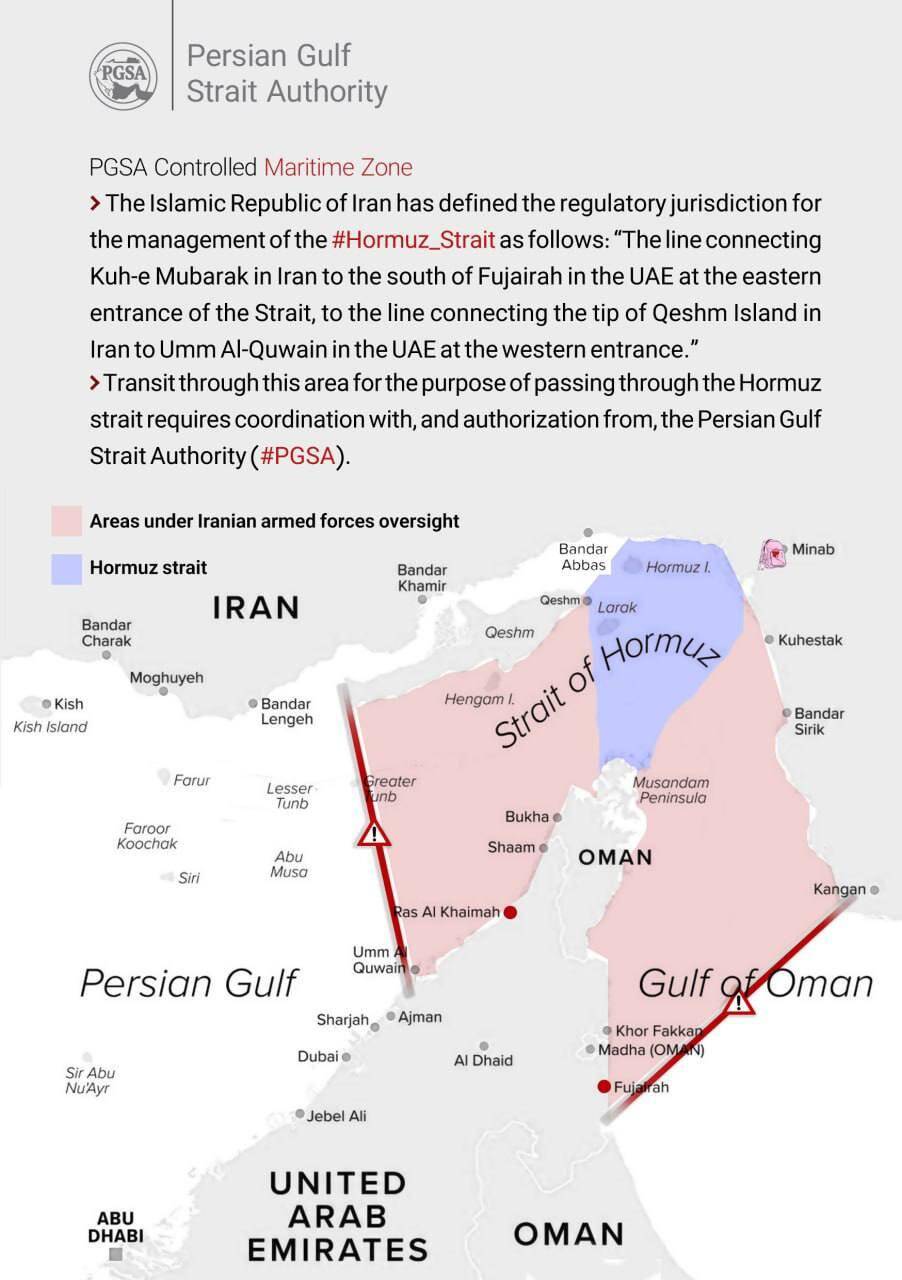
The PGSA map asserting Iranian jurisdiction over a maritime zone in the Strait of Hormuz that reaches into UAE and Omani territorial waters.
Source: Embassy of Iran in Bulgaria
Let’s look at it from an Iranian perspective. Game theory would dictate that they will only actually talk seriously when the US feel the pain. That will be July forward. With this theory, we are in for another 4 weeks of the same from both sides. Deal or no deal.
COT Report: The Longs Abandon Ship
The draw on open interest here is almost a 2 sigma Z. The longs are abandoning ship, and rightly so. You get run over fighting The Fed, and you get run over fighting the US Department of Energy.
The distinct shift came this week when the market took its routine sell down on Trump’s soft comments. However, this time it did not rebound as normal on Iran’s reversal rhetoric. This was reason to be suspicious of buying the usual dip. We now have the evidence that MM shorts increased to the tune of 25%, while cutting longs by 7% additional 25k contracts. Open interest reduced by 270k contracts. Other Reportable Shorts also increased 5% 15k contracts. The profits are being taken on the longs. The longs are puking and shorts pressing.
The probability of a pullback on Brent to as low as $80 just got very real. My personal note to clients on Thursday was to NOT be long this price action. The change in market tone was clear to see. I continue to hold this view through to July 1st. As mentioned below there are alternates to look for buying value further out on the 26 curve.
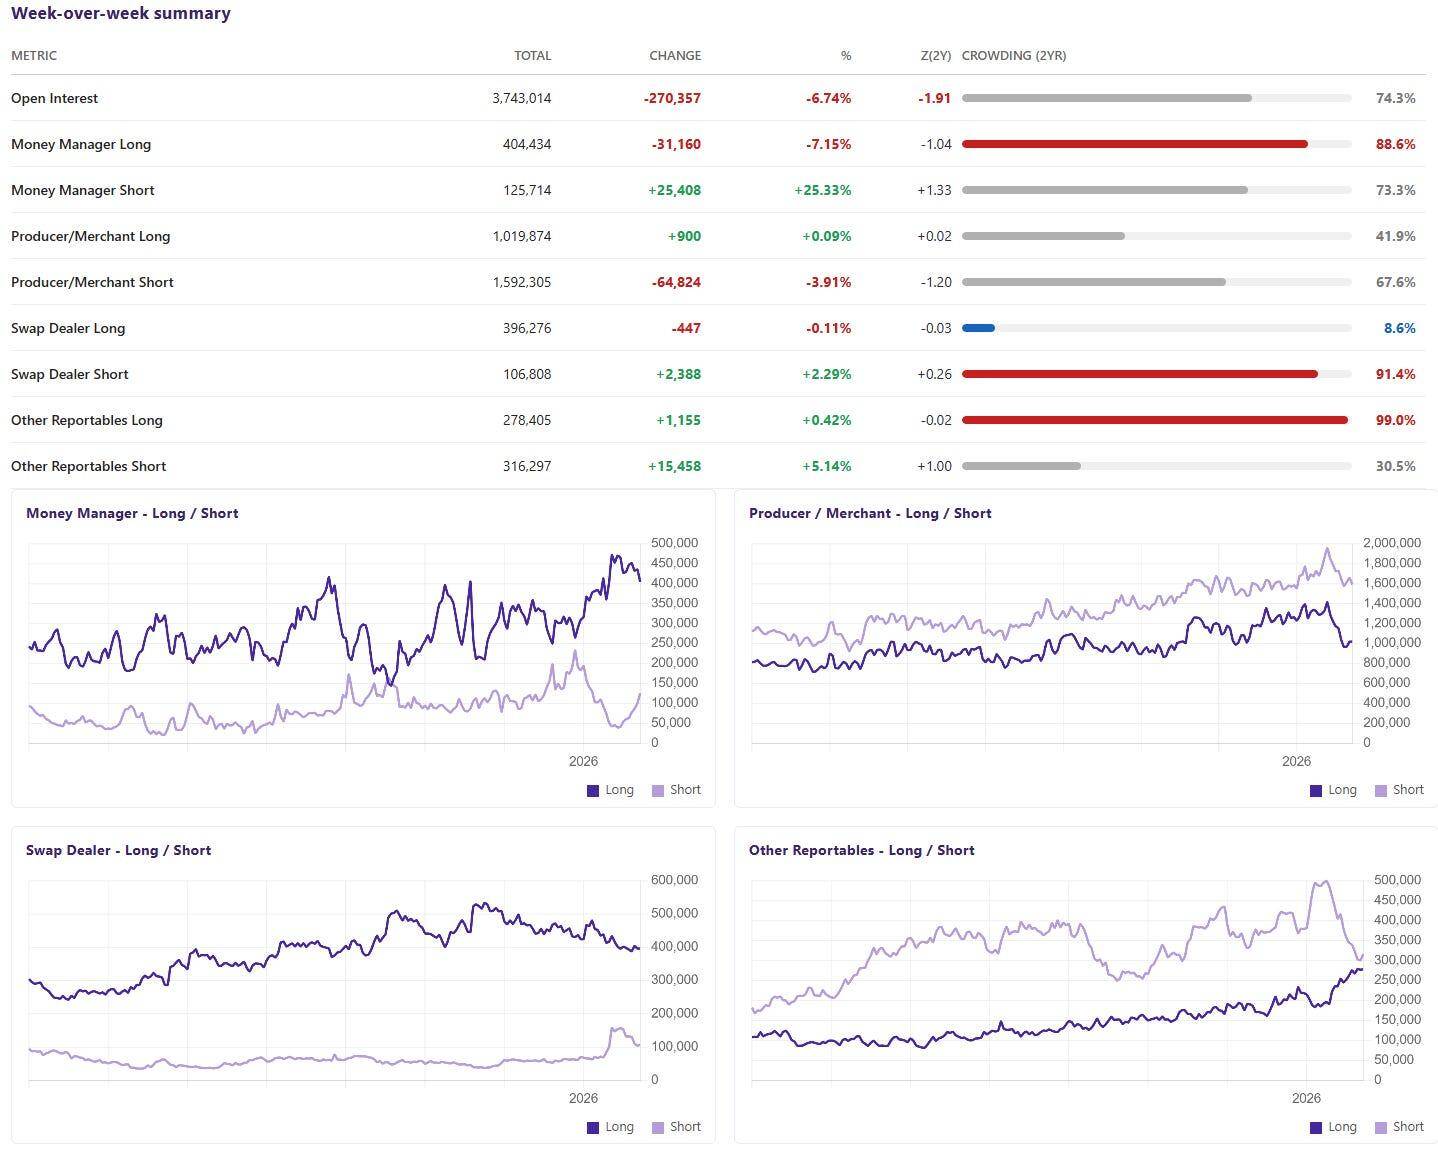
Commitment of Traders week-over-week summary. Open interest fell 270,357 contracts (-6.74%); money managers cut longs 7.15% and added 25.33% to shorts.
The Trade: Short the Release, Long the Recovery
June is going to be messy with downside, then sideways. As mentioned above, I think we print much lower until we get to July 1st. I’m talking $80 brent even. Why? Despite the gravity of the situation, we will be well supplied until then. So I would rather be long September & Dec forward 2026 and 2027 contracts, and be short the July and August 2026. The same way, I would rather be buying calls in June 2020 than puts.
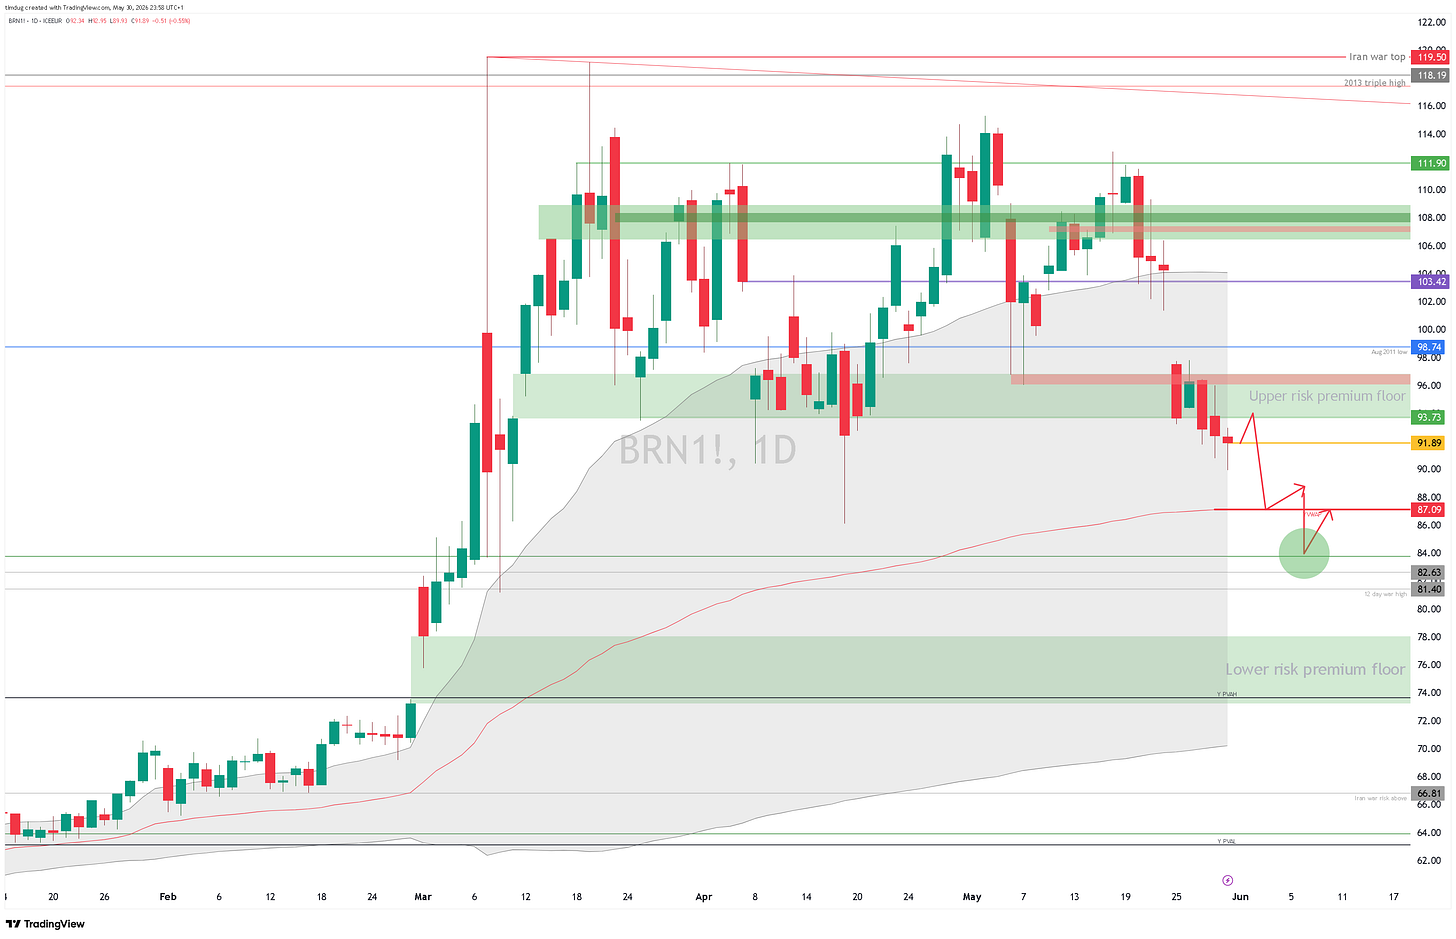
Brent crude (daily). Price holds the upper risk premium floor near 93.73 with a projected pullback toward the 84 to 87 zone. Chart: TradingView.
Be careful on the next dip buying. It is a great trade setup as we cross through expiry on July contracts in about 3 weeks. We are already trading July on Brent.
The Calendar Spread Setup
To look at the spread I talk about above, here is a short July/long September spread on Brent. Up 92% at market from electronic open already. So the trade is there.
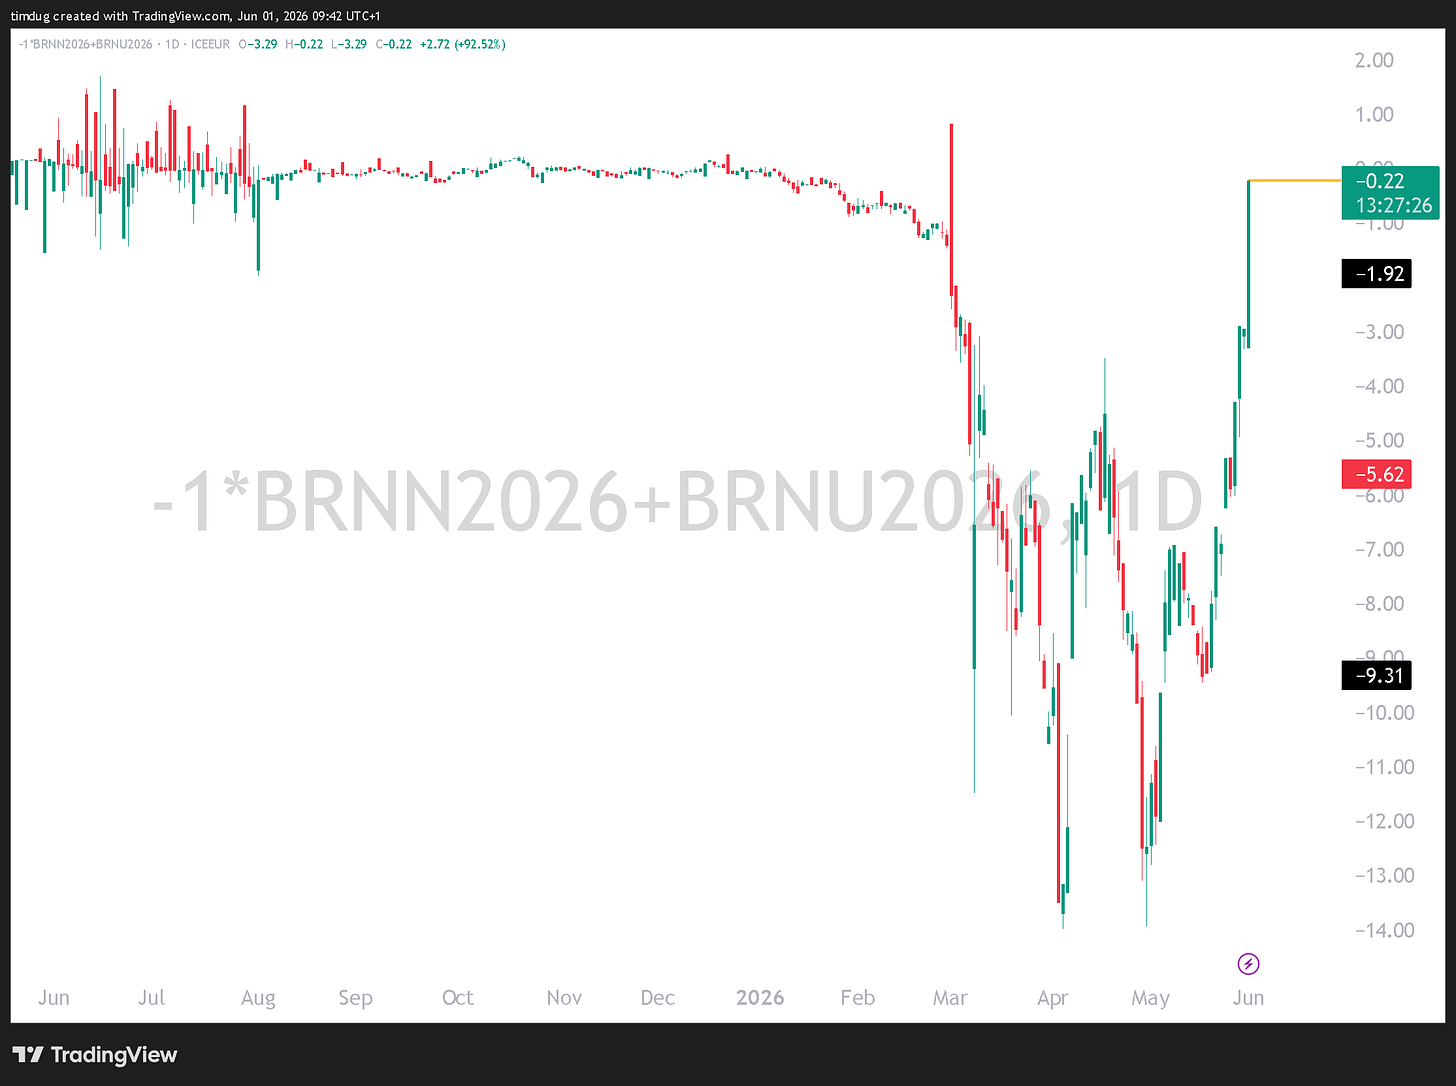
Short July / long September 2026 Brent calendar spread, up 92% at market from the electronic open. Chart: TradingView.
What is this trade expressing? We want to be short the part of the curve that contains the SPR global releases and long the other side. You could pick July or Aug to short, but here Im showing July/Sept.
You could alternatively be long any other serial expiry thereafter. You have to both write and analyse each spread individually and also account for seasonal dynamics. I would recommend Dec being a great one of even F27 ie. Jan 2027. Hell, you could even go much further out, but we won’t complicate it today.
So again, the chart below is -1 short July and +1 Long September. This is what we call equal weighting ie. short 1, long 1. or 1:1. Below is the 30yr look back pattern onthat specific spread. The hard left of the chart is June 1st. So the seasonal expectation is that there is a first day bid rally that gets sold down for the following 5 days approx. Then a nice rally there after for about 3 weeks.
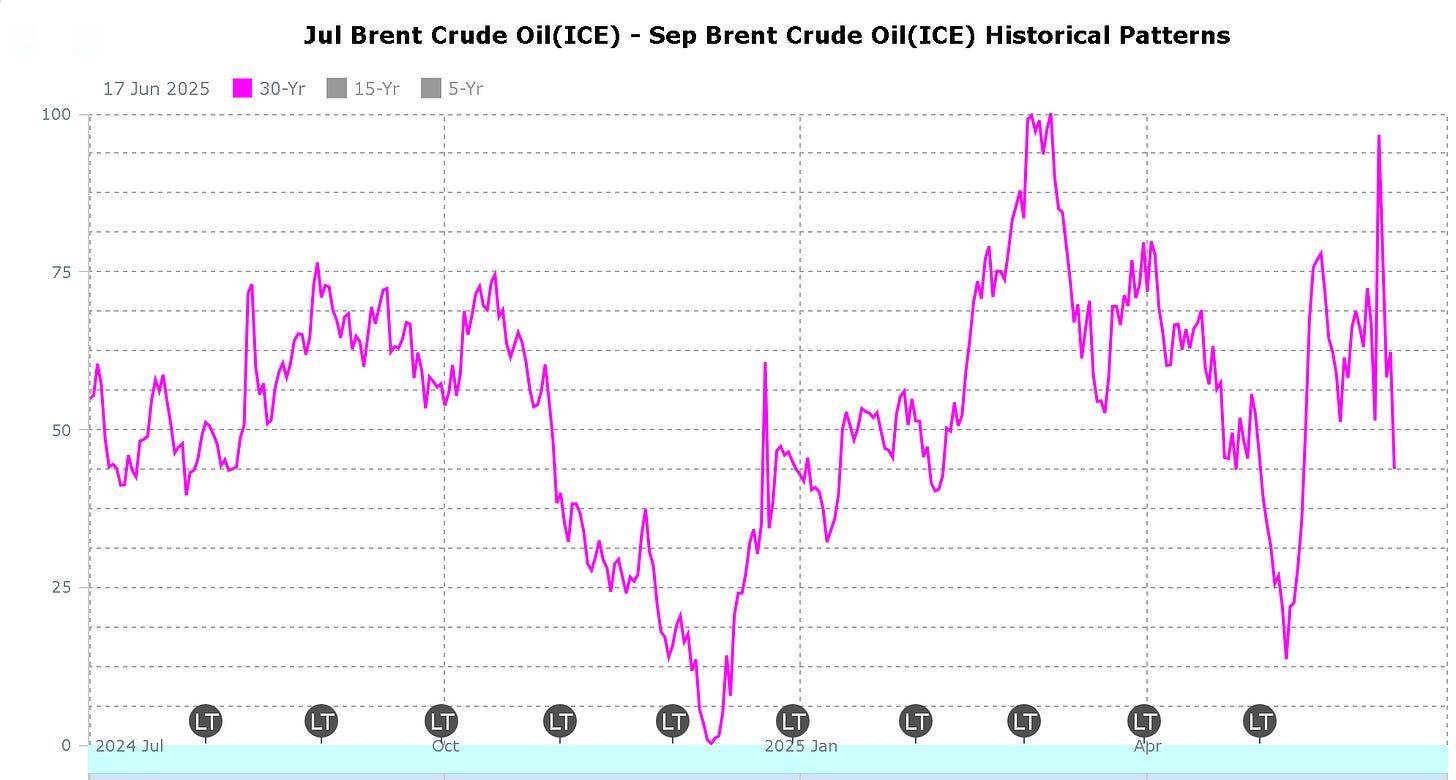
July versus September Brent spread, 30-year seasonal pattern. The hard left edge is 1 June: a first-day bid that sells down for about five days, then a roughly three-week rally.
From a trade management perspective, you obviously want to be buying these spreads low. I’m not going to have a chance to go into trading cal spread dynamics. I only do this for private clients. But the one important thing here is that you can simply let your short leg roll off on this and remain long the back leg of your spread once July rolls off around 23rd June. ie. Close out your short July on final trading day and leave the September long until final trading day around 23rd Aug.
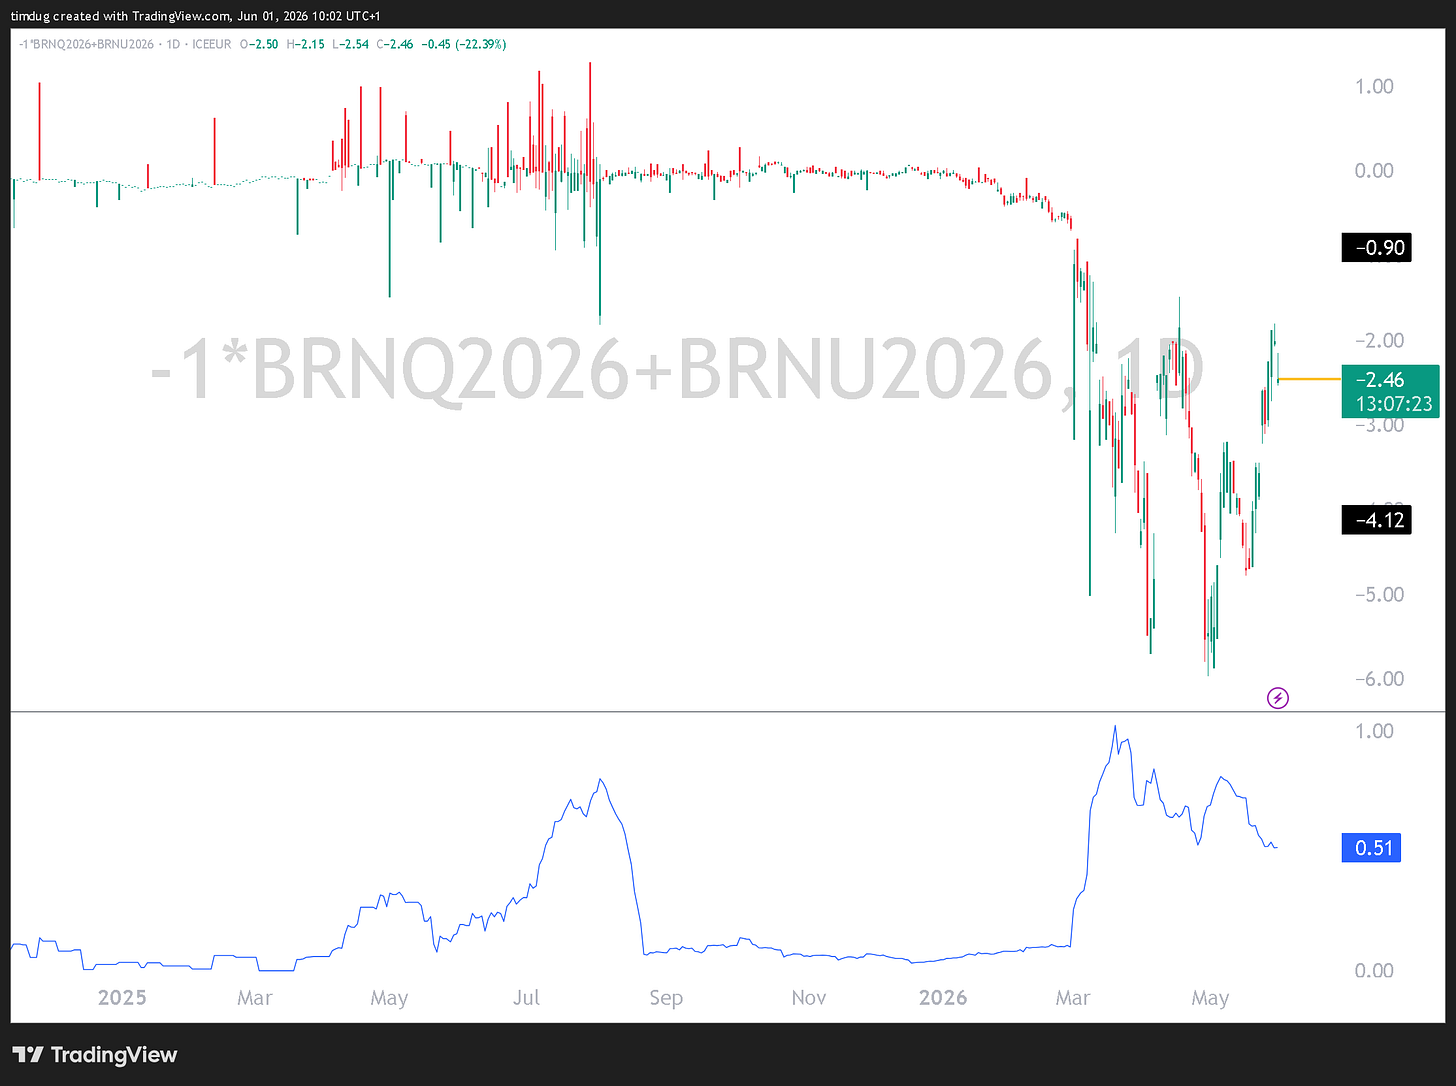
Short August / long September 2026 Brent spread, with average daily range in blue. Chart: TradingView.
Short 1 Aug 2026 Long 1 September 2026. ADR in blue.
A more aggressive trade on this cal thesis, is selling July 2026 and going overweight long Jan 2027 1:2. So Short 1*July Long 2* Jan 2027. This is what that spread currently looks like. The ATR on this spread is a mile wide $1.53. This dictates the number of contracts on my book I can trade. To trade more volume, you want a lower ADR. See Value At Risk (VAR) Models MIT paper.
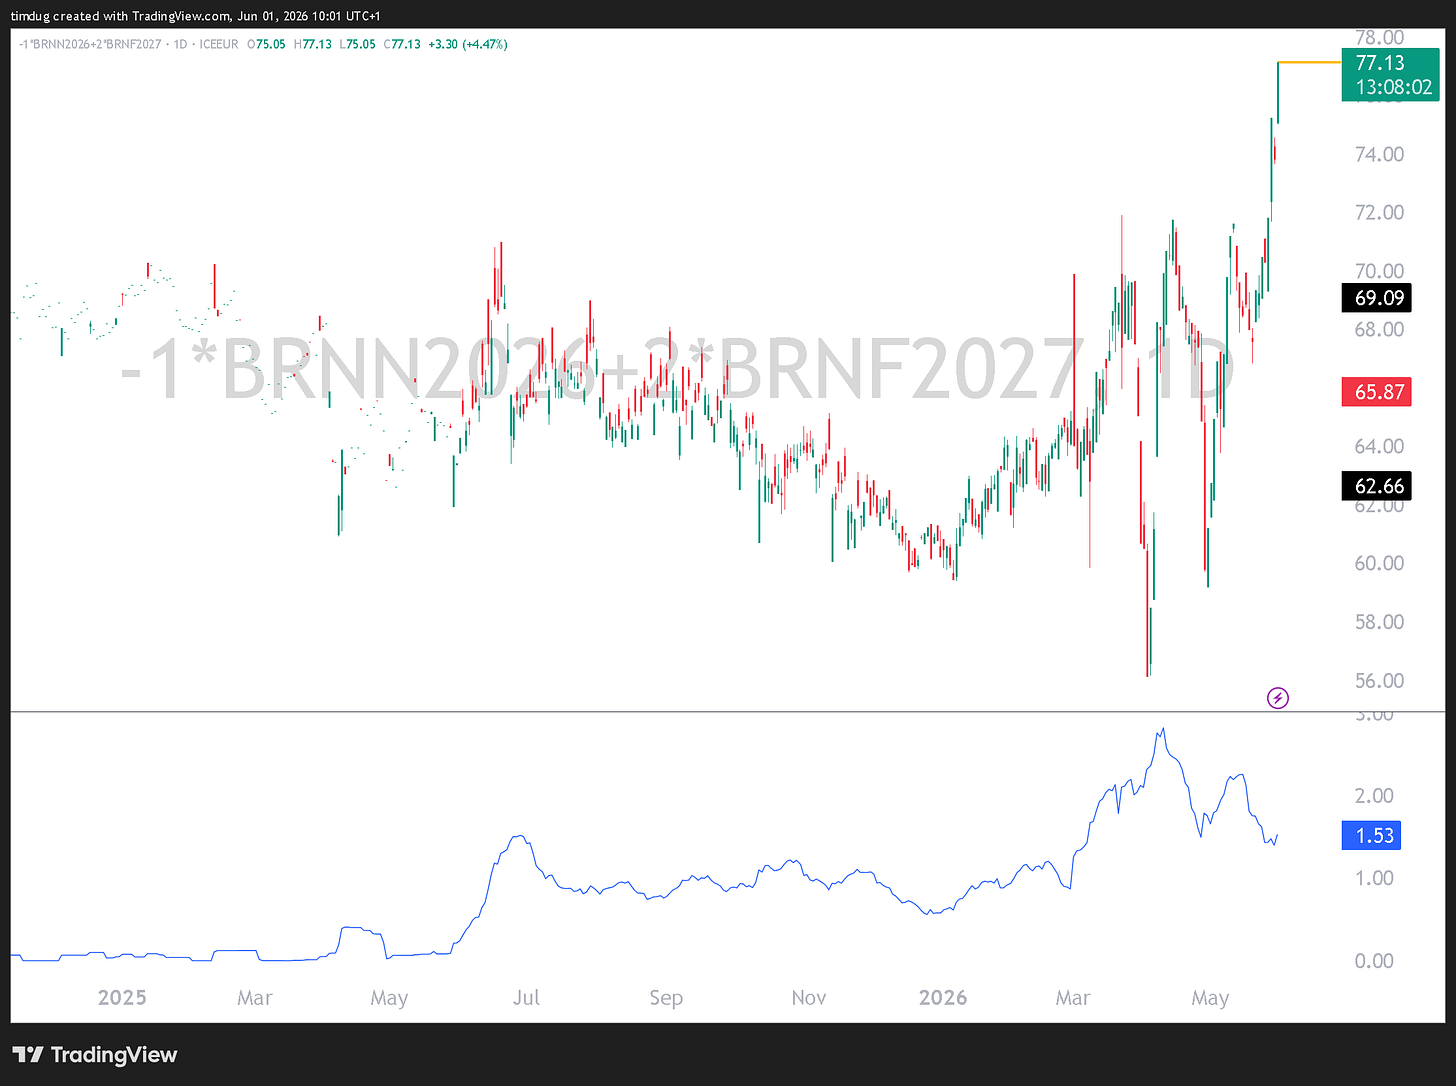
The aggressive 1:2 version: short July 2026, long two January 2027 Brent contracts, with ATR in blue at a wide $1.53. Chart: TradingView.
I highly recommend that if you are not familiar with calendar spreads that you DO NOT experiment with live cash on these. In short, there is a ton of inverse thinking involved and a lot of seasonal understanding. They can be just as volatile as the outright front month contracts. If you are interested in learning more, send me a message.
What can wreck this these trades? If the OECD or any large producing member state announces a new SPR injection through this period (now through July 14th), it could make sure a very bumpy ride back up! Nonetheless, it is a net bull factor, where these nations will have to refill the tanks – if they can get the fluid! Trouble is, its tight out there. So there’s a minimal risk of this.