



Gold (XAU) prices remain volatile after the release of the inflation data as rising energy costs and strong producer inflation create fresh concerns about the inflation outlook. The surge in oil and diesel prices may keep the Fed hawkish and support Treasury yields. This may create pressure on gold in the short term. In my view, gold could test $4,160 or lower if oil prices continue to rise. But the demand from central banks and higher public debt still support the bullish outlook in the long term. This article outlines the key economic drivers and technical levels that could determine the next move in gold.
Gold Price Outlook: Inflation Keeps Fed Rate Risks Elevated
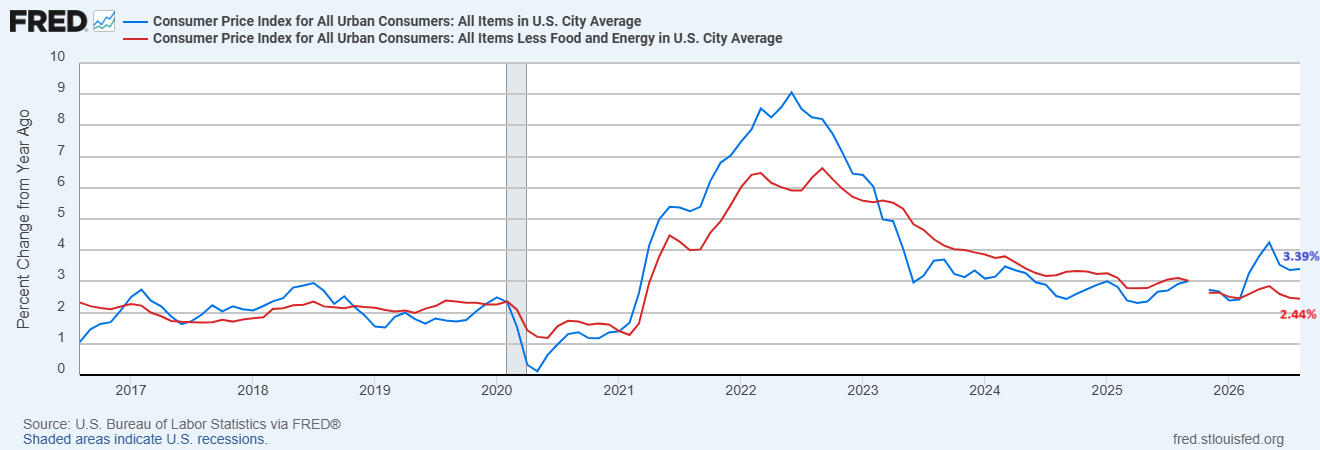
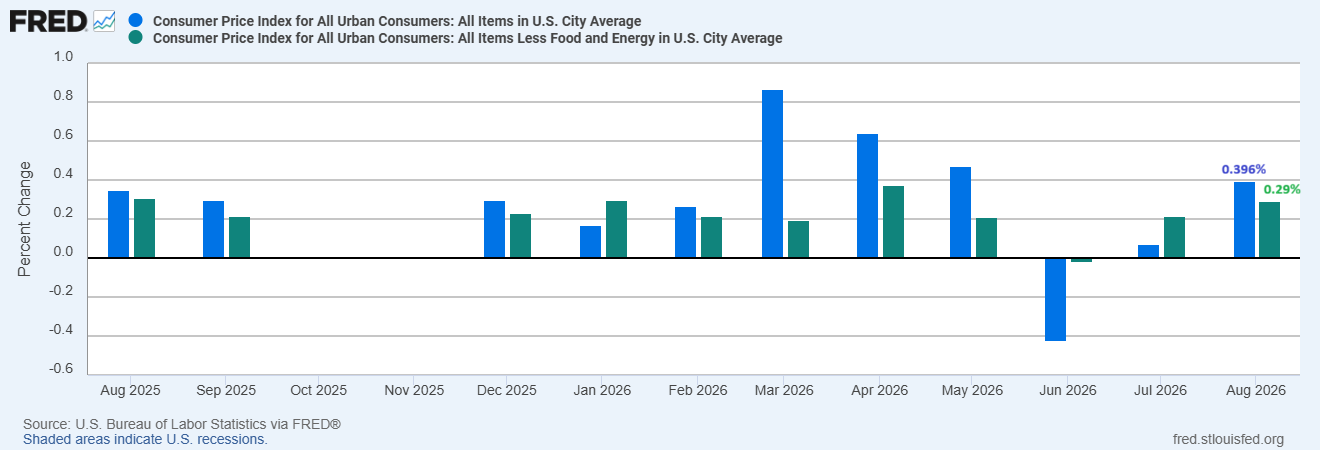
The headline CPI in the U.S. remained unchanged in August at the annual rate of 3.4%. But the core CPI eased from 2.5% to 2.4%. The monthly numbers were not so encouraging.
The chart below shows that the headline CPI rose 0.4% while core CPI increased 0.3%. The data suggest that market pressures remain. The annual rate for the core measure of inflation is lower but the data suggest that inflation could be harder to control.
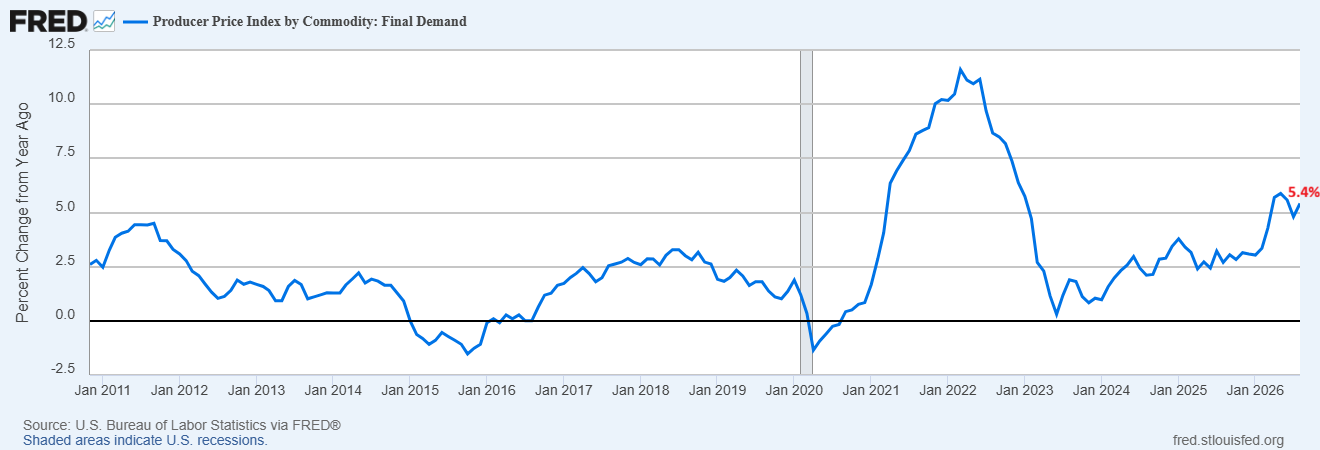
Producer prices present strong warnings. The chart below shows that the PPI for final demand advanced 5.4% during the past 12 months to August.
The producer prices for finished goods rose 6.6% and services PPI grew 4.5%. These pressures were due to energy. Final demand energy prices increased 4.2% in August, with diesel fuel increasing 24.1%.
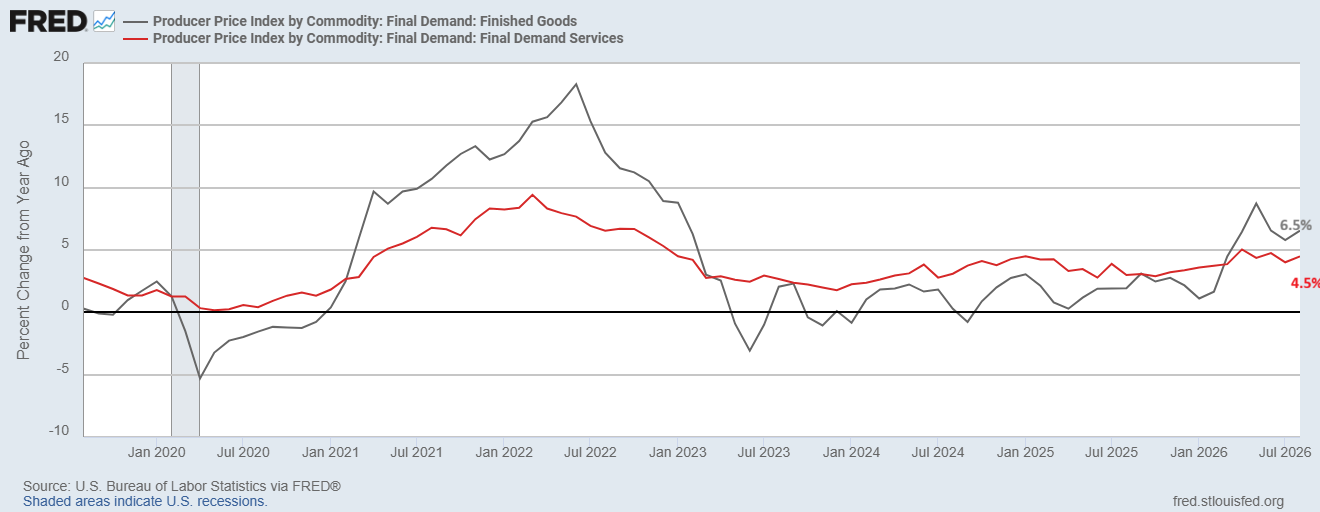
Companies may absorb some of these costs. But sustained increases in prices may squeeze margins and encourage businesses to raise prices. The BLS producer price data shows that this pressure is spreading through the supply chain.
The ISM services prices index further supports this situation. The chart below shows that the services price index increased to 72.6% in August. This was the highest reading since July 2022.
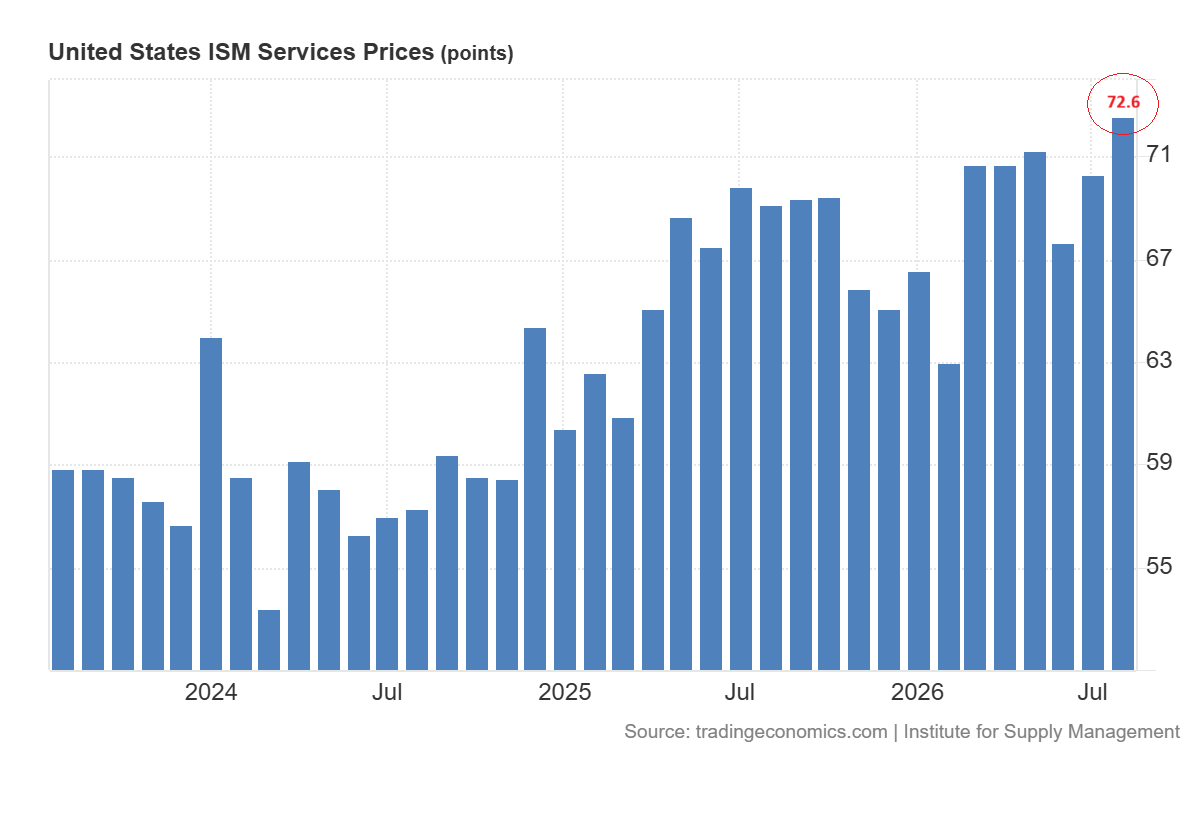
The service prices lead consumer inflation by several months as businesses pass higher labor, transport and operating costs to customers. This divergence between ISM services prices and CPI suggests that inflation might be higher in the near future.
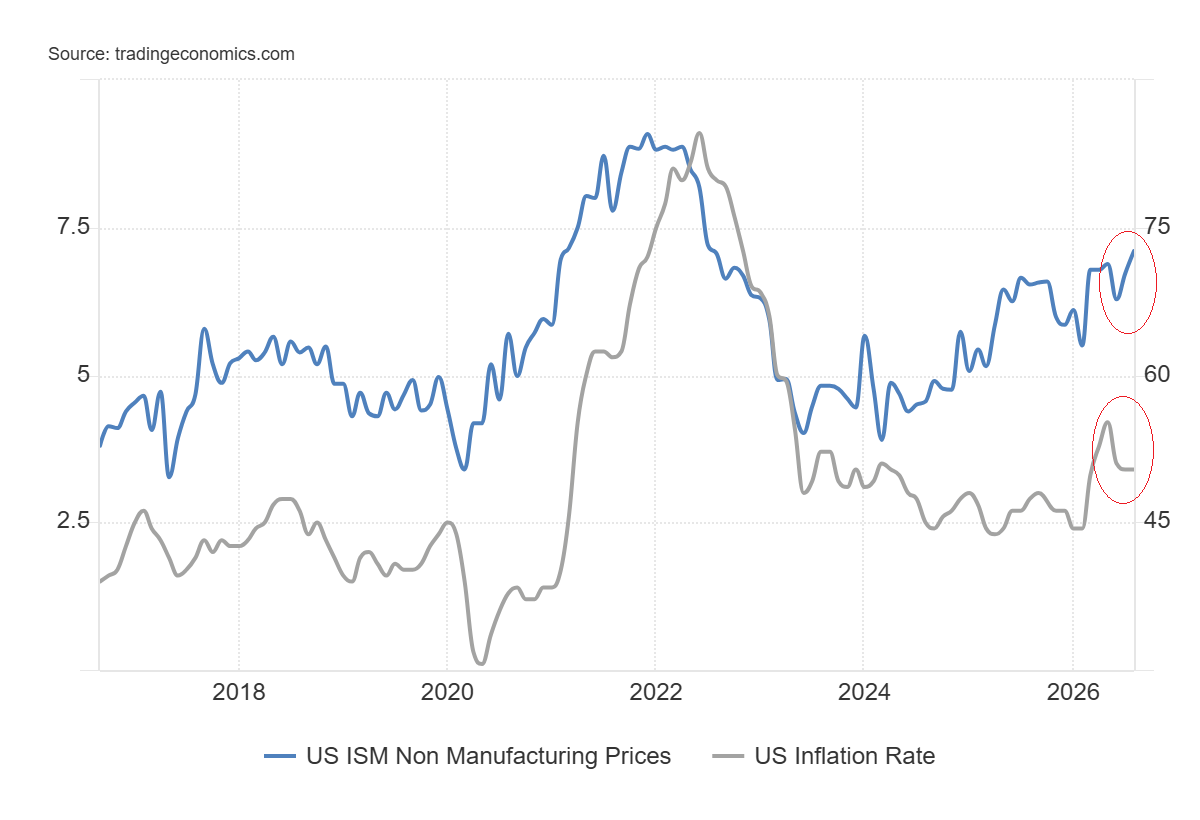
This situation creates difficult environment for gold in the short term. A stronger inflation outlook may force the Fed to maintain hawkish policy that may create pressure on gold prices in the short term. The 10-year Treasury yield reached near 5%. The higher yields can limit the rebound in gold and pressure prices toward the $4,000 area.
Gold Price Forecast
Every new Gold analysis as it publishes, today's technical signal and key levels, live price — on one page.
See all Gold forecastsOil Above $100 and Record Diesel Prices Fuel Inflation
Energy has become the main source of the latest surge in inflation. The energy CPI increased in August. Gasoline prices increased over 3% during the month and caused more than one-third of the headline CPI gain.
This trend continued in 2022 when energy inflation jumped following Russia’s invasion of Ukraine and headline CPI reached 9.1%. That magnitude of shock might not happen again but it shows how quickly an increase in energy prices can ripple through the economy.
The chart below shows that diesel and gas prices have risen dramatically in August.
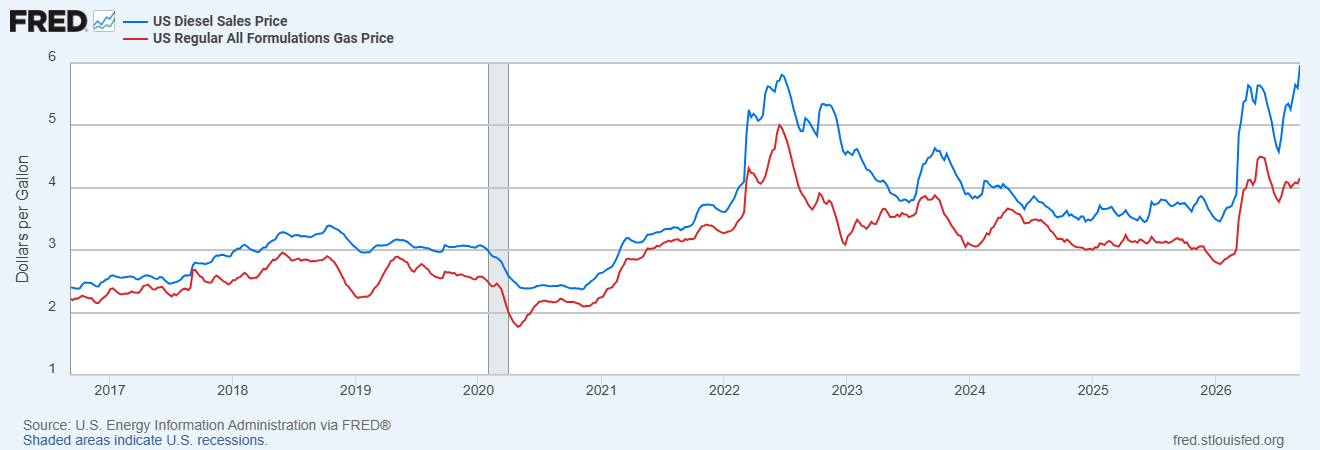
Meanwhile, GasBuddy’s daily measure nationwide passed the $6 mark for the first time. The inventories of diesel were 106.3 million barrels, 13% below the 5-year average. Trucks, farm equipment, ships and heavy equipment are powered by diesel. So the increase will affect more than fuel costs. It will be an additional expense for food, delivery, construction and manufactured products. The refining margin for diesel also hit a record.
Brent crude oil reached $110 last week but dropped strongly on Friday to close the week near $106. The outlook still remains positive and the next move in oil prices depends on the supply situation in the Middle East.
The potential for ongoing recovery in the Middle East combined with potential Russian refining disruptions may help to keep markets for both crude and distillate tight.
If Brent oil remains above $100, the market may face another inflation boost. That may help drive up US Treasury yields and weigh on gold in the short term. But a significant supply disruption could also provide a safe haven bid for the metal.
Central Bank Buying and Debt Risks Support Gold’s Long-Term Outlook
The long term outlook for gold still remains bullish. The IMF projects that the global public debt should amount to 100% of GDP by 2029, with the growth coming from major economies. High debt levels and rising interest expenses could lead to less confidence in government finances.
Meanwhile, central banks bought 289 tonnes of gold in the second quarter, up 62% from the year earlier. The demand also remains strong in China from official and private sources.
In my view, gold has the potential to drop in the short term near $4,000 if prices fail to break above $4,530. But the fiscal risks and strong demand from central banks may support prices in the long term.
Gold Technical Analysis: $4,270 Support and $4,530 Resistance
The daily chart for spot gold shows that the price has been consolidating between the 50-day and 200-day SMAs. These SMAs lie between $4,270 and $4,530. A break of either level will likely define the next move.
A break below $4,270 will push the gold price toward $4,160. But a break above $4,530 will push the price toward $4,800. The price has been trading within an ascending broadening wedge pattern that stretches from the December 2024 lows.
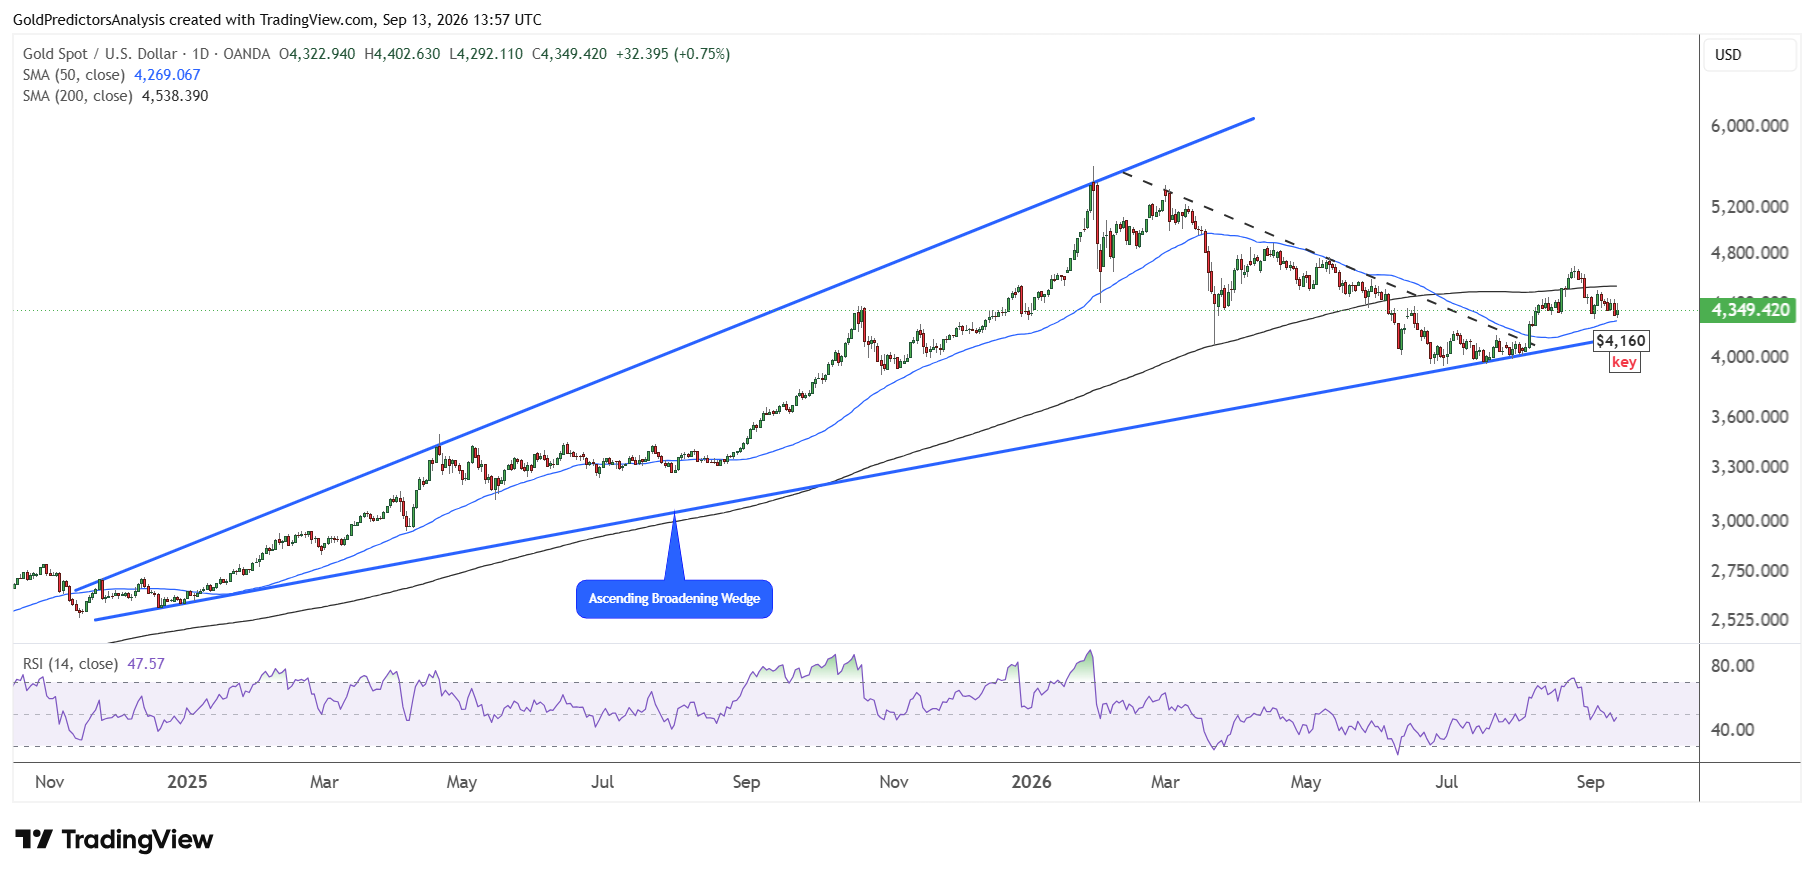
As long as the $4,160 level holds, the possibility of strong gold prices over the next few months remains high. But a break below $4,160 will increase the possibility of a downside breakdown below the $4,000 level.
A confirmed break below $4,000 will likely push gold price deeper into the support zone of $3,500 to $3,700. The RSI remains below the midline, which maintains pressure in the short term and increases the chance of decline toward $4,160. But if the price recovers strongly above the 200-day SMA, it will likely negate the downside risk in gold.
Bottom Line
Gold may remain under pressure in the short term as the risk of inflation increases. Higher energy and producer costs could keep the Fed hawkish. This may support Treasury yields and limit demand for gold in the short term. If Brent remains above $100, the inflation concerns could increase further. This situation may push gold toward $4,160 and possibly the $4,000 support level.
The technical outlook for gold depends on the $4,160 support and the $4,530 resistance. A break below $4,160 would increase the risk of deeper drop below $4,000. But a break above $4,530 could open the way toward $4,800. In my view, the gold outlook remains bullish in the long term because rising public debt and strong central bank demand continue to support gold.