



Gold (XAU) rebounded from the $4,000 support area last week as the U.S. dollar weakened and inflation pressures remain high. In my view, this rebound keeps the short term bullish setup alive but gold still needs to break above the key level to confirm the next rally phase. This article examines the PPI inflation shock, the oil supply risk, the dollar weakness and the key levels to determine the next move in gold
PPI Inflation and Oil Supply Shock Keep Gold Supported
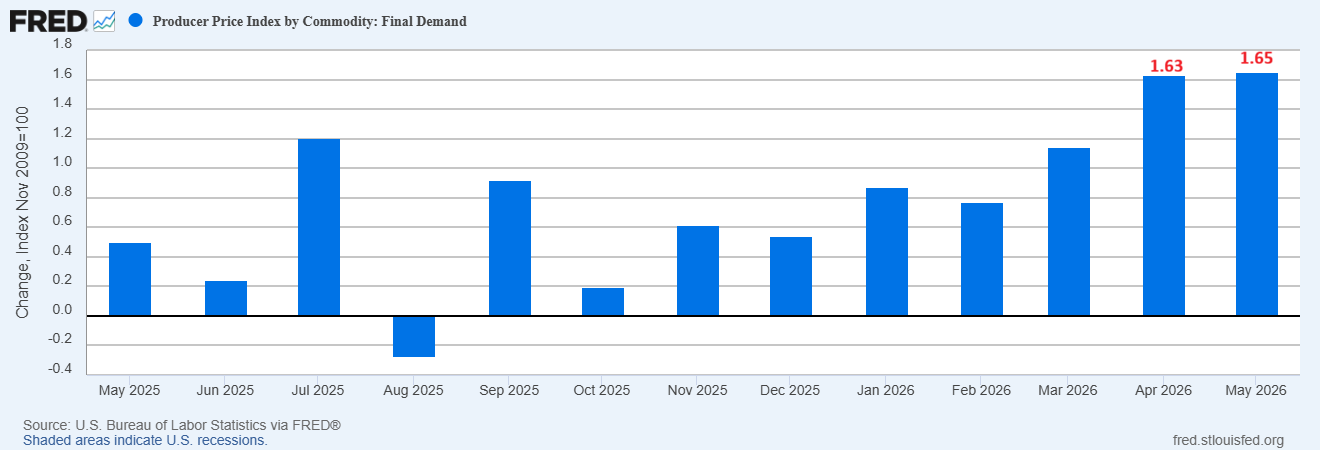
The inflation pressure remains the primary driver for gold. The chart below shows that the monthly producer price index increased in May at the same rate as in April. This increase in PPI in May equates to 12.7% annualized rate that is too high for the Fed to overlook.
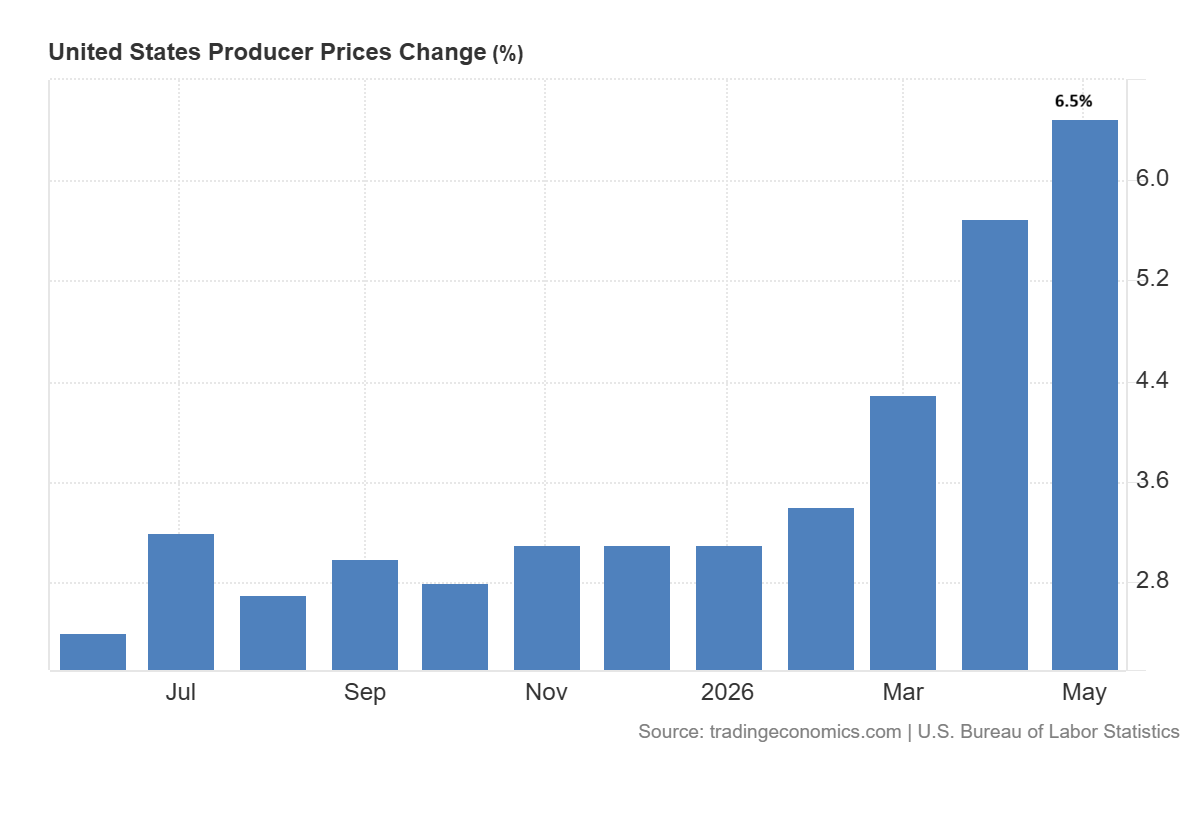
The producer price inflation surged for the fourth consecutive month to 6.5% in May 2026.
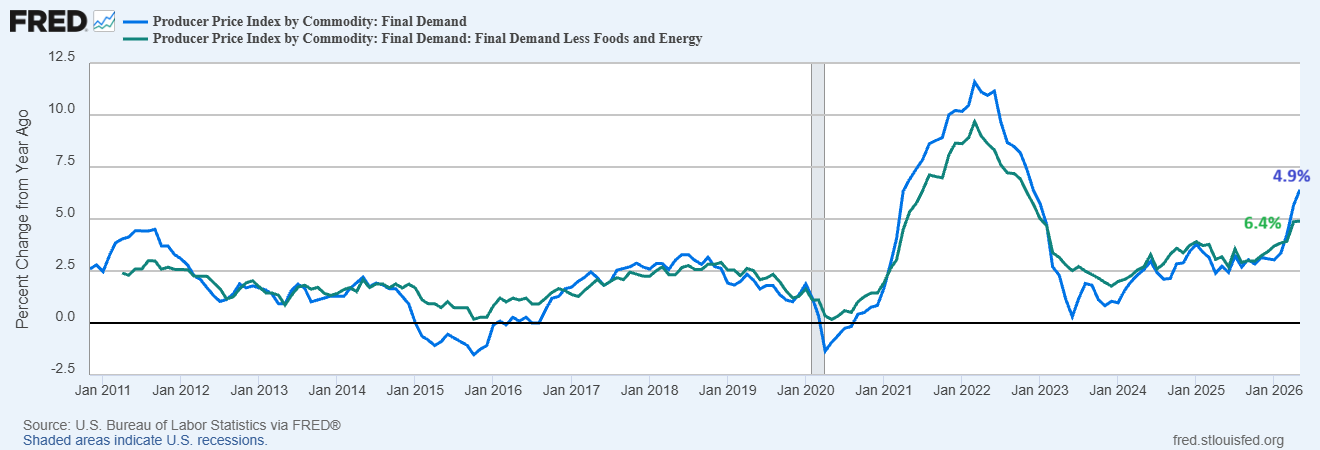
But the core PPI remained steady at 4.9% in May.
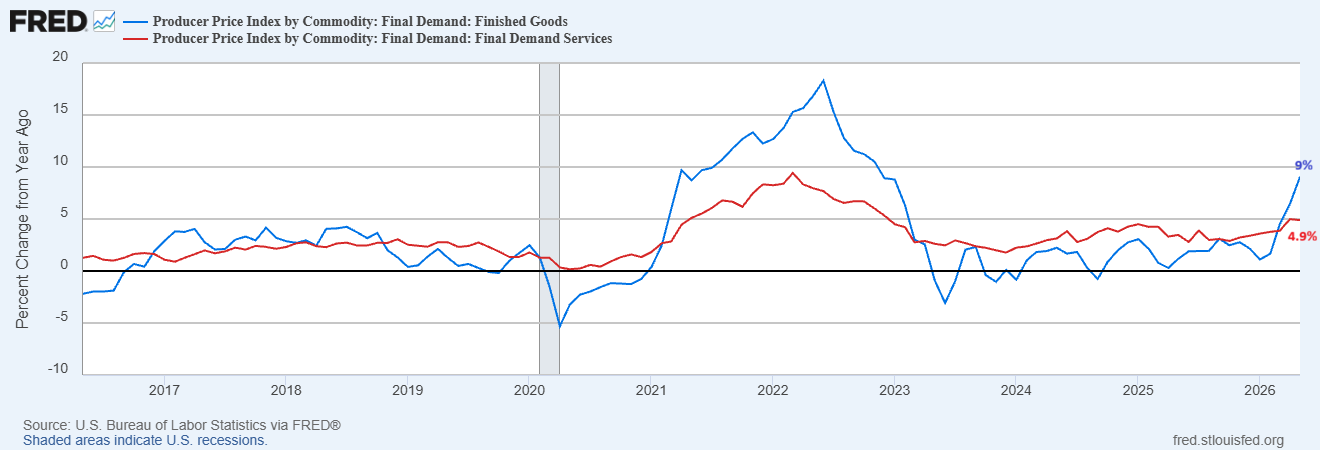
The biggest worry comes from the finished goods prices. The chart below confirms that the finished goods PPI jumped to 9.1% over the 12 months to May. This indicates a price pressure going deeper into the economy. On the othe hand, the services PPI dropped slightly to 4.9%, but that does not take away the overhang of inflation risk. The main difficulty remains good’s inflation as energy and transport costs continue to work their way through the supply chains.
This pressure continues due to the shortage of crude oil. The Strait of Hormuz has been closed for three and a half months and the strategic reserves are depleted. This is important for gold as it increases the inflation expectations that correlate with rising oil prices.
These inflation expectations affect the ability of the central banks to control prices without hurting growth. This makes gold an attractive commodity for people seeking to hedge against inflation and find a safe haven.
The market has grown optimistic after hopes of a deal between the U.S. and Iran. This has weakened the dollar and supported US stocks and gold. This rebound in the gold price indicates that the investors expect the reopening of the Strait of Hormuz and restoration of the crude oil supply. This may help ease inflation worries and the need for higher interest rates. But this optimism might be ahead of what is actually developing in markets. The restoration of oil supplies globally may take months to rebuild the Gulf state’s finances.
Gold Price Forecast
Every new Gold analysis as it publishes, today's technical signal and key levels, live price — on one page.
See all Gold forecastsDollar Weakness and Easy Liquidity Support Gold Rebound
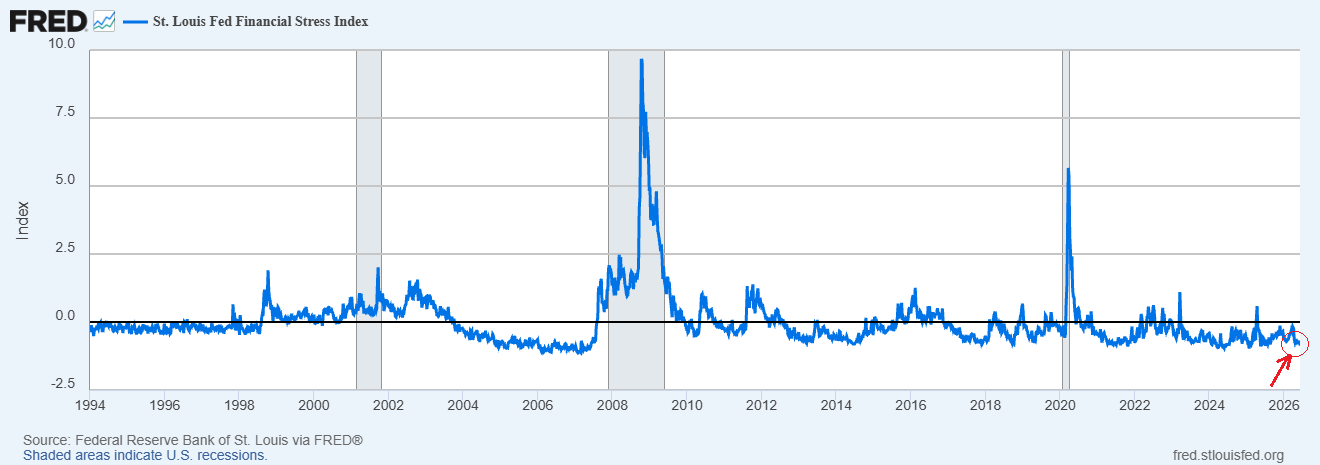
Monetary conditions remain loose despite the inflation shock. The St. Louis Fed Financial Stress Index is currently close to -0.87, indicating easy financial conditions and high liquidity.
In addition, bank credit increased by 7.34% in the year to May. That is considerably faster than the growth of real GDP in the first quarter. This spread indicates an even higher rate of increase in money and credit than in output. This adds additional inflation pressure.
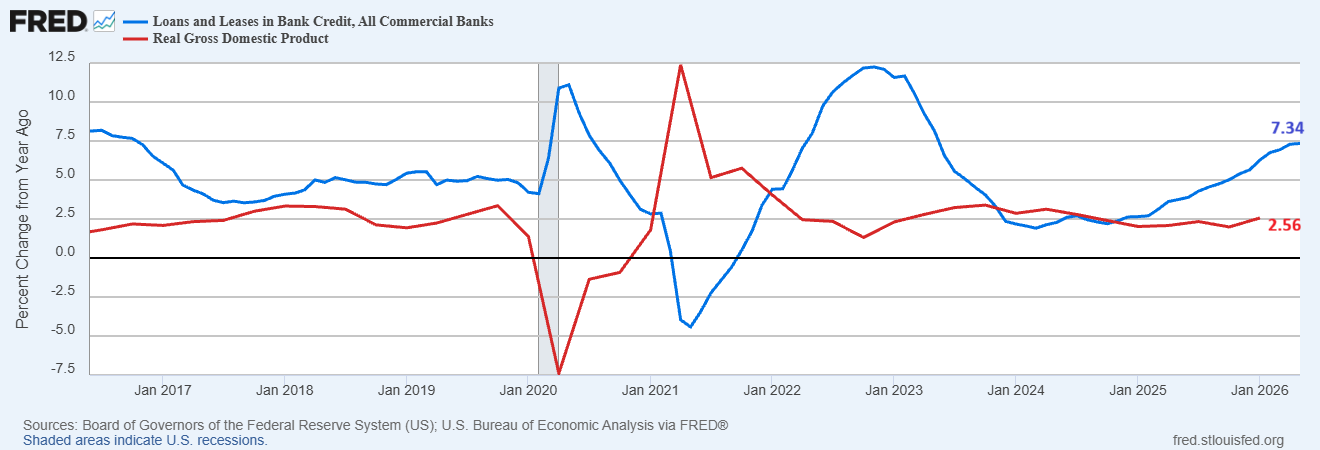
This is supportive for gold in the medium term. An expansive monetary policy can help inflate the prices of assets and deflate the real value of cash. Investors tend to seek value stocks when inflation outstrips economic growth. The overall backdrop is favourable for gold as the US dollar declines and real returns continue to suffer.
The dollar is also in response to the same peace narrative. It has declined as traders have factored in the possibility of lower inflation in the event of a return of crude supply. This enabled gold to recover from its support level around $4,000 per ounce. But this rally requires confirmation. The market is assuming that the Strait of Hormuz will reopen smoothly, but the consequences of the disruption of supply chains, reserves and regional finances will not reverse quickly.
Gold Price Rebound From $4,000 Keeps Bullish Setup Alive
From technical perspective, the gold price hit the strong support of $4,000 and rebounded higher to close above $4,200 last week. The price has been trading within the primary trend since 2023. This primary trend looks very constructive.
The correction toward $4,000 was significant as the price hit the ascending channel line for the first time since December 2025 after the correction began in January. This suggests that the rebound from $4,000 could push prices further higher this week.
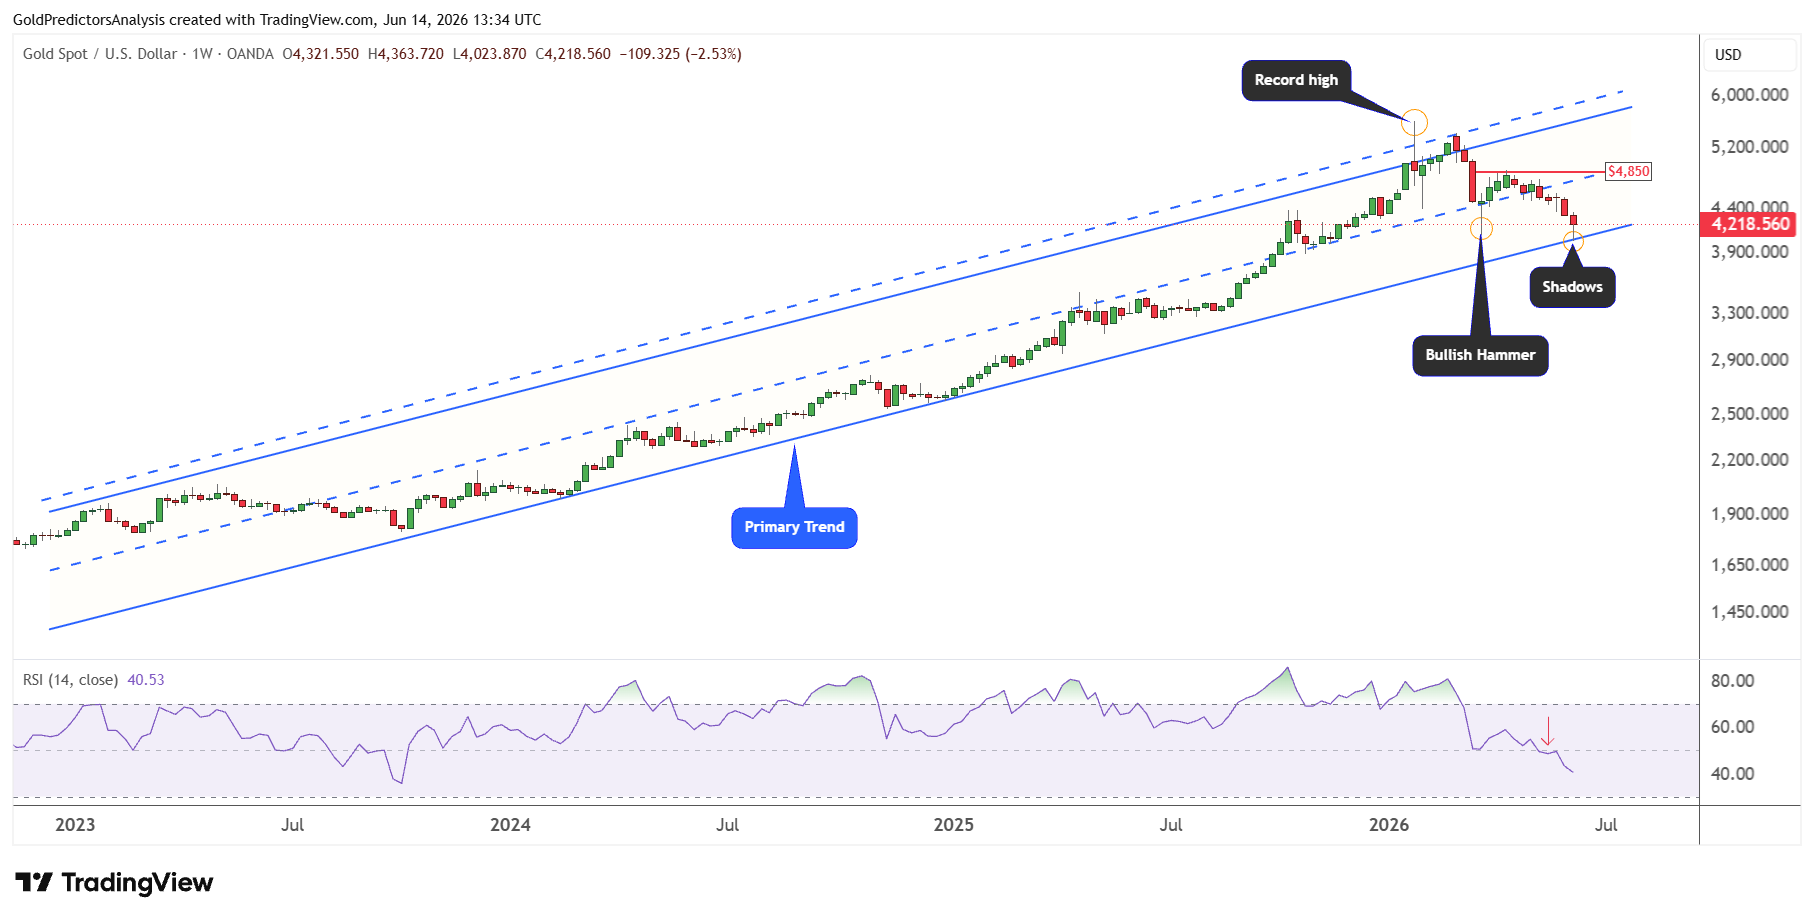
The chart shows that the gold price reached a record high at $5,600 by forming a sharp shadow on the weekly candle. The recent correction has now put the shadow again on the weekly candle at the $4,000 area. This suggests some strength in gold around the $4,000 support level.
But the chart shows the uncertainty in the gold market as the RSI has broken the midline and has not reached the oversold level yet.
Therefore, if the gold price rallies again and the RSI remains below the midline, it may likely offer another round of correction to lower levels.
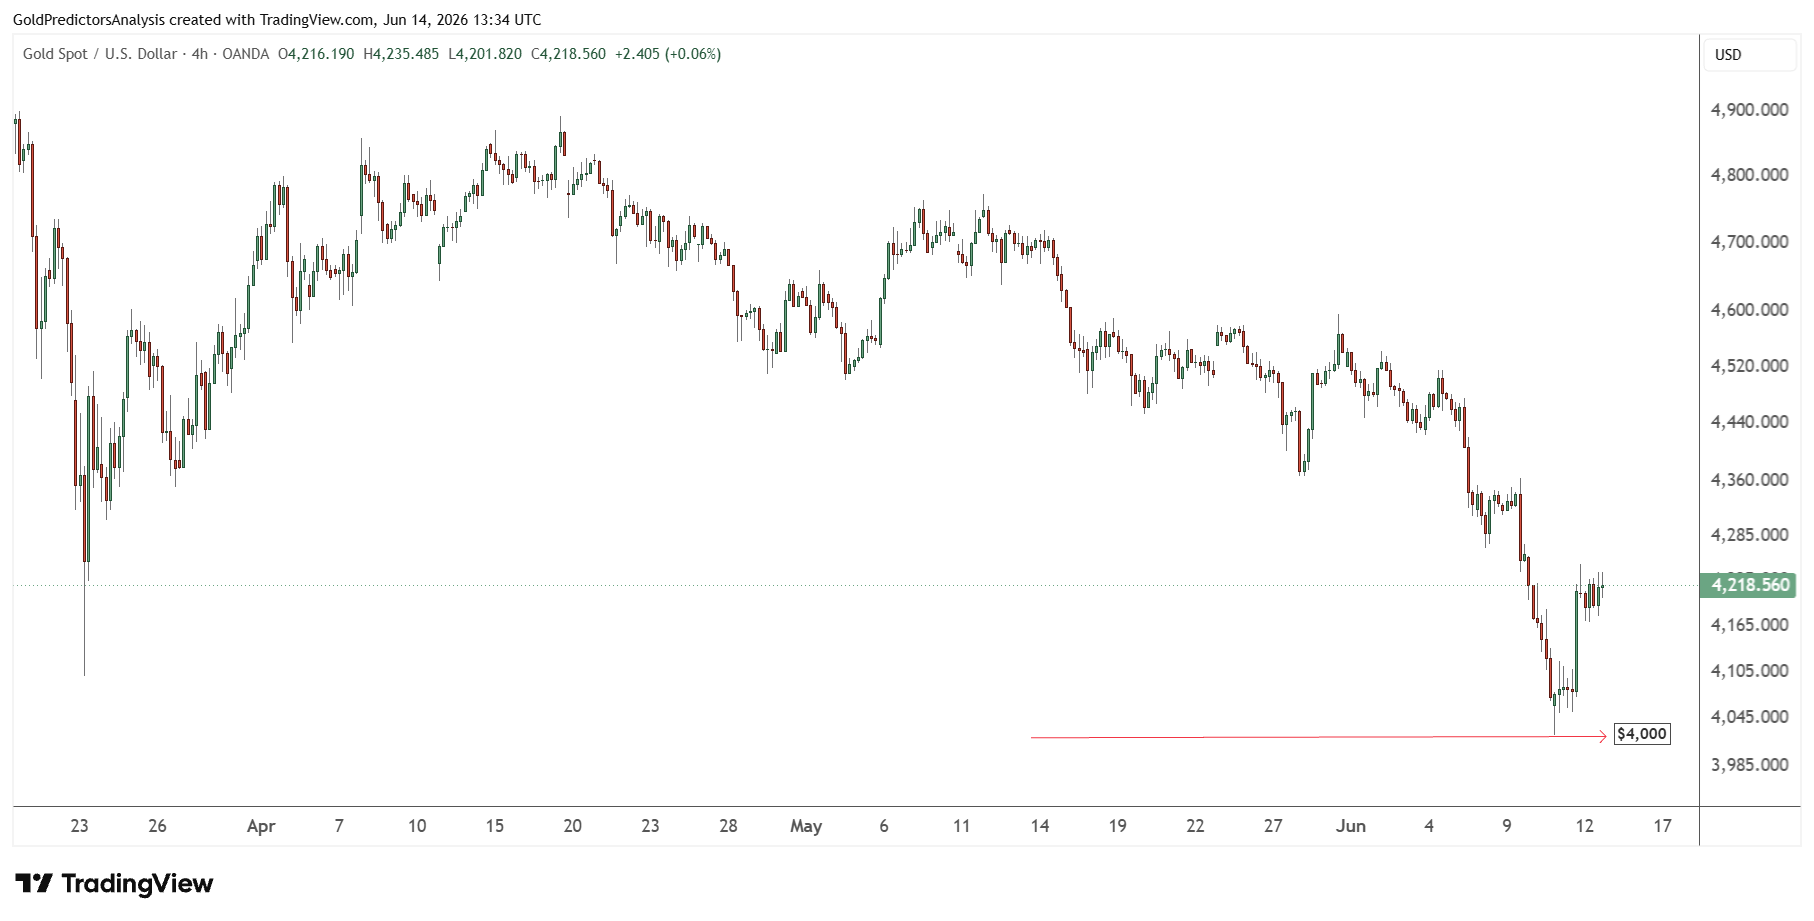
The short-term price structure on the 4-hour chart shows a strong rebound from $4,000 which still looks constructive. But if the price falls below $4,000 this week, it will likely invalidate the short-term bullish structure and enter a deeper correction.
Gold-to-Silver Ratio Signals Another Precious Metals Rally
The gold-to-silver ratio is consolidating around the 64 resistance level. The consolidation below the 64 level indicates negative price action in the ratio which supports the bullish action in gold and silver (XAG) prices.
The ratio showed negative price action last week after gold prices hit $4,000 as the spot silver hit $60. This indicates that the ratio is preparing for the next drop. This negative price action in the ratio suggests that gold and silver prices are preparing for the next rally.
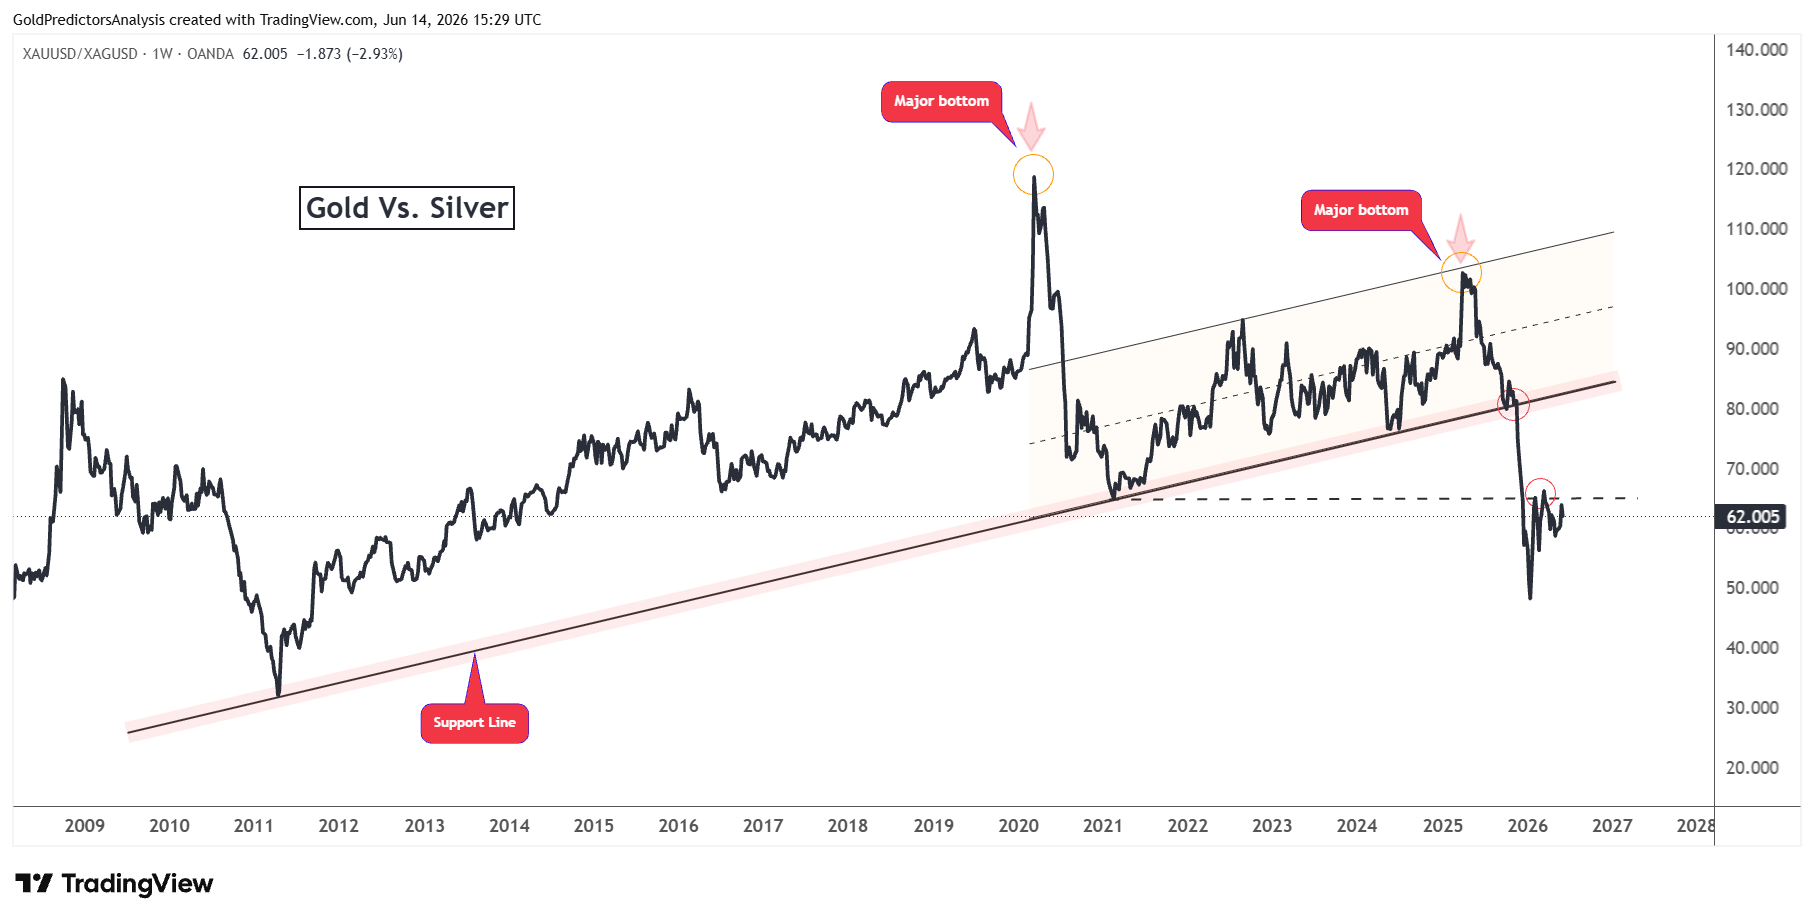
The peaks in the ratio are marked by the major bottoms in gold and silver prices, such as the peaks of March 2020 and March 2025. If the ratio continues to drop from the 64 level, it will likely mark another bottom in gold and silver prices.
Market Risks
A stronger dollar and a hawkish Fed response are the biggest threats to gold. Inflation pressures are building up and the PPI data reveal that price pressures continue to permeate the economy. If the inflation remains strong, the possibility of rate hikes will increase. This would lead to higher Treasury yields and put pressure on gold. A break above 4.75% in US 10-year Treasury yields will keep the gold price under pressure.
The second risk stems from the risk-off sentiment in financial markets. Bitcoin (BTC) is hovering around the key support at 60,000. A break below this level will suggest further downside in risk assets. This may increase volatility in gold. But if gold prices break below $4,000, the short-term structure would weaken. But the long-term demand for safe havens will persist.
Final Words
Gold remains supported as long as the $4,000 level holds. Inflation pressures are growing, and the oil supply shock keeps the safe-haven demand alive. The weakness in the US dollar and the easy financial conditions also supported the rebound in gold from $4,000. The weakness in the gold-to-silver ratio also supports the rally in gold from $4,000. But the risk of higher interest rates due to inflation shock keeps the rally capped. If the gold price breaks the $4,500 and the gold-to-silver ratio drops below 59, the rally in gold will likely resume. But a clear break below $4,000 will signal further downside to $3,800.