



Gold (XAU) prices rebounded from $3,975 as oil prices eased slightly from the resistance area. However, oil prices still remain strong and U.S. Treasury yields have hit short-term support near the 5% level. The U.S. dollar index also remains strong ahead of the Federal Reserve decision. In my view, gold and silver (XAG) prices may remain under pressure if oil prices continue to trade higher. However, any deeper correction in oil prices below $100 may trigger a strong rebound in gold and silver prices.
High Energy Prices and Treasury Yields Keep Gold Under Pressure
The oil market remained strong in October and surged higher to reach near the resistance area of $120. The price corrected lower on Monday and Tuesday but still remains strong.
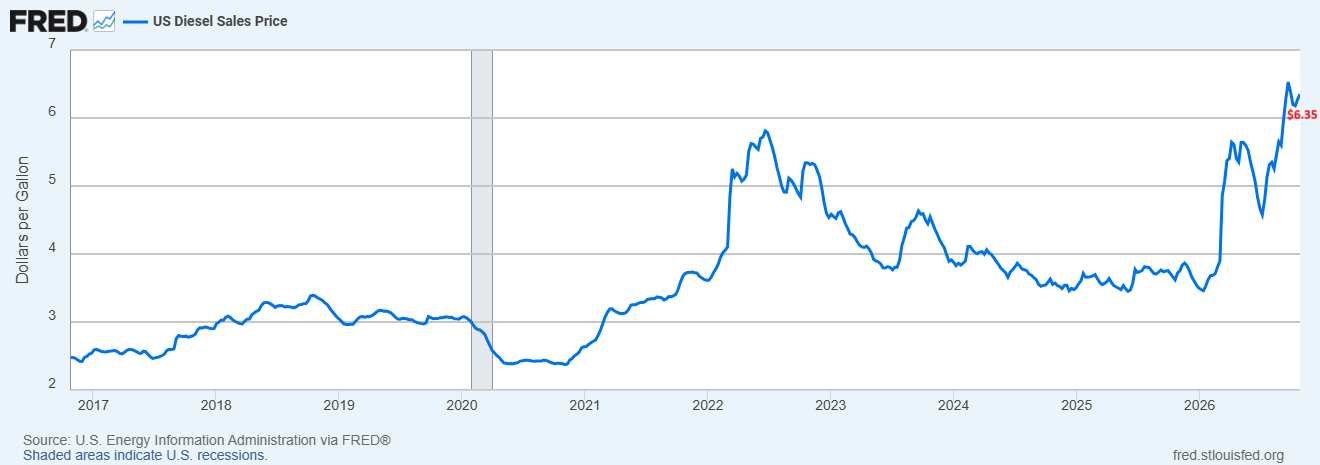
The U.S. diesel sales price remains elevated above the $6 area as seen in the chart below. The U.S. diesel sales price has surged in 2026 from nearly $3.45 in January to above $6.35 in October 2026. This is a gain of over 80% which adds to inflation pressure.
10-Year Treasury Yield Tests Support Near 5%
The 10-year U.S. Treasury yield also hit resistance near the 5.20% to 5.35% zone as seen in the chart below. After hitting this resistance, Treasury yields dropped towards the 5% area in October. The RSI also reached overbought territory when U.S. Treasury yields reached the target area.
Gold Price Forecast
Every new Gold analysis as it publishes, today's technical signal and key levels, live price — on one page.
See all Gold forecasts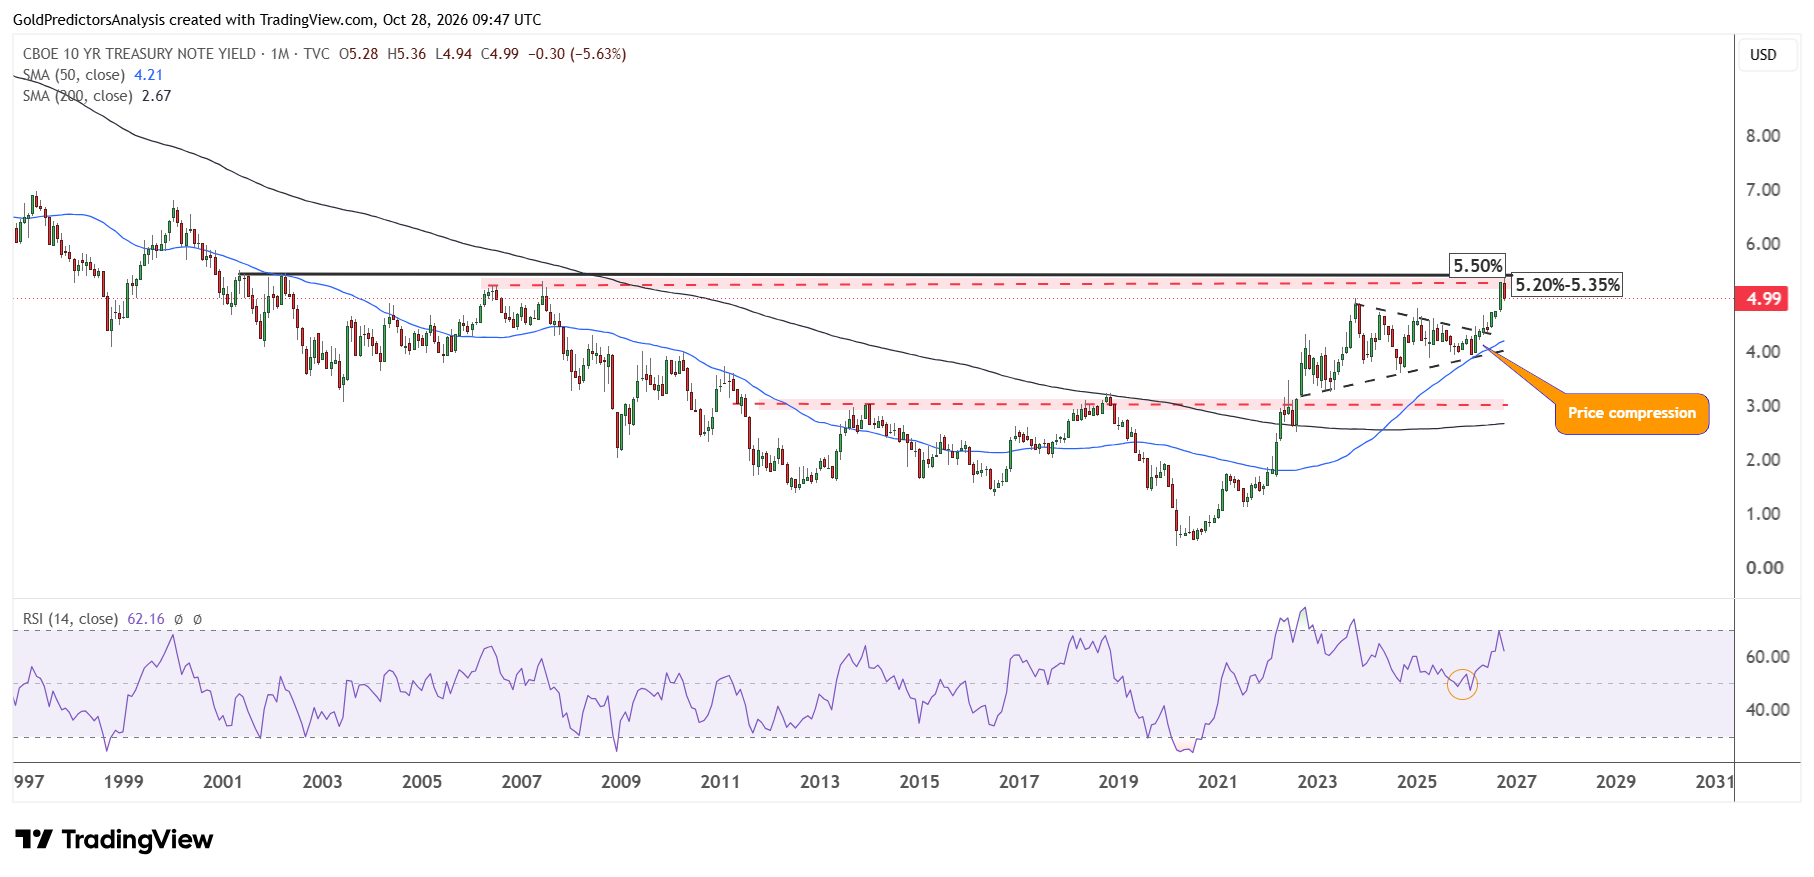
However, the yield still remains high and this correction has pushed the yield to support at the 5% area which is considered strong support. The formation of price compression patterns from November 2023 to April 2026 in yields suggests that the Treasury yield may remain elevated.
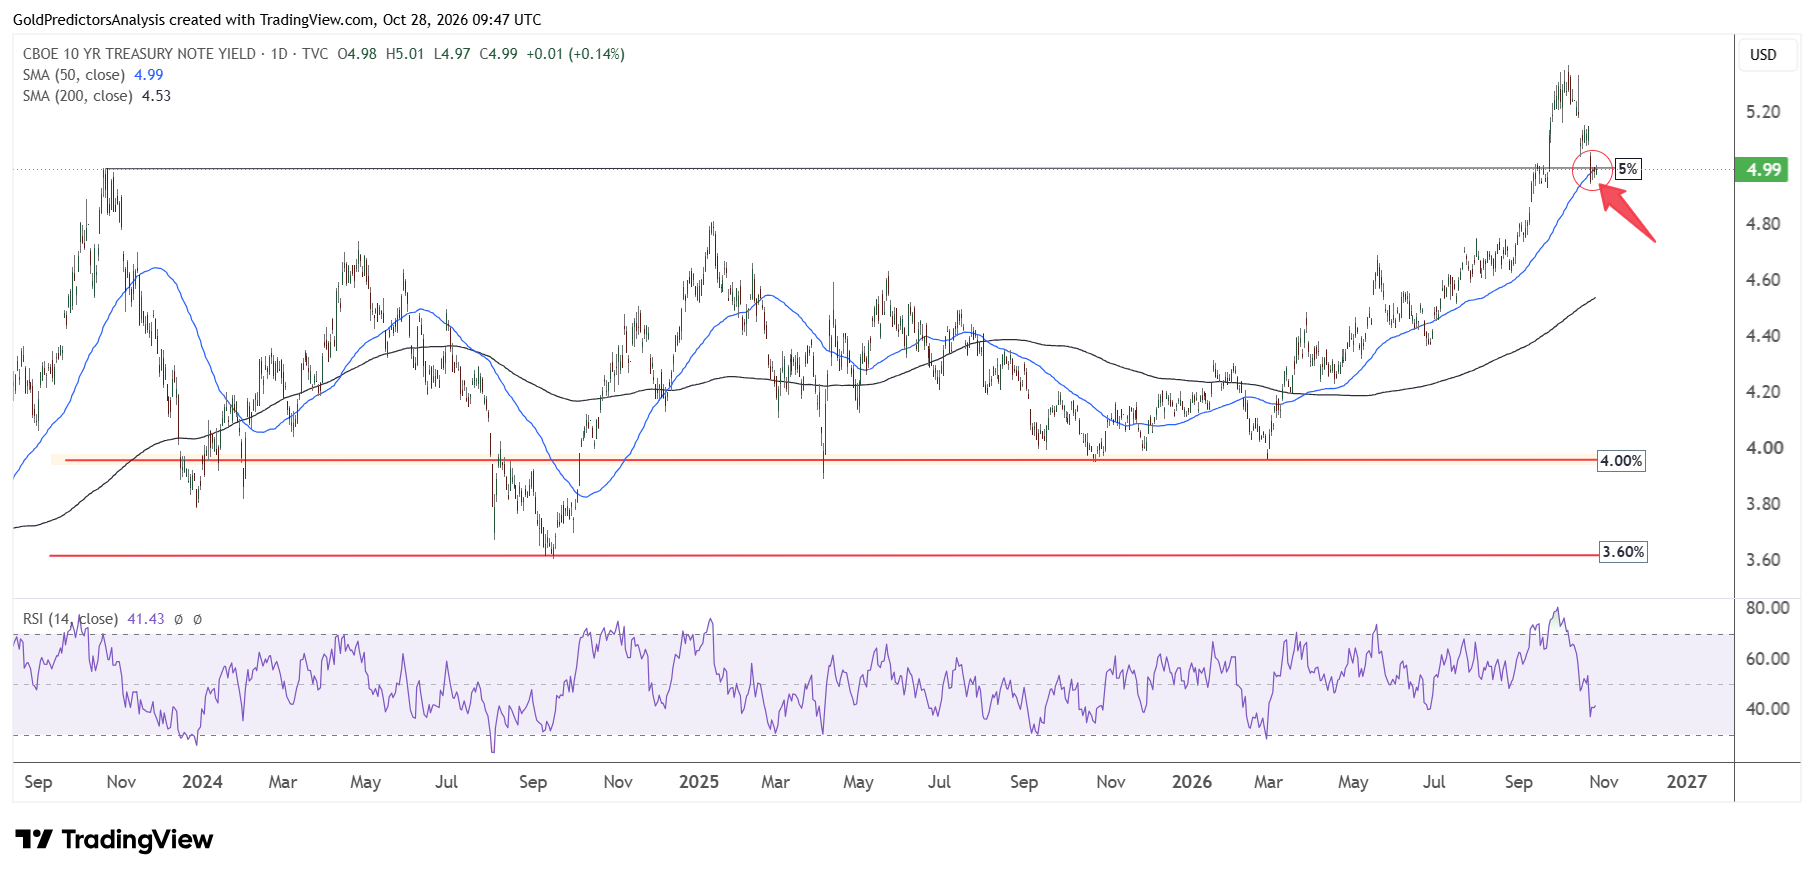
This strength is further observed on the daily chart, which shows that the Treasury yield is now consolidating around the 5% area. This area is the support of the 50-day SMA. If Treasury yields hold this support, this may create rebound. The sharp drop in Treasury yields suggests increased investor demand for bonds, which is a bearish sign for stocks.
Stocks Face Pressure as High-Yield Bond Spreads Widen
U.S. stocks dropped lower in October. The Nasdaq index dropped to near 29,000 and the S&P 500 also dropped near support at 7,612. But stocks are again gaining momentum in the last week of October 2026.
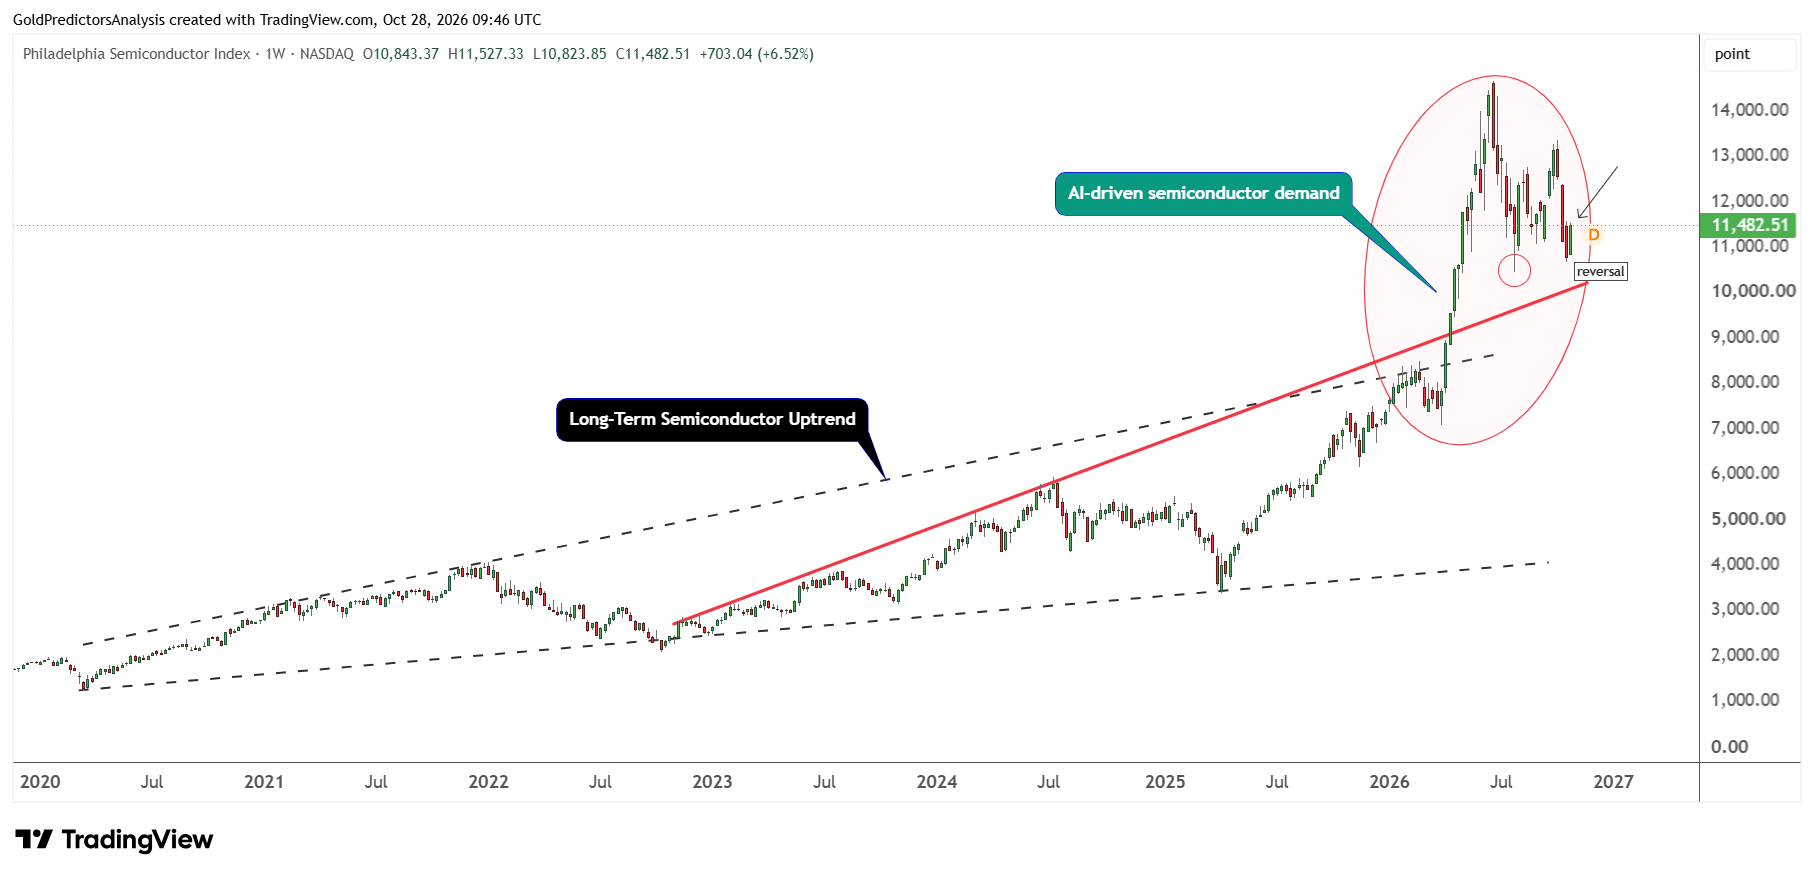
The chart below shows that the Philadelphia Semiconductor Index faced extreme bearish pressure in October. But it is gaining strength in the short term, as the index has gained nearly 6.5% this week. However, if U.S. Treasury yields continue to drop below 4.95%, it will signal further downside and it may increase pressure on semiconductor stocks.
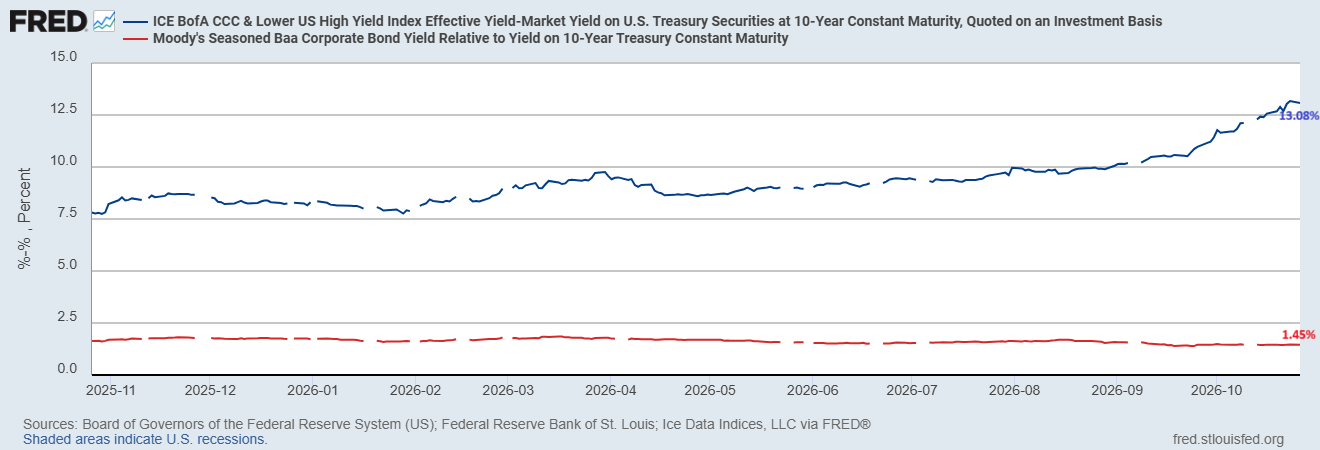
The yields on investment-grade and high yield bonds are rapidly diverging. The chart below shows that the spread between the Moody’s Baa-rated corporate and 10-year Treasuries has narrowed to 1.46%. On the other hand, the spread between CCC-rated and lower bonds and 10-year Treasuries has widened to 13.08% from 9.89% at the end of August.
US Dollar Holds Firm Ahead of the Federal Reserve Decision
The US dollar index has formed a strong basing pattern from May 2025 to October 2026. However, the index is now facing resistance near the 200-week SMA.
The correction during the past two weeks in the index has produced a low this week at 101.45 and triggered another rebound before the Federal Reserve decision. If the Federal Reserve signals another rate increase in December, then the U.S. dollar index will likely face further strength in the short term.
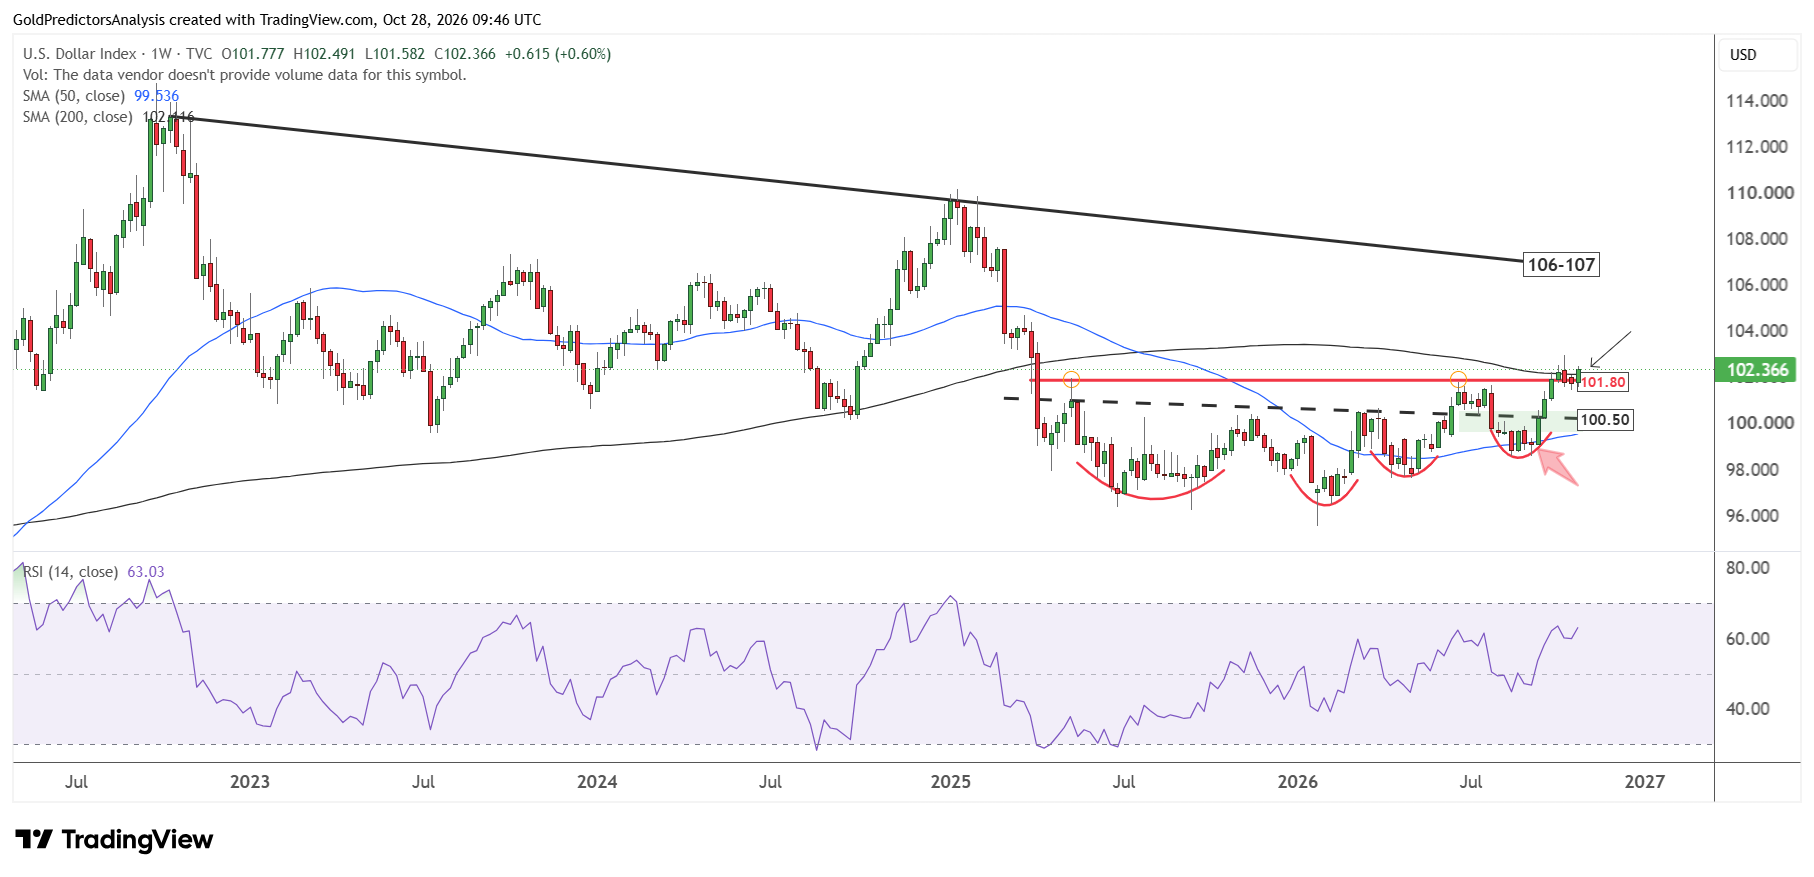
This strength may break the index above the 103 level. A break above the 103 level will likely push index to 104.50 and then towards the significant resistance of the 106 to 107 zone. If the US dollar index remains strong, it may further put pressure on gold and silver prices in the short term.
Gold and Silver Struggle Despite Falling Treasury Yields
The chart below compares gold and silver prices with 10-year Treasury yields and shows the relationship. It is observed that Treasury yields surged higher from August 2020 to October 2023. At the same time, gold and silver prices consolidated in tight range and did not produce new highs.
But from October 2023 to February 2026, 10-year Treasury yields consolidated in a tight range. During this period, gold and silver prices surged higher. This can be understood to mean that the pressure on Treasury yields has created strong surge in gold and silver prices.
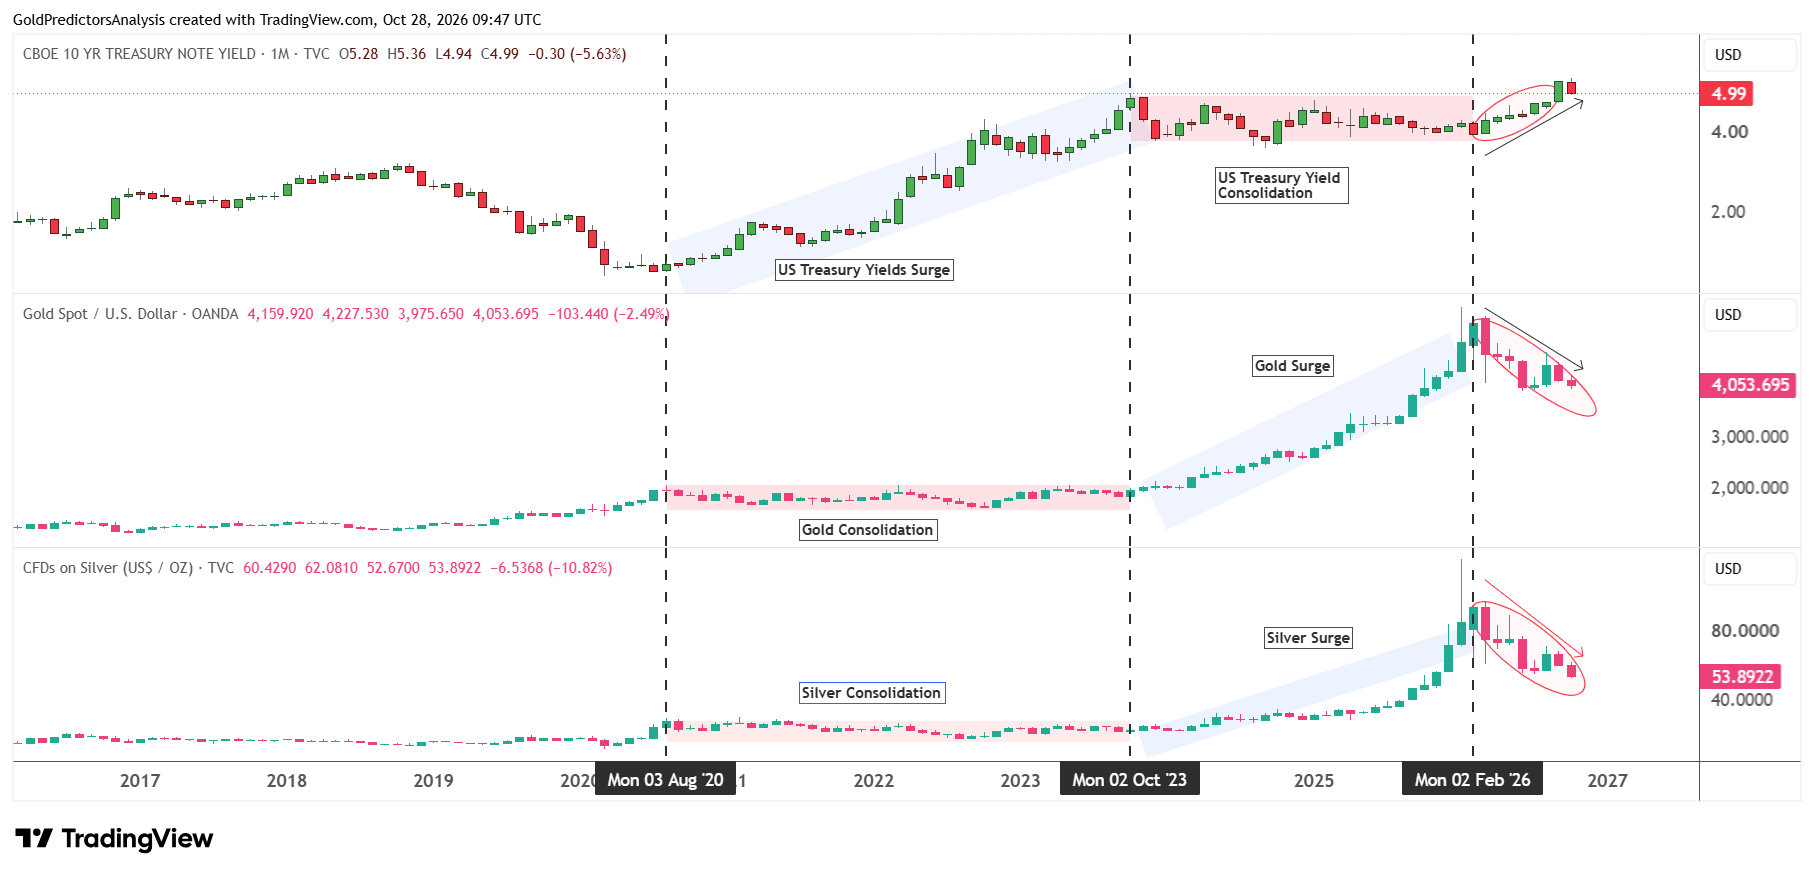
However, the Treasury yield has been surging higher since February 2026 after the U.S.-Iran war, and it has now broken above the resistance of 5%. During this period, gold prices corrected lower after forming record high at $5,600 and remained under pressure. Silver prices also corrected lower after marking a record high at $120 and remained under pressure.
However, the correction in U.S. Treasury yields in October did not bring any meaningful rally in gold and silver prices. The 10-year US Treasury yield has dropped nearly 5.6% in October while gold and silver prices also dropped by 2.45% and 10.50%.
Therefore, if Treasury yields continue higher again from the 5% support, then gold and silver prices may continue to remain under pressure. However, if the U.S. Treasury yield continues to trade below 4.70% and then falls below the long-term range, it may trigger a rebound in gold and silver prices.
Gold Price Technical Analysis: Key Support and Rebound Targets
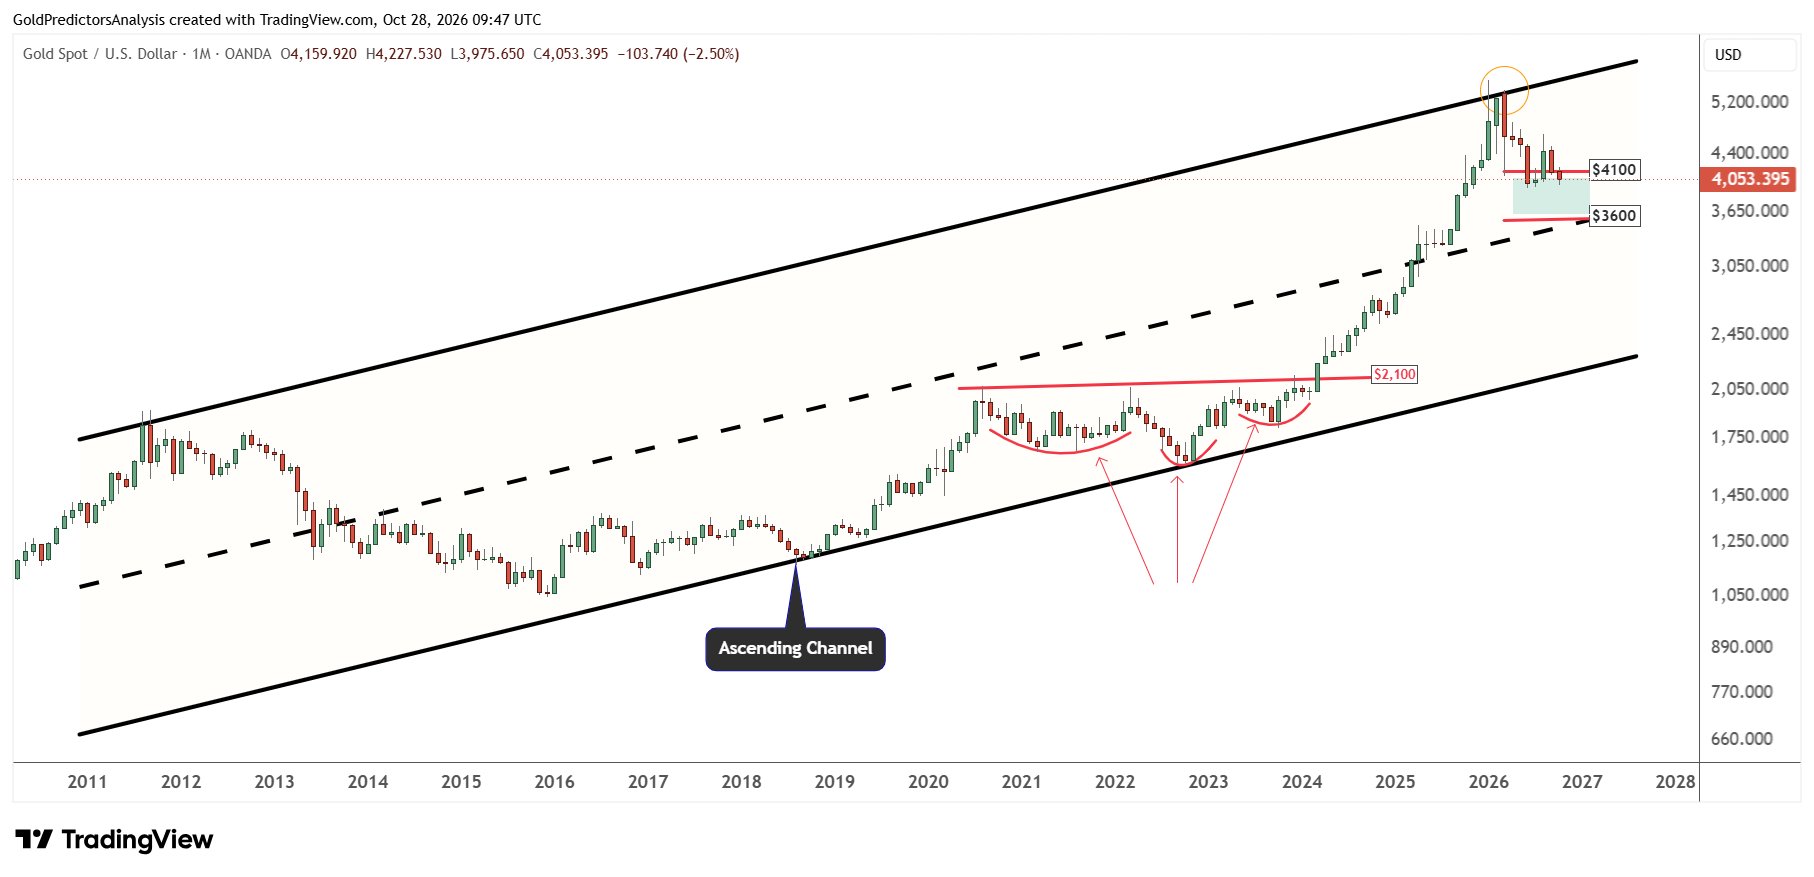
From a technical perspective, the gold price has been trading within the ascending channel pattern since the lows of August 2018. The record high was formed in January 2026 at $5,600 and the price is now correcting towards the long-term support zone of $3,600 to $4,100.
If U.S. Treasury yields form a peak near 5.50% and continue lower, gold prices may form a strong low on a long-term basis within the support zone and start to move higher towards the $6,000 level. The support at $3,600 also intersects with the midline of the ascending channel pattern which also provides support.
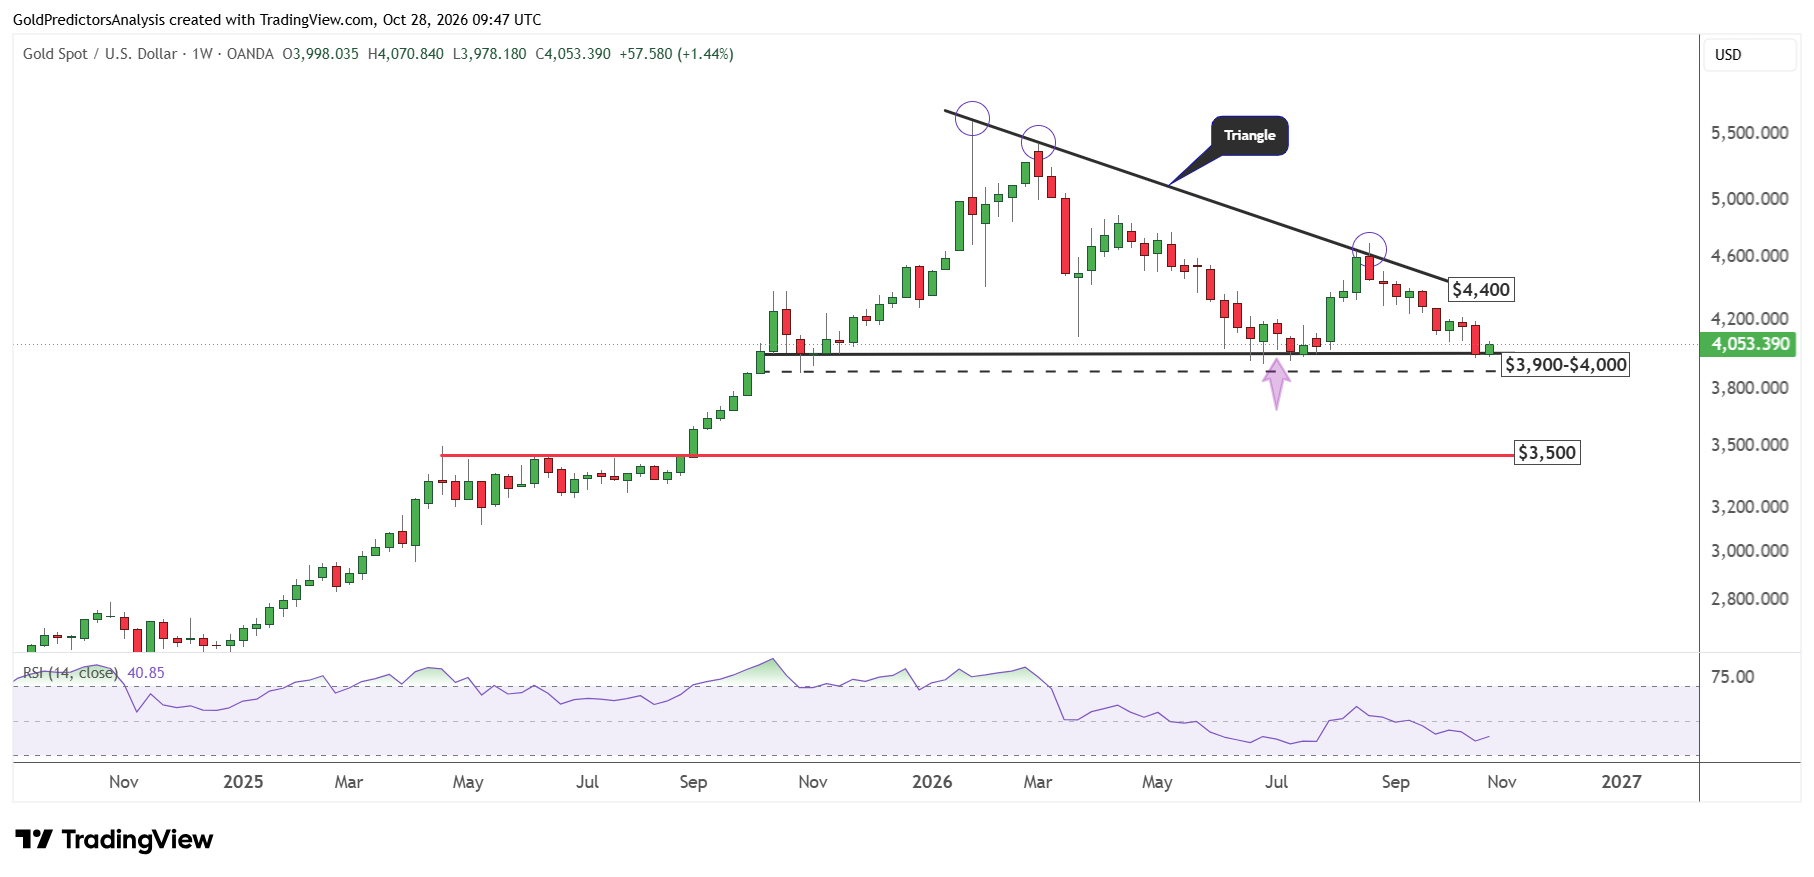
The strong short-term support in the gold price is observed on the weekly chart. The chart shows that the price has been consolidating near the support of the triangle pattern. This support zone lies between $3,900 and $4,000. A break below $3,950 will indicate a strong drop in the gold price towards $3,800 and then the $3,500 area.
However, if prices rebound back above the $4,200 level, it will likely open the way for the triangle’s resistance at the $4,400 level. A confirmed break above $4,400 will likely trigger strong rally toward the $5,000 region.
Final Thoughts
Oil prices remain strong despite the recent correction. Stocks are facing challenges in gaining further momentum as investors shift towards security of bonds. The widening spreads for high-yield bonds warn of growing stress among low-grade corporate borrowers.
Platinum (XPL), palladium (XPD), copper (XCU), uranium and lithium prices are dropping which suggests that manufacturing demand will likely slow due to high energy prices. This slow demand will likely impact the silver market as silver is used as industrial metal.
The 10-year Treasury yield has hit an important resistance area on a long-term basis and started to correct lower. But the yield is facing short-term support near 5%. Despite this correction, gold and silver prices did not produce a rebound. If the yield forms a high near the long-term resistance area of 5.5%, it will likely trigger strong bottom in gold and silver prices.
But gold is testing support near the $3,900 to $4,000 area. If gold prices break below this zone, it will likely trigger deeper correction in gold towards the $3,800 and $3,500 levels. The key risks in gold are still rising oil prices and conflict in the Middle East. But this correction will likely be considered an opportunity for long-term investors to accumulate gold.
Read more: Dollar Strength Threatens Rebound in Gold and Silver