



Gold (XAU) prices exhibit compression patterns before the Fed decision. In my view, gold may remain under short-term pressure while Treasury yields stay elevated but this correction could prepare the market for the next long-term rally. This article examines the Fed outlook, inflation risks, nominal GDP growth, Treasury yields and the key technical levels that may shape the next move in gold.
Rising Treasury Yields Put Gold Prices Under Pressure
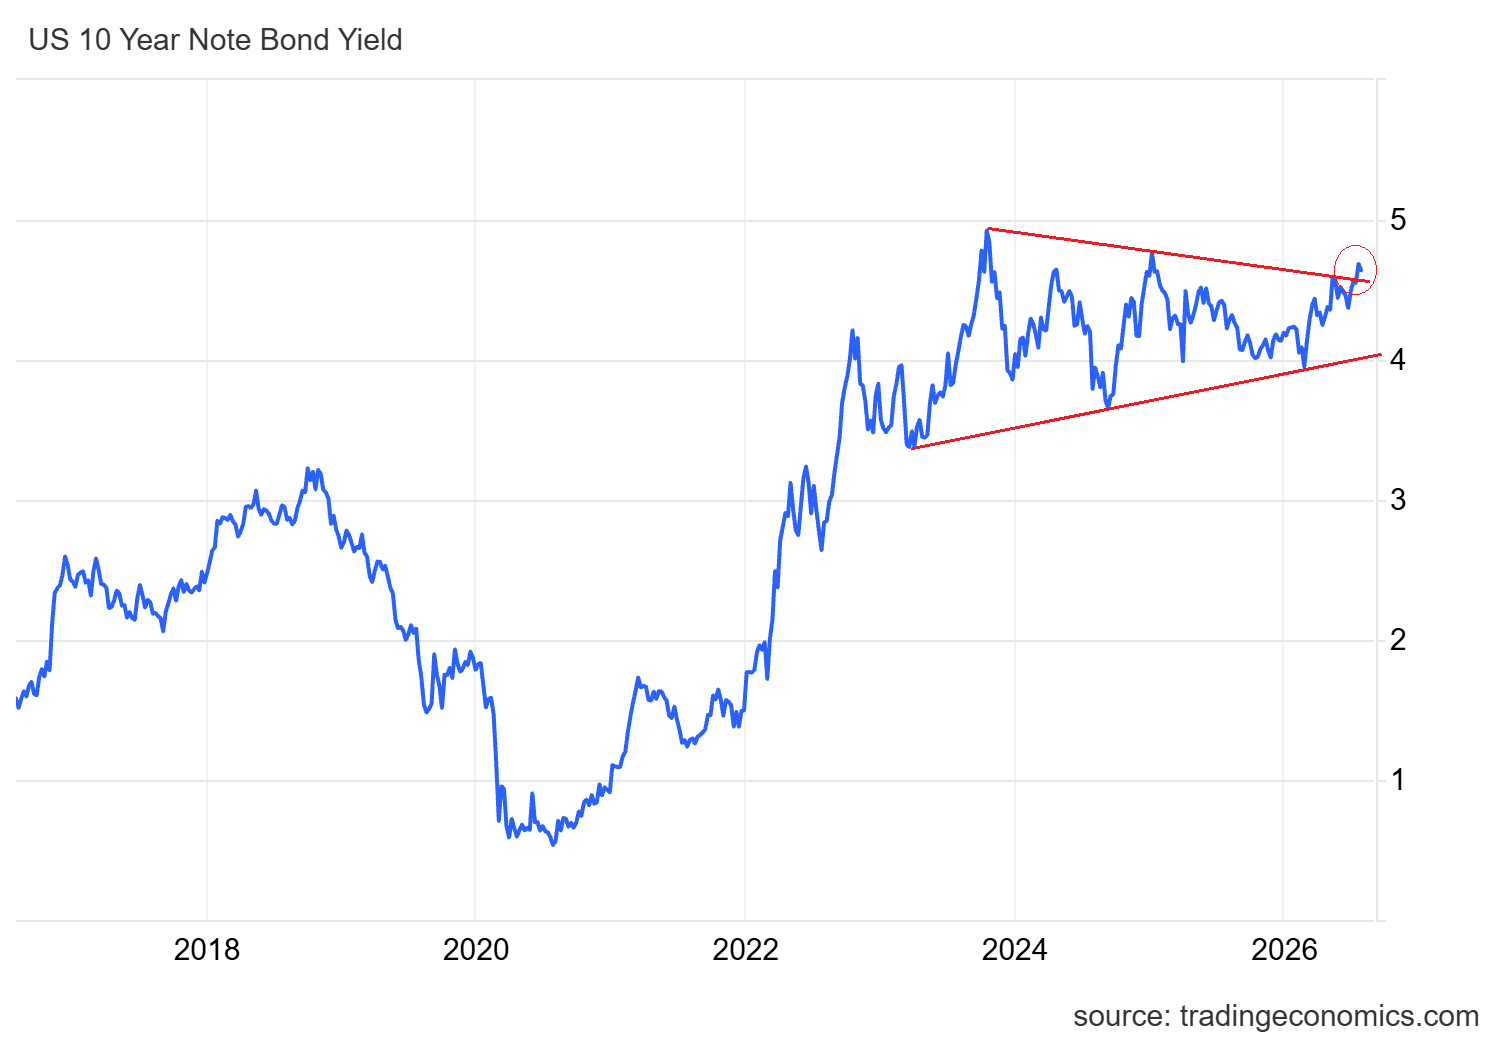
The 10-year Treasury yields have increased significantly during the last few weeks. The Treasury yields dropped on Monday to 4.63% but this drop does not change the bullish picture. The positive momentum in yields puts pressure on gold as investors can earn higher returns from government bonds.
The chart below shows that the 10-year US Treasury yields have formed a triangle pattern which is strongly bullish price action. The breakout from this triangle pattern suggests a quick move to 5%.
The inflation, economic growth and future interest rates are significant factors in movements in long term Treasury yields. Investors require a higher yield when they anticipate higher inflation to make up for the fact that the money they invest in that bond will lose purchasing power during the bond’s life.
This pressure is already being felt throughout the economy. The higher Treasury yields have pushed the borrowing costs higher as the average 30-year fixed mortgage is now at approximately 6.69%.
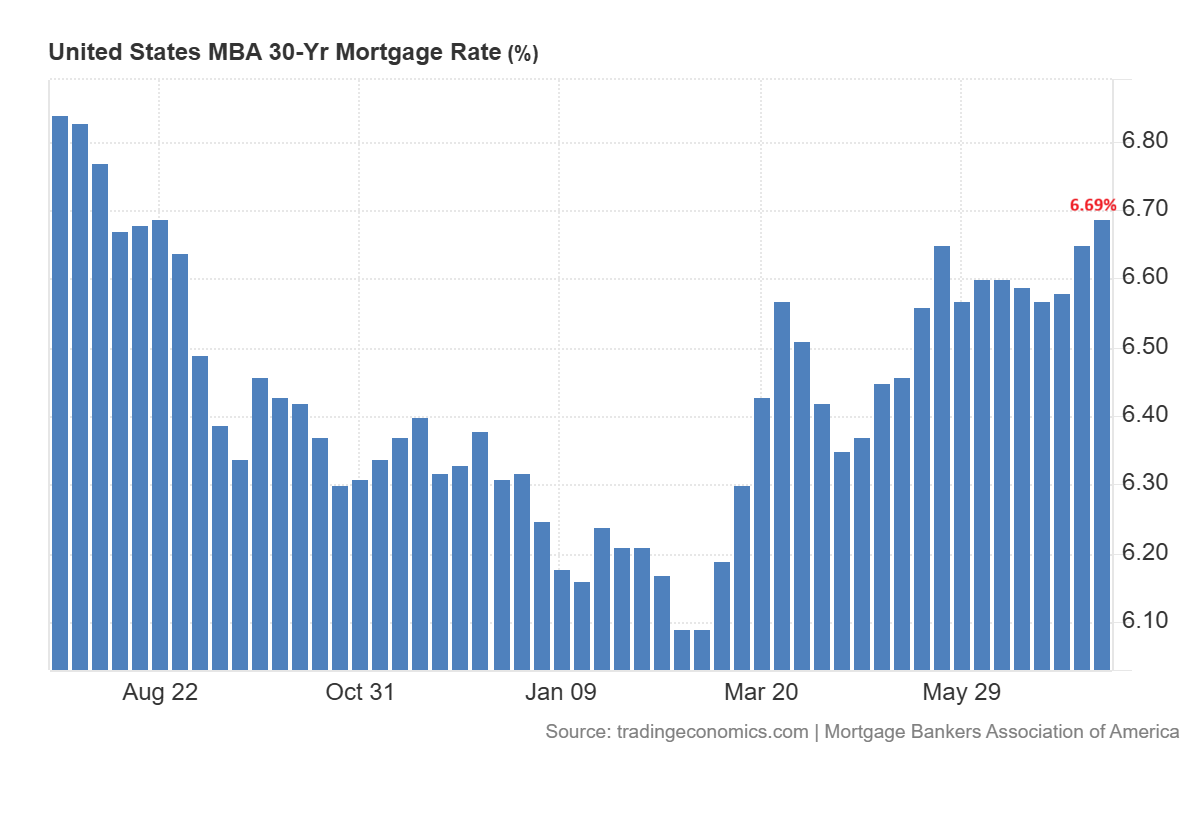
An increase in the cost of housing and financing may depress household spending. This may slow the economic activity. This situation creates the crucial tension for gold. The increase in yields is initially negative signal for the metal but a notable slowdown due to the restrictive financial conditions may lead to greater demand for metal as a defensive asset.
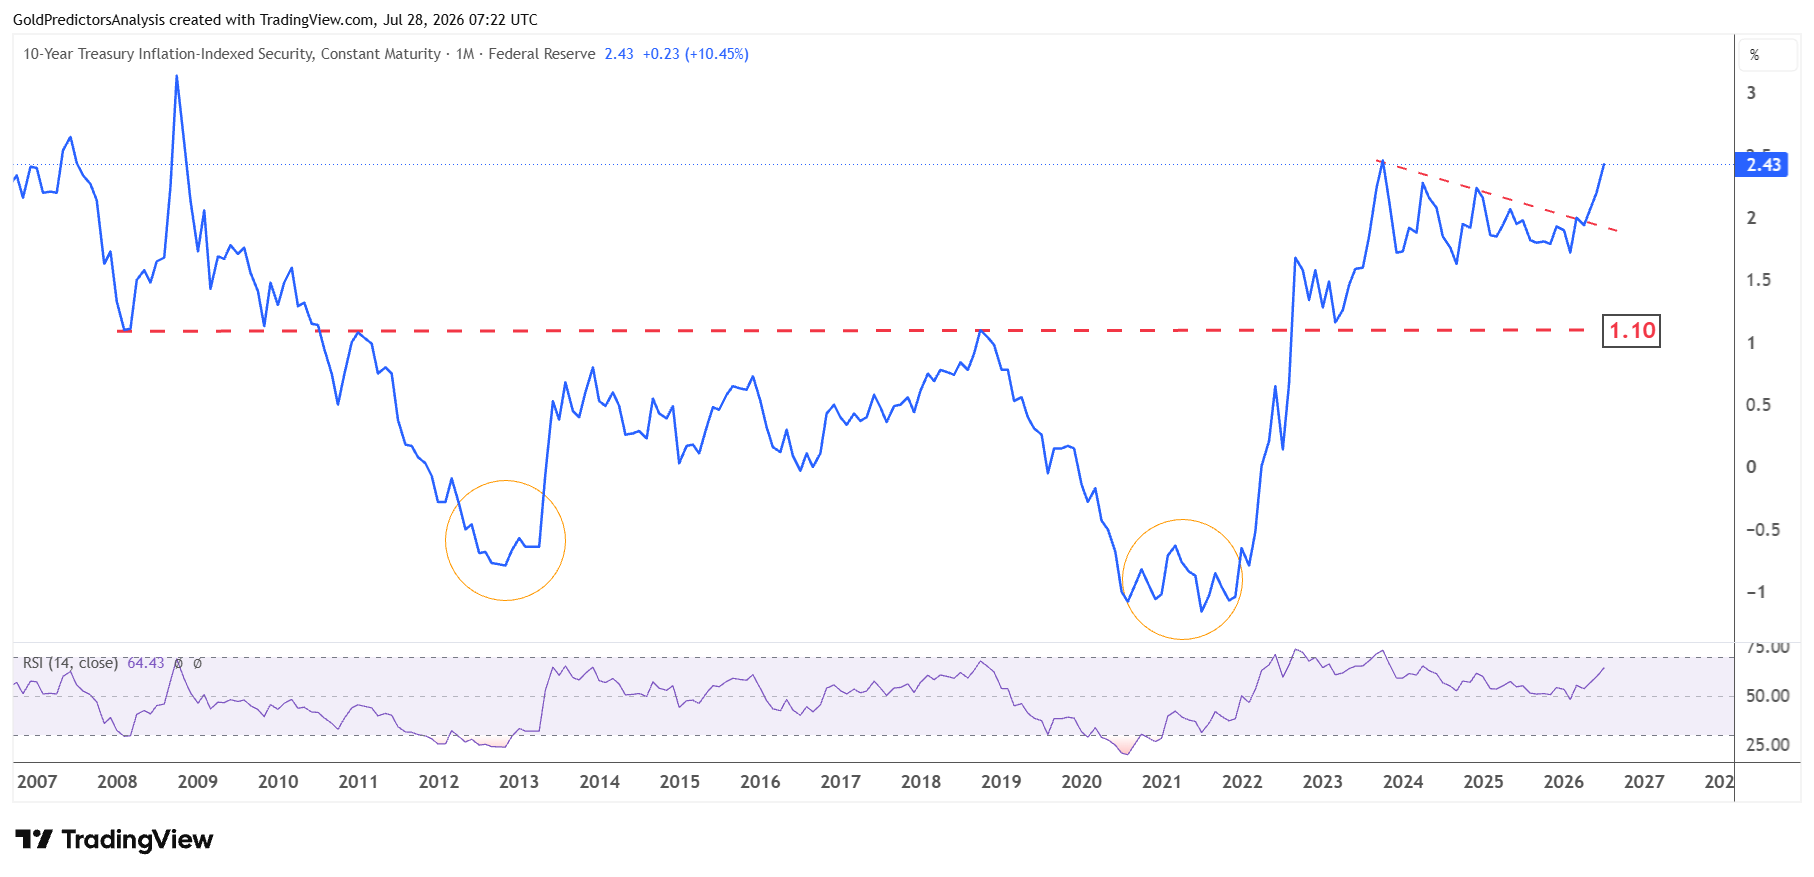
This risk is even more apparent from the real yields. The yield on the U.S. 10-year TIPS is up to about 2.44%. The higher real yield is bearish for the metal. This keeps the gold rallies limited below the key resistance levels.
Gold Price Forecast
Every new Gold analysis as it publishes, today's technical signal and key levels, live price — on one page.
See all Gold forecastsFalling Oil Prices Ease Inflation Pressure on Gold
Oil prices remain the most critical variable in the movement of gold prices in the short term. The energy prices surged during the war between the United States and Iran. The higher oil prices can be transmitted via transportation, manufacturing and consumer prices. This raises the possibility of inflationary pressures and another catalyst for the Fed to stick to a tight monetary policy stance.
But the situation changed on Monday as oil prices dropped following indications of de-escalation between U.S. and Iran. Gold rallied and moved above $4,100. The geopolitical tensions usually drive the gold demand. But the falling oil prices reduce the inflation concerns and dampen hopes for any dramatic monetary tightening.
The rally in the gold price on Monday was also eased as the prices still remain under broader pressure. The latest inflation data indicate the importance of oil. Inflation in the U.S. dropped to 3.5% in June from 4.2% in May. The core inflation also dropped to 2.6%.
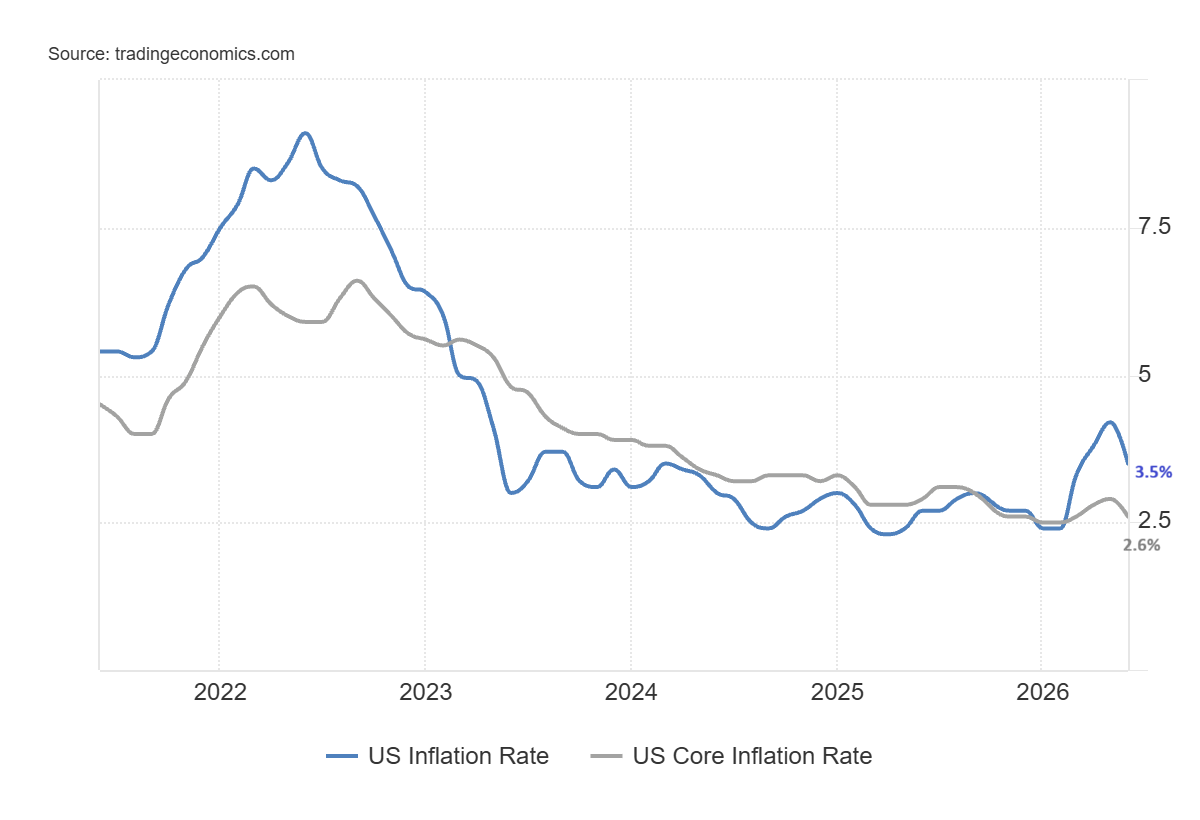
This improvement was greatly influenced by energy prices. But the ongoing uncertainty in the US-Iran war may keep the inflation outlook uncertain in the short term. This means that any further drop in oil would bring the headline inflation down and eventually release the pressure on Treasury yields. But any new escalation may trigger the opposite effect.
The market expects the Federal Reserve to keep the interest rates unchanged in the July meeting. But the possibility of a rate hike in September is over 50% as per the FedWatch tool. These expectations may increase further if the oil prices continue to remain above $100 due to further escalation in the Middle East.
Strong Nominal GDP Growth Keeps Inflation Risks High
Another view of the long term interest rate picture is the nominal GDP. A high nominal growth may be due to the combination of real growth and inflation. The financial conditions may still be supportive if the nominal growth is strong and long term rates are relatively low despite the higher borrowing rates.
The long term rates tend to reflect the nominal economic growth and expected levels of inflation. If there is a substantial and sustained gap between the two, it can be a sign that monetary and financial conditions are not as tight as the headline interest rates suggest.
That’s important since the U.S. economy is growing while inflation is still above the Federal Reserve’s 2% target. The chart below shows that the real GDP increased at a rate of 2.7% in the Q1 2026 and inflation remained high.
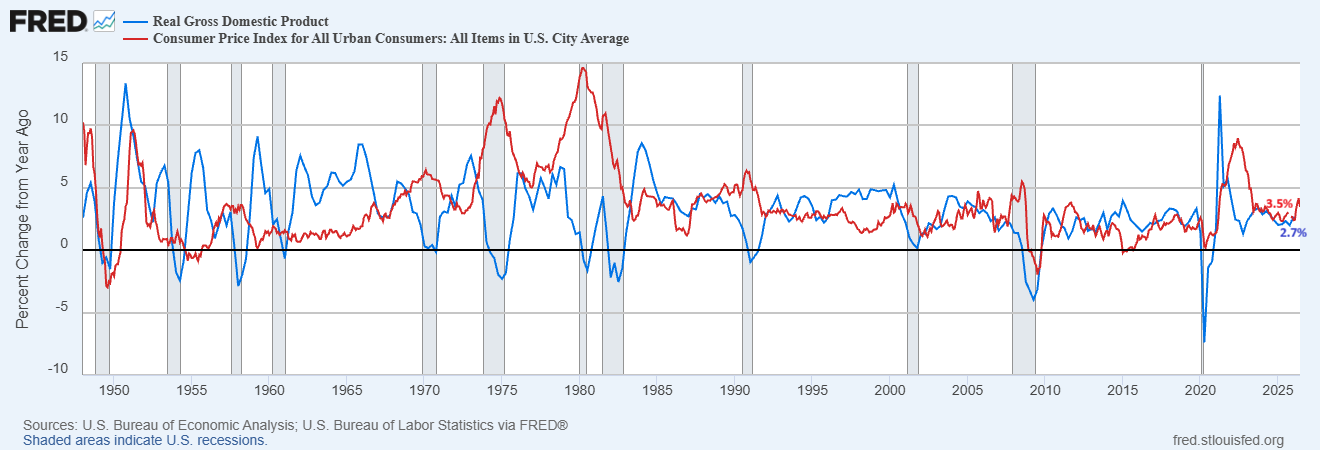
The real growth and price increases combine to ensure relatively strong nominal economic growth. As long as this combination persists, investors could keep demanding higher long term Treasury yields.
With gold, the impact may change over time. In the initial phase of an inflationary expansion, the substantial expansion of nominal growth can support real assets because corporate revenues, wages and prices experience nominal growth. But once inflation levels begin to climb the Treasury yields and interest rates in real terms could see a sharp increase, which could put a correction in gold prices before the long-term trend returns.
Fed Interest Rate Decision Could Trigger Gold’s Next Move
The Federal Reserve meeting is now the next big event for gold. The markets are broadly anticipating that policymakers will not make any change at the next meeting with high hopes for further hikes later in the year. Thus, it will be the Fed’s view on inflation, oil prices and the economy as a whole that will be the deciding factor, and not just the rate decision.
The rally in gold on Monday was limited, and the price continues to trade downside on Tuesday. Investors are still paying attention to oil and dollar moves. The drop in oil prices reduces inflation fears and weakens the US dollar outlook. The weaker dollar keeps the gold in positive direction. Despite this short term uncertainty in the oil market, the US dollar maintained a bullish picture after the breakout from the key level of 100.50.
The chart below shows that the US dollar produced a strong bullish candle at the key support of 100.50 and looks to gain positive traction to 104, which keeps the pressure on gold prices.
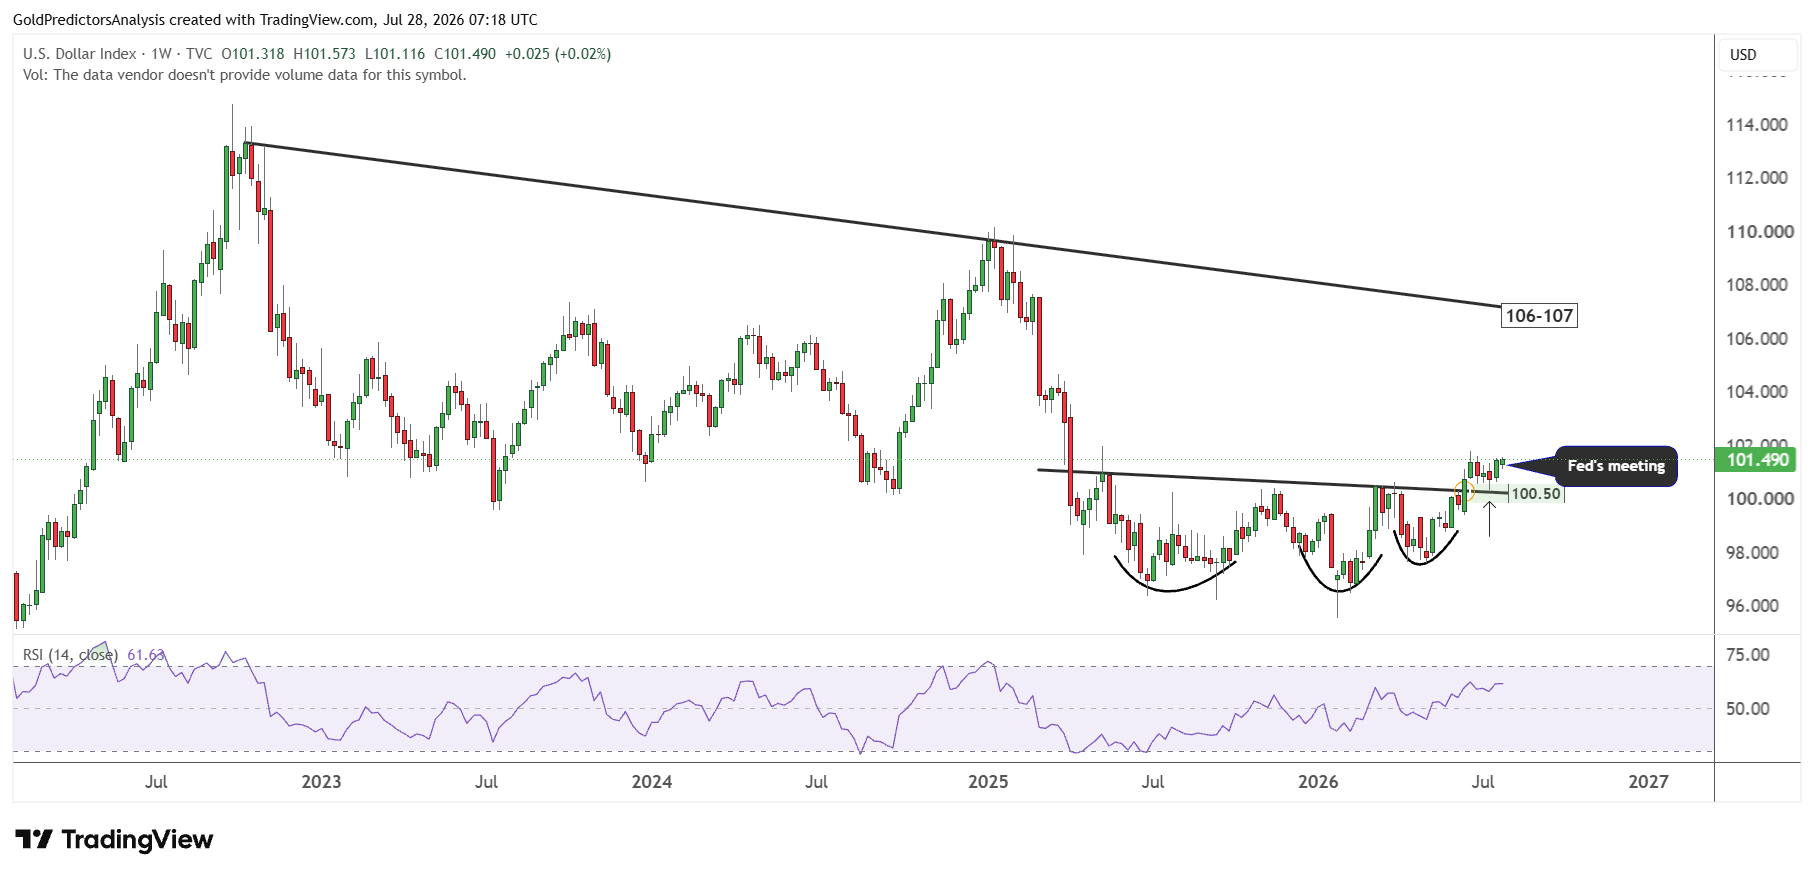
Another primary issue for gold is the real strength in the US Treasury yields. The long term relationship between the gold and US Treasury yields has been discussed in previous analysis. This means that if the US Treasury yields continue to rise towards the 5% level, then gold may continue to drop further before the next rally.
Gold Price Eyes a Breakout Ahead of the Fed Decision
From technical perspective, the gold price has been compressing between $3,950 and $4,200 during June and July before the Fed decision. These consolidations have formed a price compression near the edge of the falling wedge pattern. A break of either of these levels will likely define the next move. However, a break above $4,200 will likely indicate a strong rally in the gold market due to the breakout from the positive pattern.
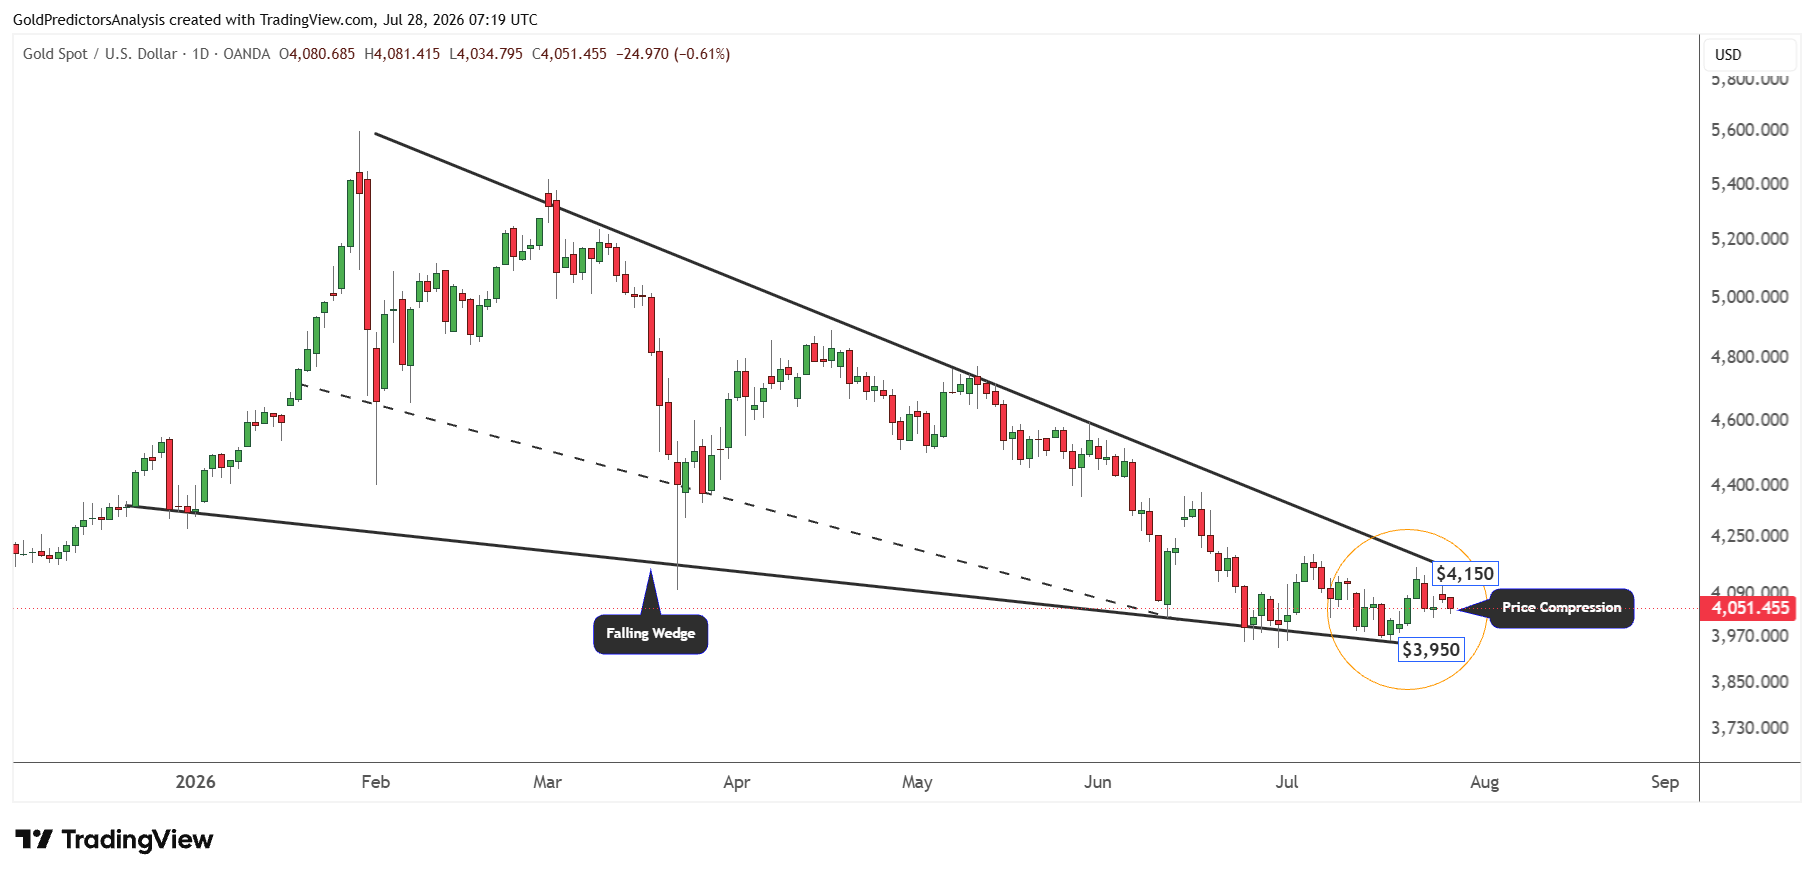
On the other hand, a break below $3,950 will indicate further downside toward the $3,700 area. However, if the gold price opts to move lower, then the decline will likely be short-lived. This decline could prepare the market for the next move higher. The immediate resistance after a break above $4,200 will likely be $4,500. A break above $4,500 may push the price toward $5,000.
As long as the spot gold price remains below the $5,000 area, the possibility of consolidation before the next long term rally remains high.
In Closing
Gold price remains caught between the strong long term support and short term macro headwinds. The bullish trend in the US Treasury yields and the US dollar may continue to limit gains after the Fed meeting. At the same time, oil prices and developments in the Middle East will remain the key drivers of inflation expectations and market sentiment. These factors are likely to determine the next major move in gold.
From technical perspective, the market is approaching an important breakout point. A move above $4,200 may confirm renewed bullish momentum and open the door toward $4,500. A break below $3,950 could trigger another decline toward the $3,700 area. But any short term weakness may attract renewed demand if safe-haven interest remains supportive.
Read more: Rising Treasury Yields Could Push Gold Toward $3,500