



Gold (XAU) prices remain near the important $4,000 support as high real yields and ETF outflows offset the weaker US dollar and strong central bank demand. In my view, gold may consolidate between $3,950 and $4,200 in the short term but a break above $4,200 could start the next rally. This article examines the key macro drivers, technical levels and market risks that may shape the next move in gold.
Gold Prices Gain Support From Fed Pause and Softer US Inflation
The Federal Reserve kept its policy rate unchanged at 3.50%-3.75% in July. But three officials voted for a 25 basis point rise. The split decision indicates that the inflation is still a concern. But no imminent rate hike provided some short term support for gold.
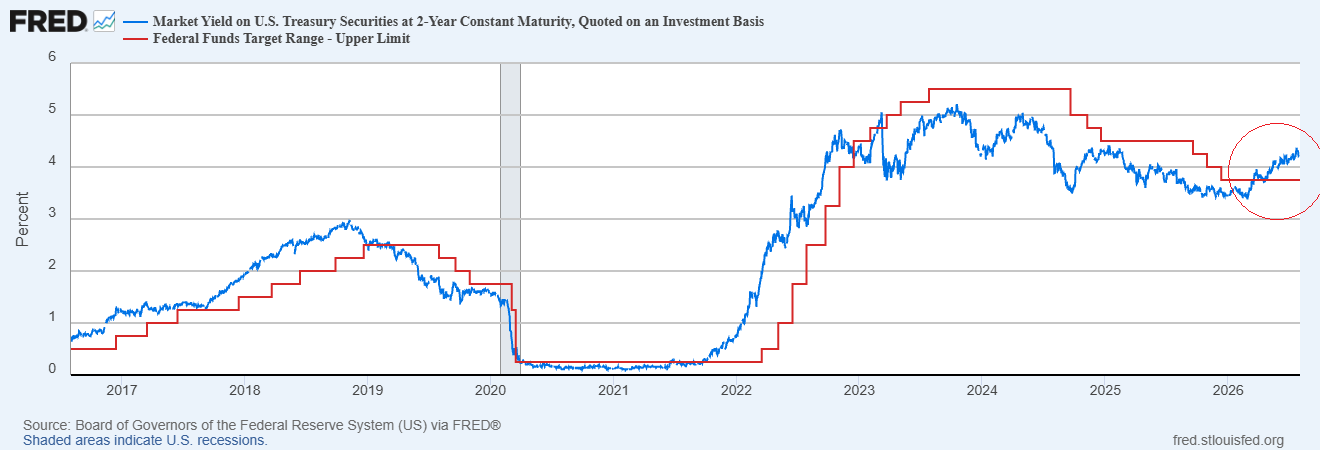
The bond market signals the risk of tighter monetary policy despite the Fed’s pause. The 2-year US Treasury yield increased to 4.23% on July 30. This is almost 50 basis points above the 3.75%. In March 2026, the yield exceeded this threshold and has increased since then. This does not necessarily indicate a rate hike, but it indicates that investors are expecting that rates will be higher or stay higher for longer. This signal may boost the U.S. dollar and interest bearing assets which could limit the gold rally.
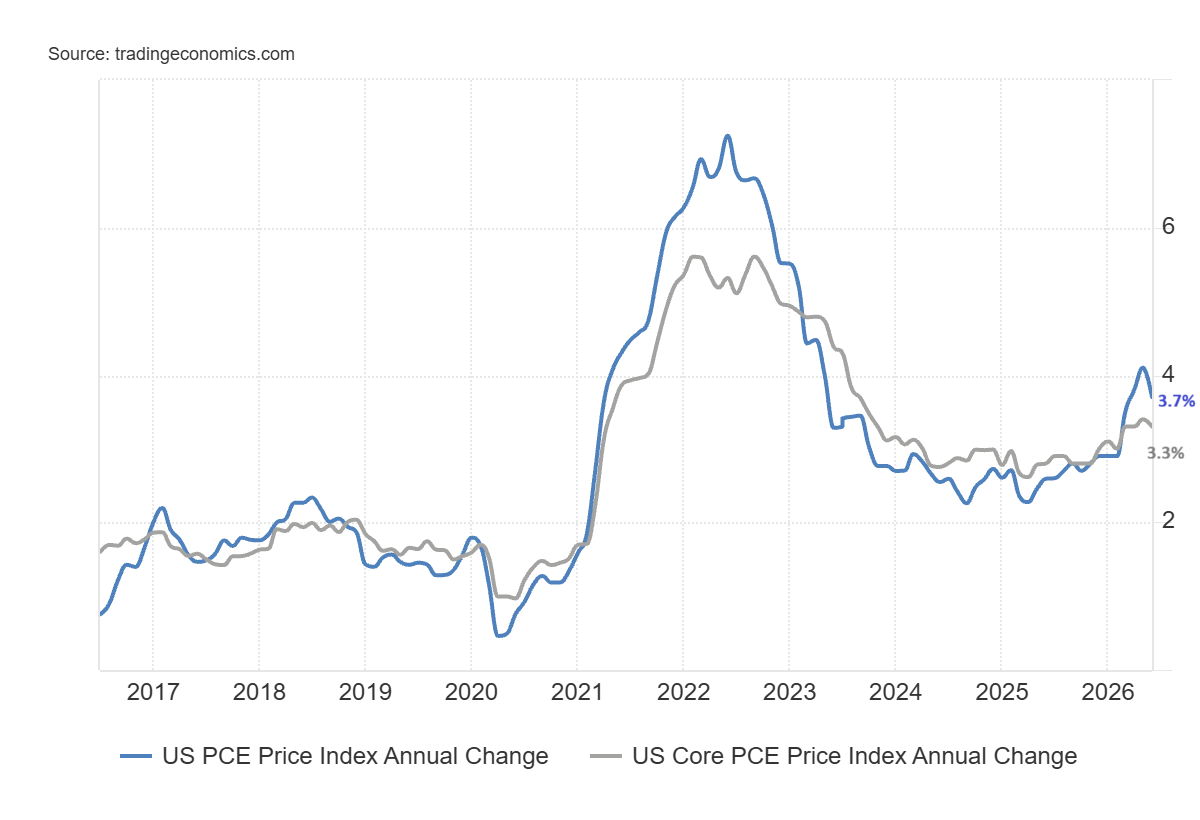
The new inflation data further eased the pressure for a tighter monetary policy. The broad based PCE price index declined 0.1% in June and the core index rose 0.1%. The core reading was below the market forecast of 0.2%. But the annual headline and core PCE inflation rates were still high at 3.7% and 3.3%, respectively. This indicates that the Fed can keep the interest rates high for longer.
The moderate monthly inflation data pressured the US dollar and improved the short term outlook for gold. The dollar index finished July at nearly 99.8 and fell about 1.35% for the month. I think that weakness in the dollar may continue to be a tailwind for another rally in gold, but as long as the country faces high inflation expectations due to the energy crisis, the rallies in gold may be limited.
Gold Price Forecast
Every new Gold analysis as it publishes, today's technical signal and key levels, live price — on one page.
See all Gold forecastsHigh Real Yields and Gold ETF Outflows Limit the Rebound
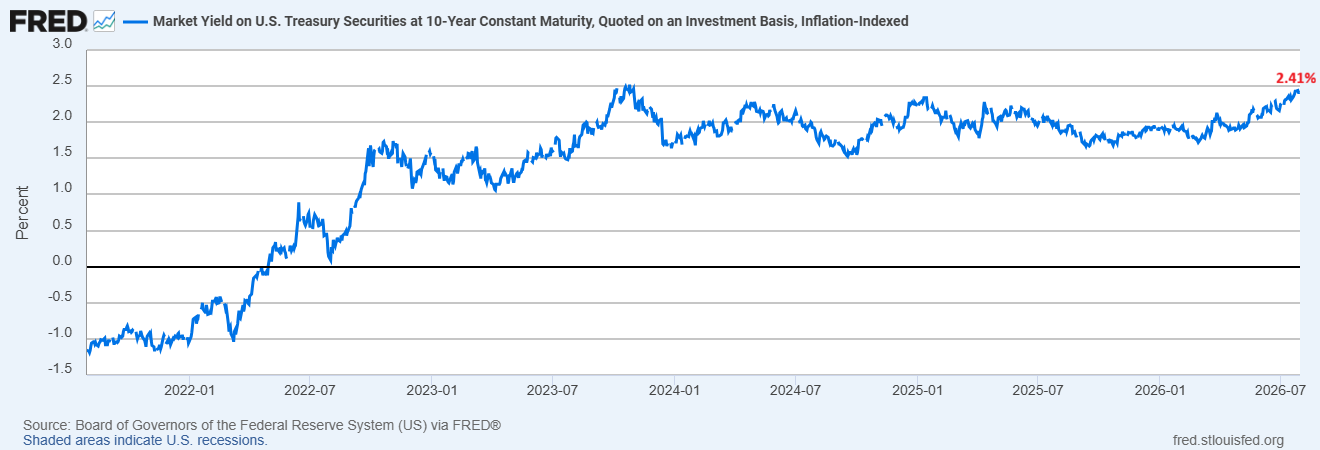
The biggest challenge for gold is still real interest rates. The US 10-year inflation-adjusted Treasury yield remains at 2.41%. The higher real yields make it more costly to hold gold. If real yields start trending downward, the bulls could get more support and if it moves above 2.5%, gold could still experience pressure.
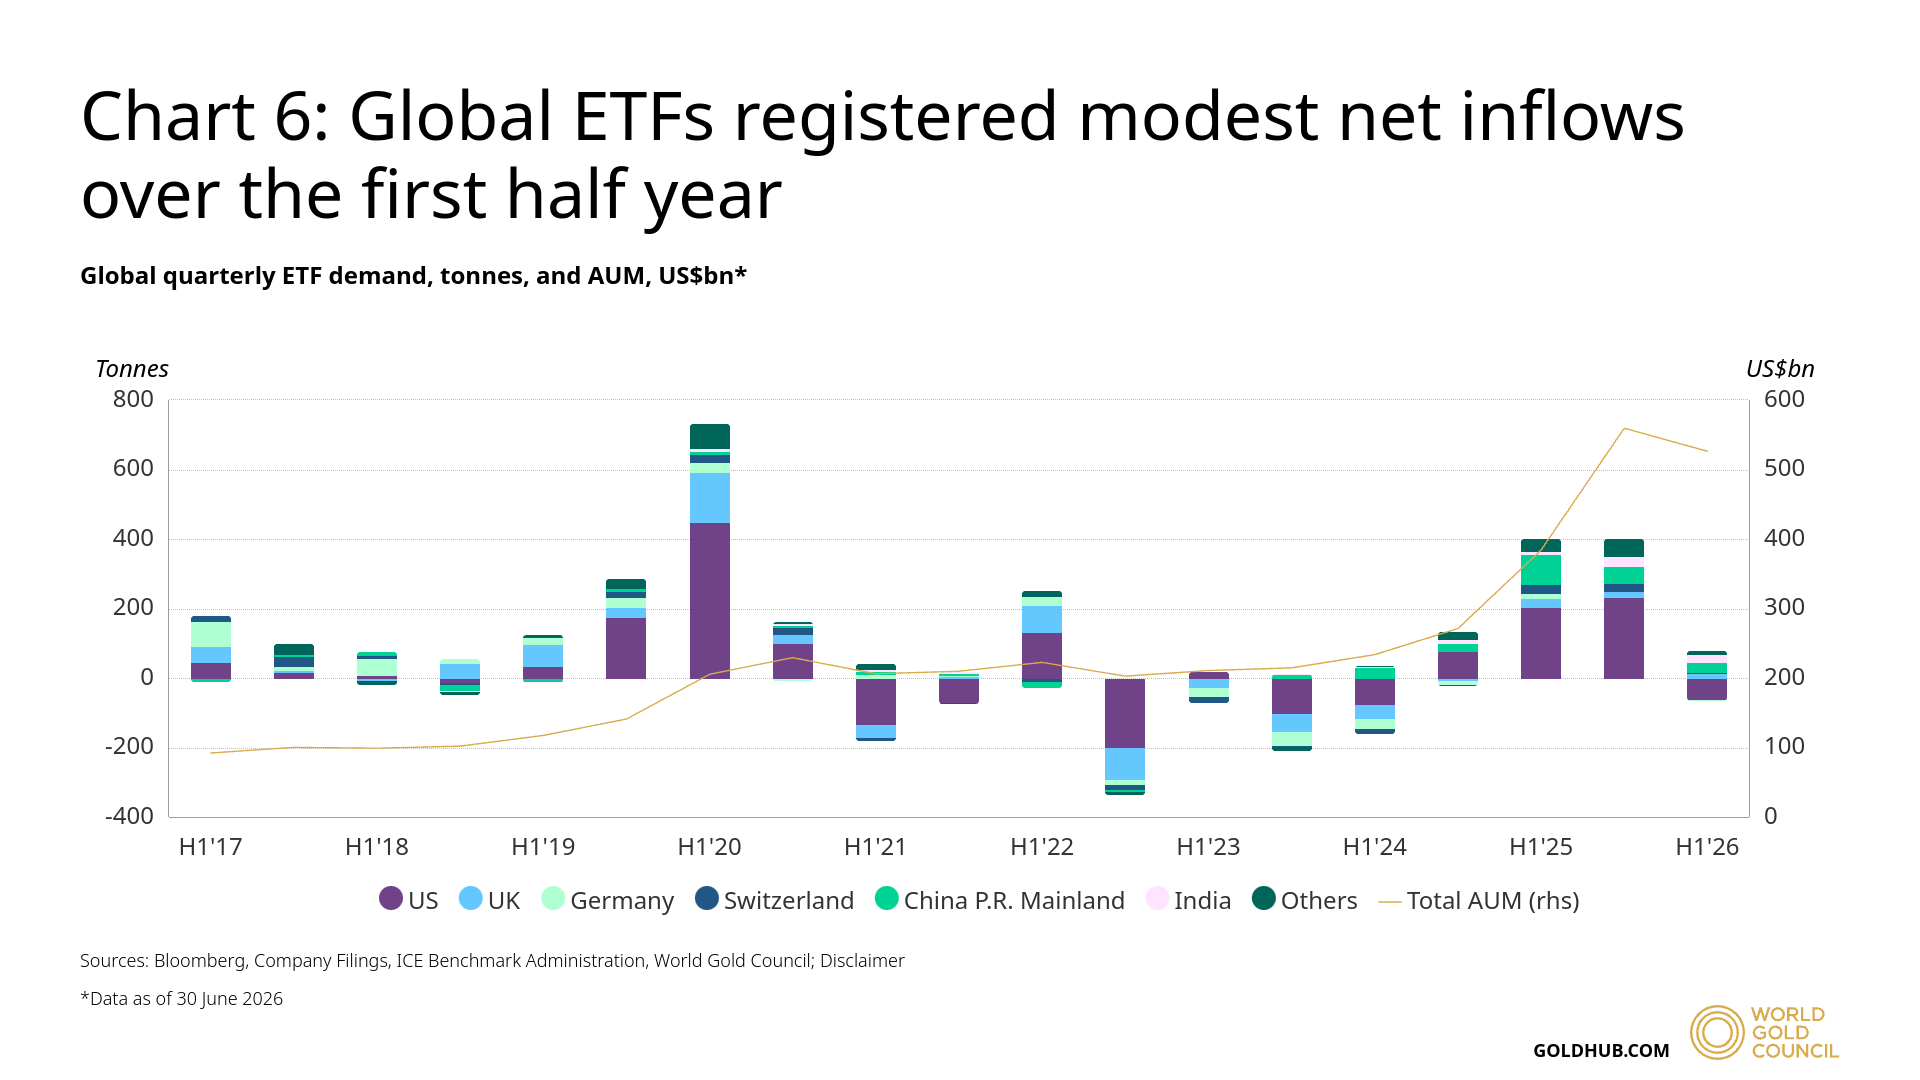
The impact of higher yields is already reflected in demand for investment. Gold-backed ETFs recorded outflows of almost 45 tonnes during the second quarter. Investment demand, excluding over-the-counter activity was 262 tonnes, which is 46% lower than a year before. This is a sign that rate-sensitive investors are not yet ready, even with the overall demand for gold.
But central banks continue to provide the long term support. Their purchases increased significantly in the first quarter and hit a record in the second quarter with 289 tonnes. The total gold demand for the quarter was 1,269 tonnes and for the first half grew by 2% to 2,522 tonnes. It had a record value of $380 billion.
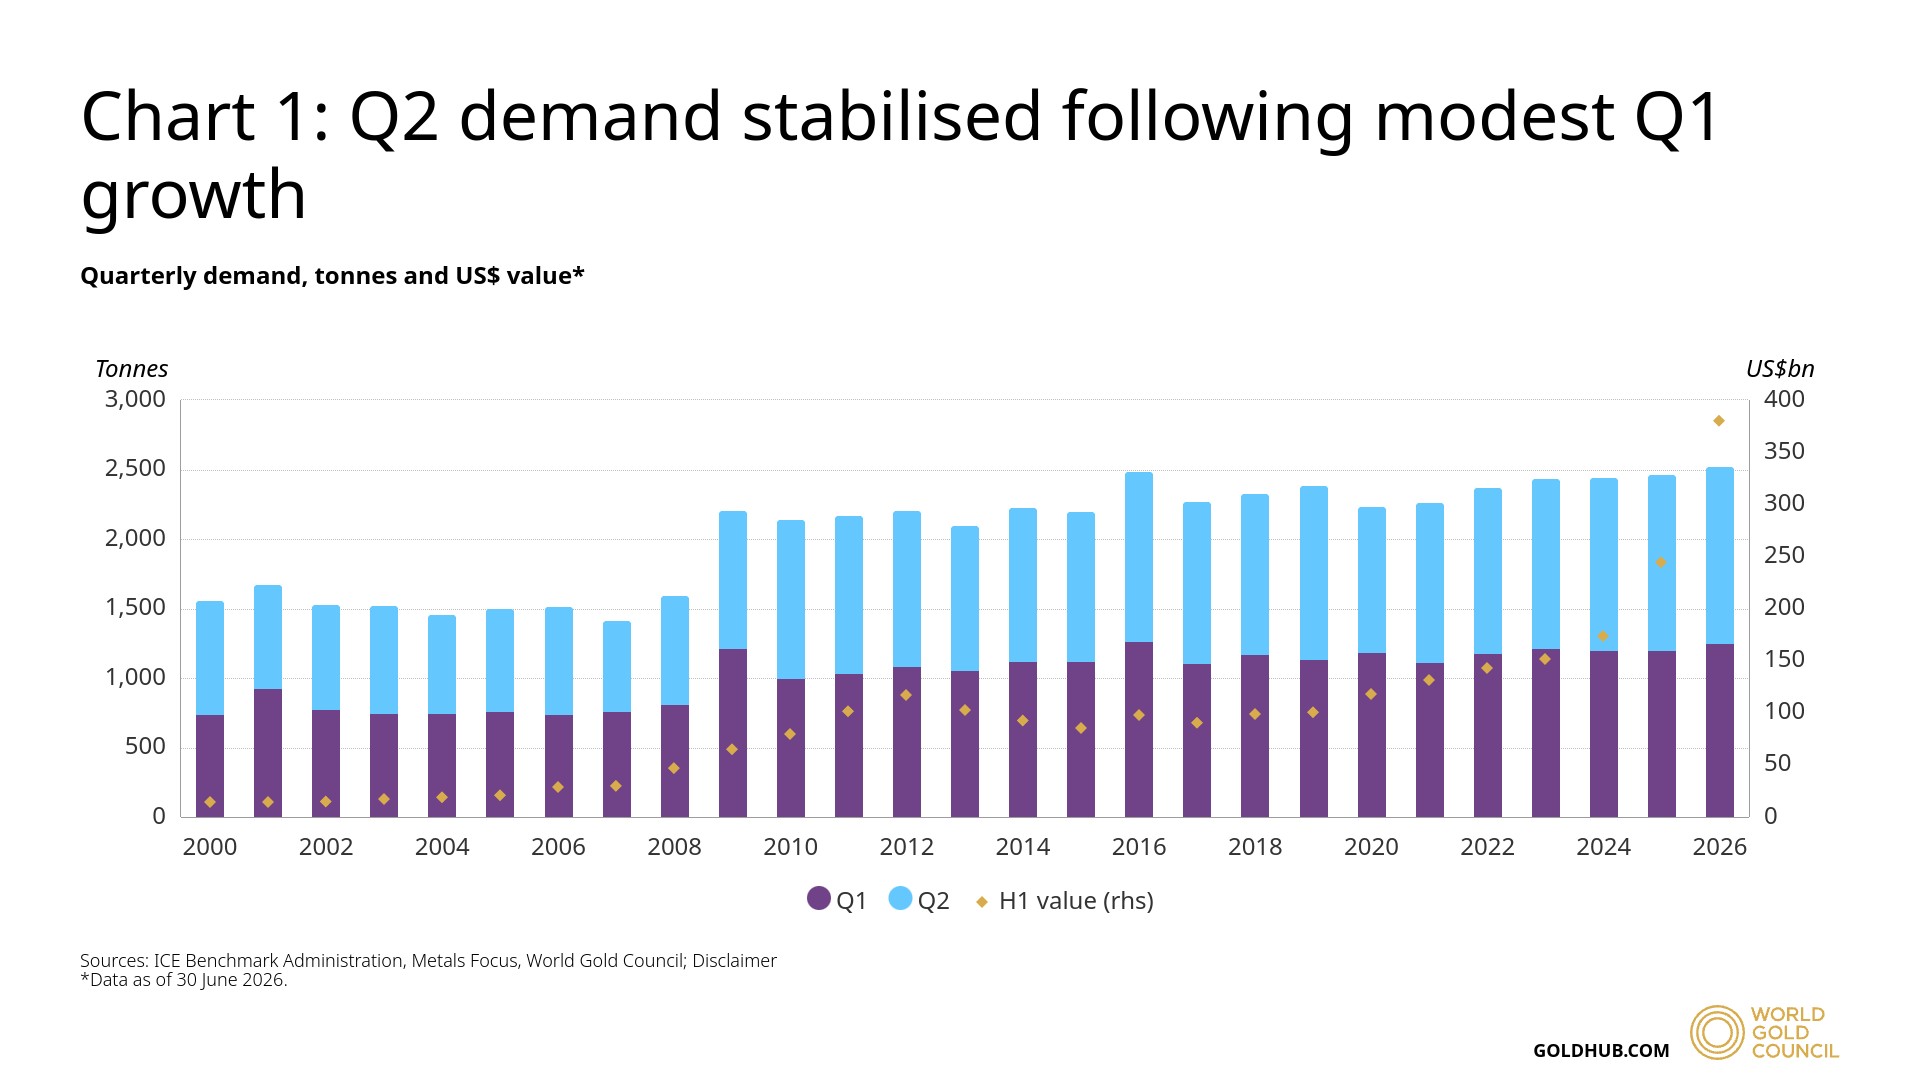
This strong growth in the demand by strong central banks could protect a deeper decline in gold. But less demand from ETFs could moderate the next major rally and create short term uncertainty in the gold market.
Gold Price Consolidates Between $3,950 and $4,200
From a technical perspective, the spot gold price is consolidating at an important support level as seen in the weekly chart below.
The chart shows the formation of ascending broadening wedge pattern that stretches from the October 2023 lows to the January 2026 highs.
The latest surge in January 2026 pushed the gold price to the record level of 5,600. But this rally failed to close the price above the resistance line of the ascending broadening wedge pattern and initiated a correction.
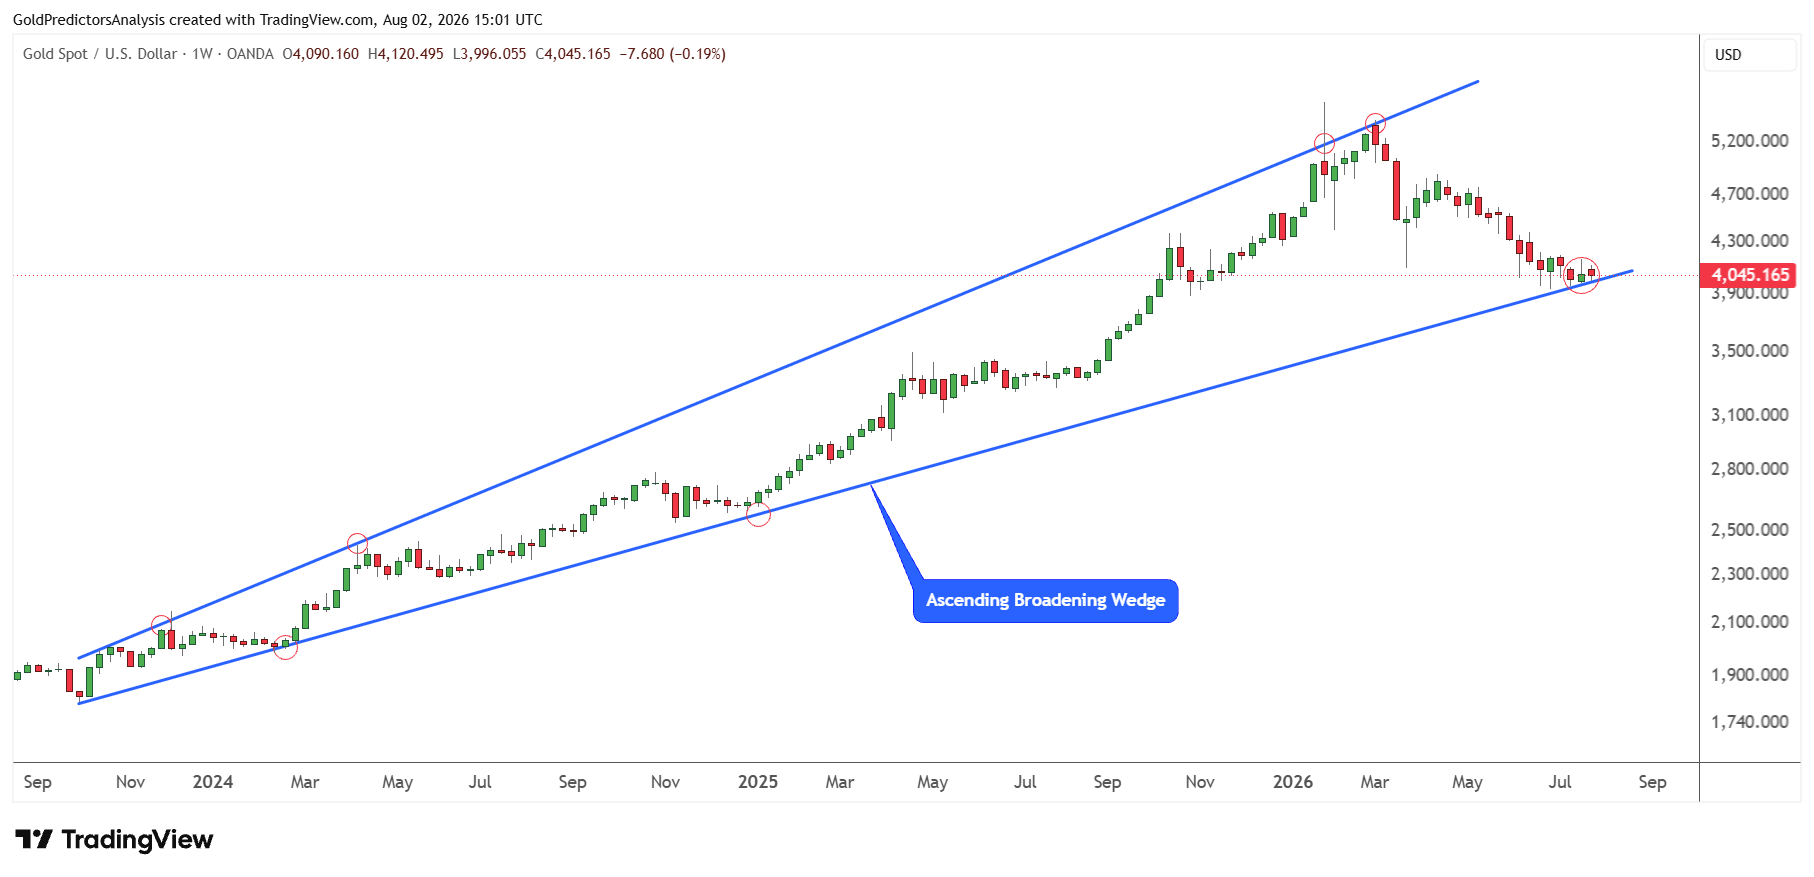
The price has been consolidating at the lower support boundary of this wedge pattern for the past month. This means that a break above $4,200 will likely push prices to higher levels. However, a break below the $3,950 support will indicate a breakdown in prices toward the $3,500 area.
The price consolidation between $3,950 and $4,200 is shown in the chart below. The RSI remains below the mid-level, which increases the possibility of a further drop before the next rally. But if the price breaks above $4,200, it may trigger another rebound to higher levels.
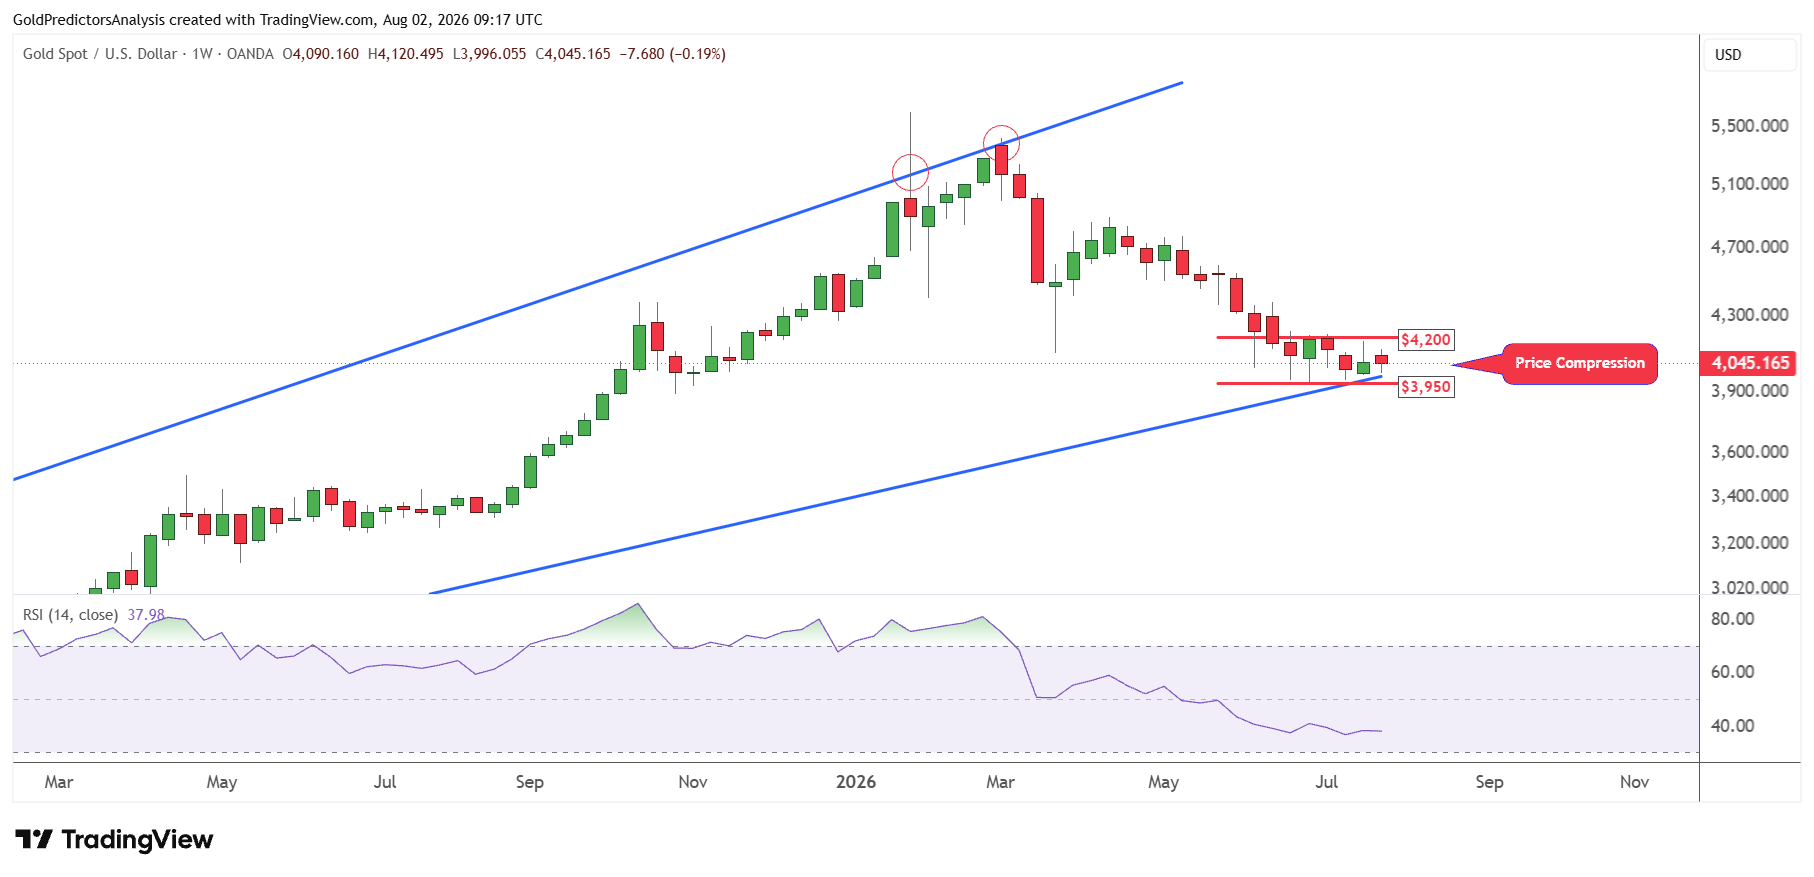
This consolidation represents price compression and a breakout from this range may trigger the next big move.
Gold Price Tests Long-Term Support Near $4,000
The recent consolidation on the weekly chart highlights an important support zone on the monthly chart as seen in the chart below.
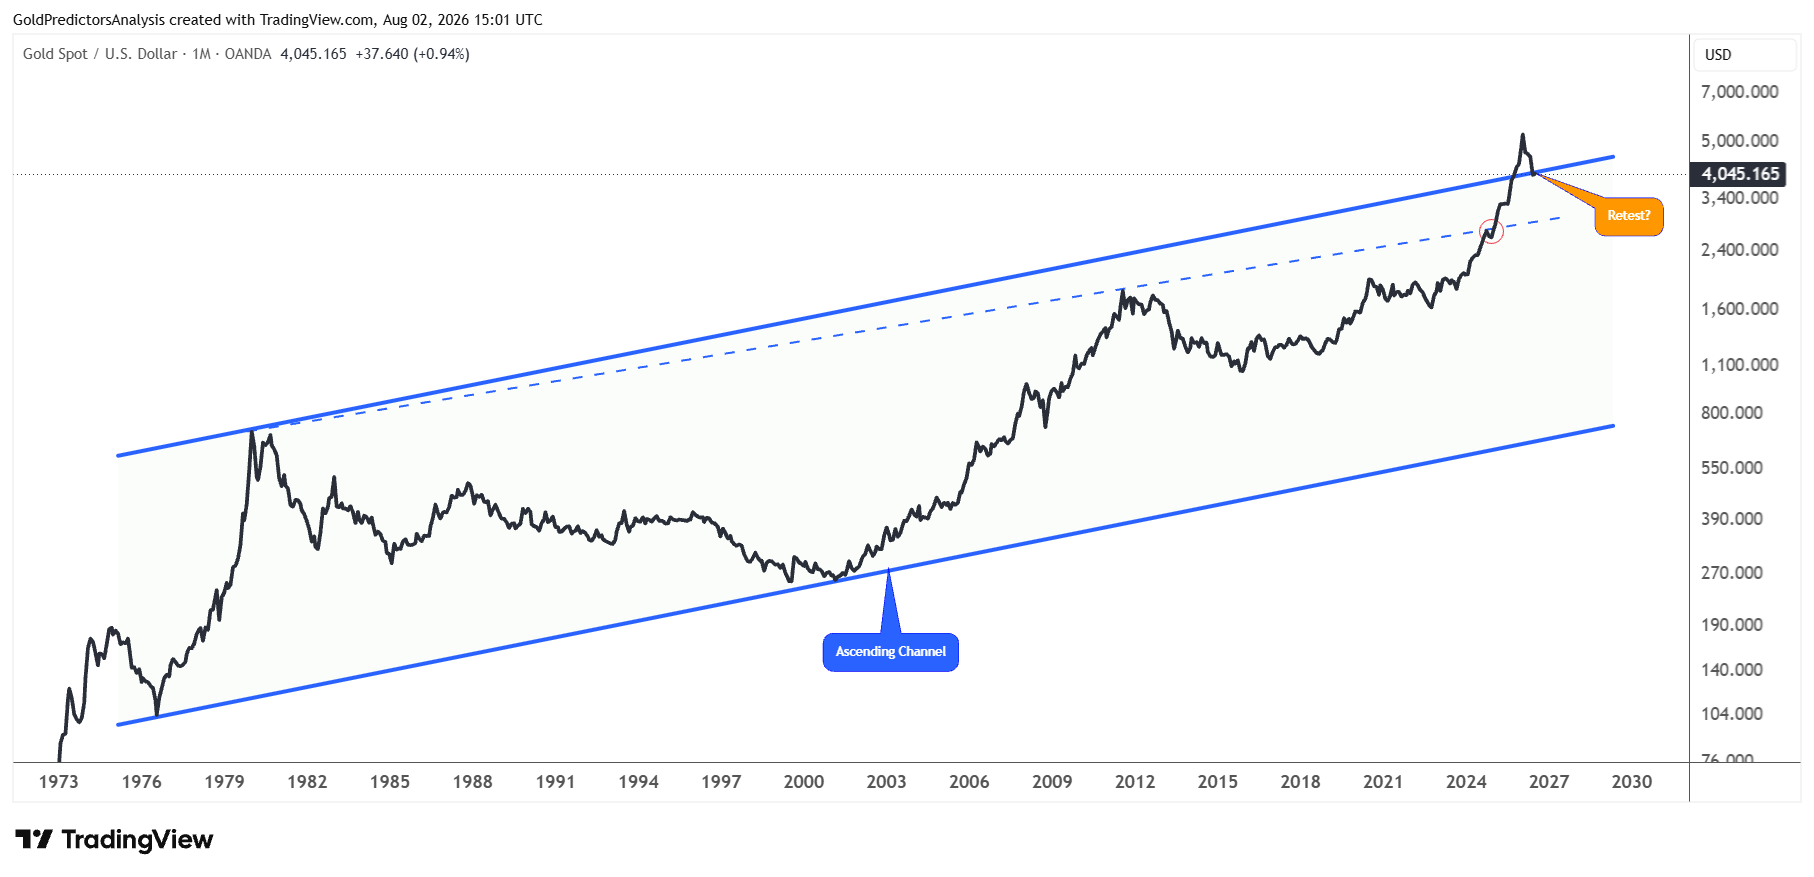
This important support is indicated by the formation of an ascending channel pattern from the lows of 1976. Therefore, it is considered the long term support.
The price broke above the ascending channel pattern in October 2025, initiating an immediate surge that marked a high at $5,600. However, the price has corrected back toward the ascending channel, which lies around the $4,000 area. Therefore, this marks a very important support level in the gold market in 2026.
But July closed right at this support level, increasing the risk and uncertainty around it.
If the gold price drops further in August and recovers to close above this blue trend line, it may mark the bottom for 2026 and initiate a rally in gold prices.
Gold-to-Silver Ratio Signals Continued Pressure on Precious Metals
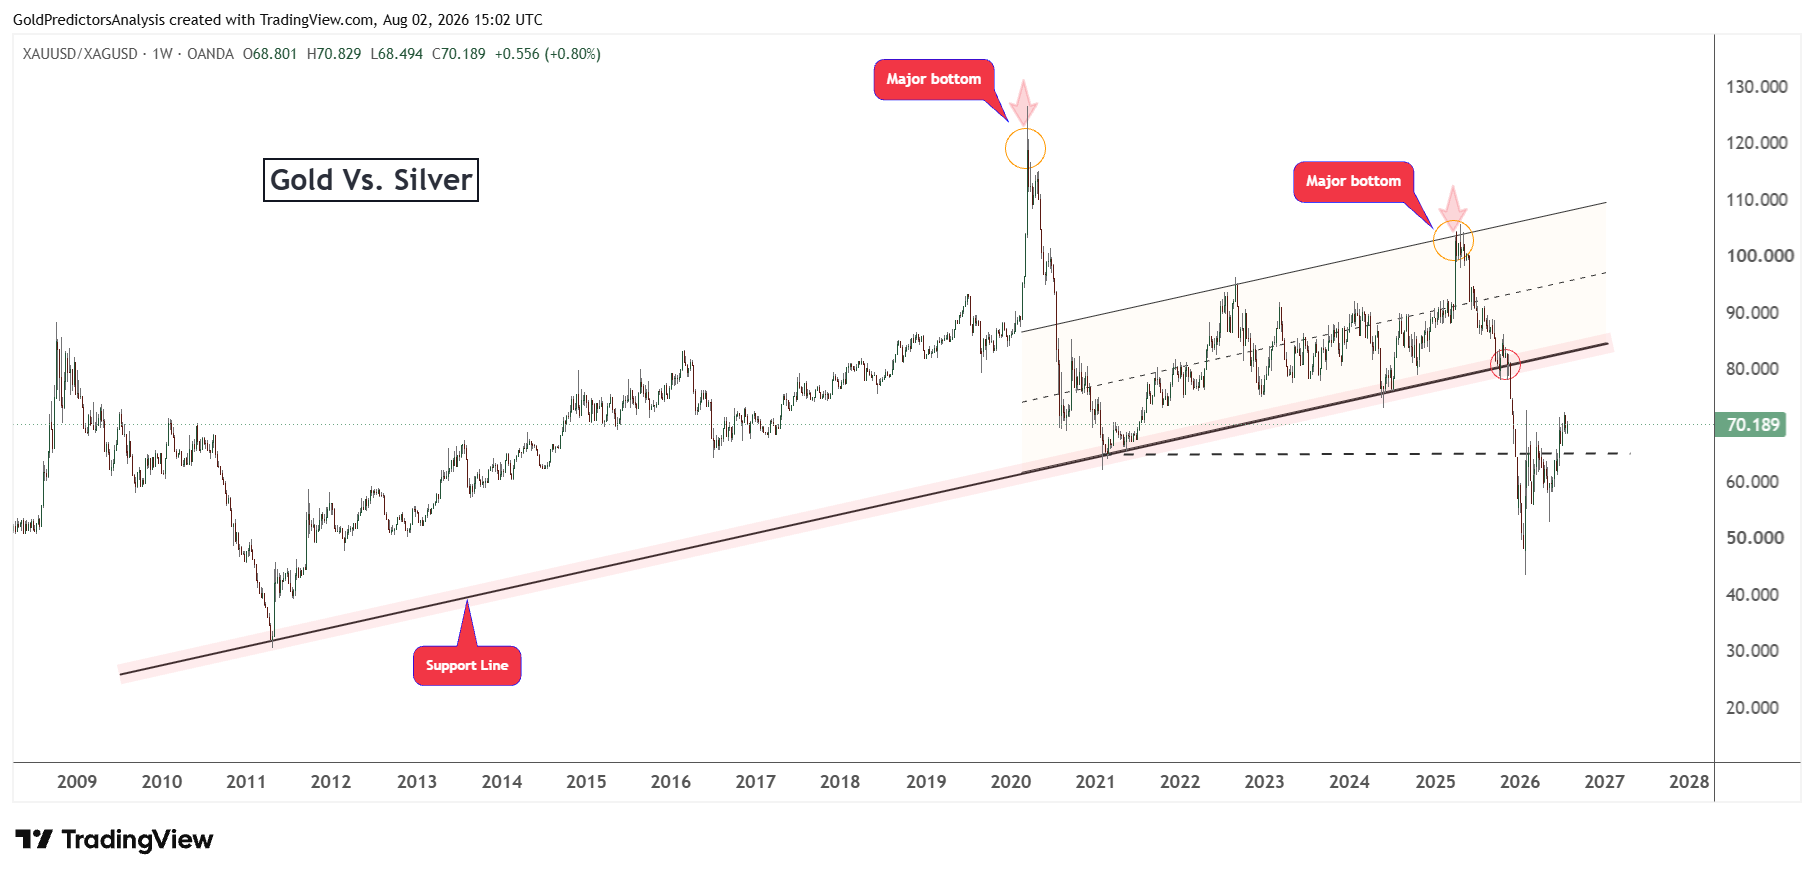
Despite the important support seen on weekly and monthly charts, the gold to silver ratio continues to rally. The ratio produced a bottom at 43.40 in January when both metals produced a record high. Now the ratio continues to rally above the 64 level which keeps the metals in correction.
Further upside in the ratio may continue the correction in the gold and silver (XAG) markets. As long as the ratio continues to rally, the gold and silver prices may remain under pressure. Once the ratio forms a peak and begins to decline, it will confirm that the bottom in gold and silver has formed. But this requires a break below the 64 level in the ratio to continue the decline. A break above 73.50 in the ratio will keep the gold and silver prices under pressure.
Fed Policy and Real Yields Remain the Main Gold Market Risks
The gold market faces risk due to the inflation and the Fed’s reaction. The outcome of the US-Iran war has cast uncertainties in the Middle East and has led to the energy crisis. These crises could continue to keep inflation levels high and necessitate higher Fed interest rates. This could cause a spike in real yields and boost the US dollar. These factors could cause further outflows from the ETF and initiate further decline in demand for gold.
The gold price also faces the technical risk at the support level of gold. If the price breaks down from $3,950, the short term momentum may shift to downside. This pressure would further increase if the gold to silver ratio moves above 73.50. But a decline in real yields or a resurgence of safe haven buying interest could set up the breakout above $4,200.
In Closing
Gold remains supported by the Fed’s decision, the weaker US dollar and strong central bank demand. But the high real yields and continued ETF outflows may limit the next rally. These mixed conditions could keep gold volatile around its long term support near $4,000.
In my view, gold may continue to consolidate between $3,950 and $4,200 in the short term. A break above $4,200 could start another rally while a drop below $3,950 may push prices toward $3,500. A drop below the 64 level in the gold to silver ratio may be the first sign of the gold and silver bottoms.
Read more: Rising Treasury Yields Could Push Gold Toward $3,500