


Gold (XAU) dropped sharply in March as investors rushed to reduce risk even though inflation pressures and geopolitical tensions remained high. In my view, this move reflects liquidity driven selloff rather than a change in the long-term bullish trend. This selloff points to a period of consolidation before the next move higher. This article presents the key macro drivers, positioning trends and technical levels shaping the outlook for gold.
Macro Drivers: Liquidity Shock, Inflation, and Geopolitical Risks
Liquidity Shock Triggers Gold Selloff Despite Safe-Haven Demand
Gold did not fall in March because the long-term story has suddenly become bearish. It collapsed due to the shift to a deleveraging mode in the markets. When that occurs, then the investors tend to sell what they can sell, rather than what they would prefer to sell. Gold is a highly liquid asset in the world, and it can be hit even when the overall background appears favourable. This is what has happened here.
Gold declined by 11.57% in March to $4,100 per ounce, the biggest drop since June 2013, despite geopolitical pressures and inflation anxiety remaining high. The selloff was primarily due to momentum-generated pressure, such as global ETF outflows, a COMEX net long unwind, and a reversal in trend.
This is important because it alters how the move is to be interpreted. The March weakness was not a rejection of the bullish gold thesis. It was rather an imposed change of positions. This is the reason why the fall was so sharp and seemed counterintuitive on the surface. During stressful times, liquidity requirements might prevail over fundamentals in the short term. Gold is still vulnerable to such a movement, particularly when investors are reducing risk on a number of assets simultaneously.
ETF Outflows and Futures Liquidation Weigh on Gold Prices
The largest indicator was the funds flows. According to the World Gold Council, global gold ETFs declined by $12 billion or 84 tonnes in March with nearly all the pressure being exerted by North America and Europe. US outflows reached out to $14 billion in North America alone and Europe also recorded losses. Asia was the only exception, and registered US$1.9 billion in inflows.
Gold Price Forecast
Every new Gold analysis as it publishes, today's technical signal and key levels, live price — on one page.
See all Gold forecasts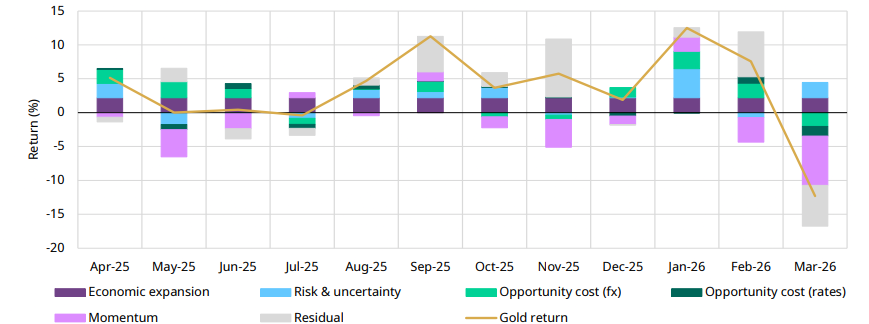
This confirms that the dip buying demand exists but it was not significant enough to counter the significantly bigger wave of Western selling. The money net long positions of COMEX declined by $2 billion. That verifies that speculative positioning was also against gold in the month.
This data shows the reason for the heavy price action in March 2026. ETF outflows represent a withdrawal of a major source of investment demand, while long liquidation in futures adds pressure from the positioning side. A declining market destroys sentiment, less sentiment leads to increased selling and the selling subsequently intensifies the move. This feedback loop explains why March turned into such a bad month for gold despite the larger macro picture not entirely shifting against it.
Oil Prices, Iran War Risk, and Inflation Keep Gold Supported
Simultaneously, the geopolitical and energy context also warns that it is prudent not to be overly bearish on gold. The Iranian crisis has not resulted in a clean solution. The news indicates that the White House still feels there is a possibility of a deal and President Trump has indicated that the war can be coming to an end, although there is no clear indication that the war really is over.
The flow of crude shipments across the Strait of Hormuz is close to zero. Brent crude is still around $95 per barrel and the destruction of energy infrastructure in the region is still high. The headlines are full of noise but no indication yet that the crisis is over.
This background is important to gold since the persistence of oil strength can simultaneously maintain inflation pressure and burden growth. Therefore, the market continues to be at risk of stagflation. That tends to favor long-term investment in defensive investments such as gold.
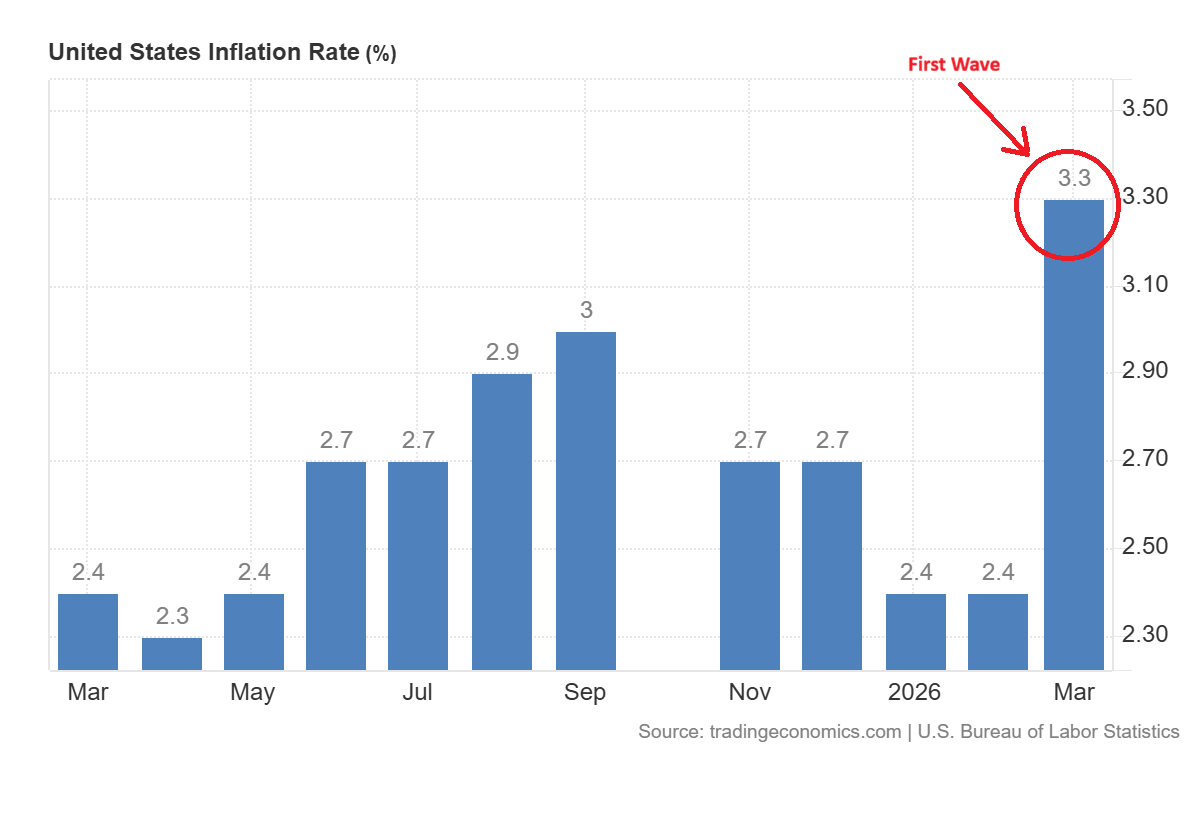
The first wave of inflation has already been observed in the consumer price index which surged to 3.3% in March 2026.
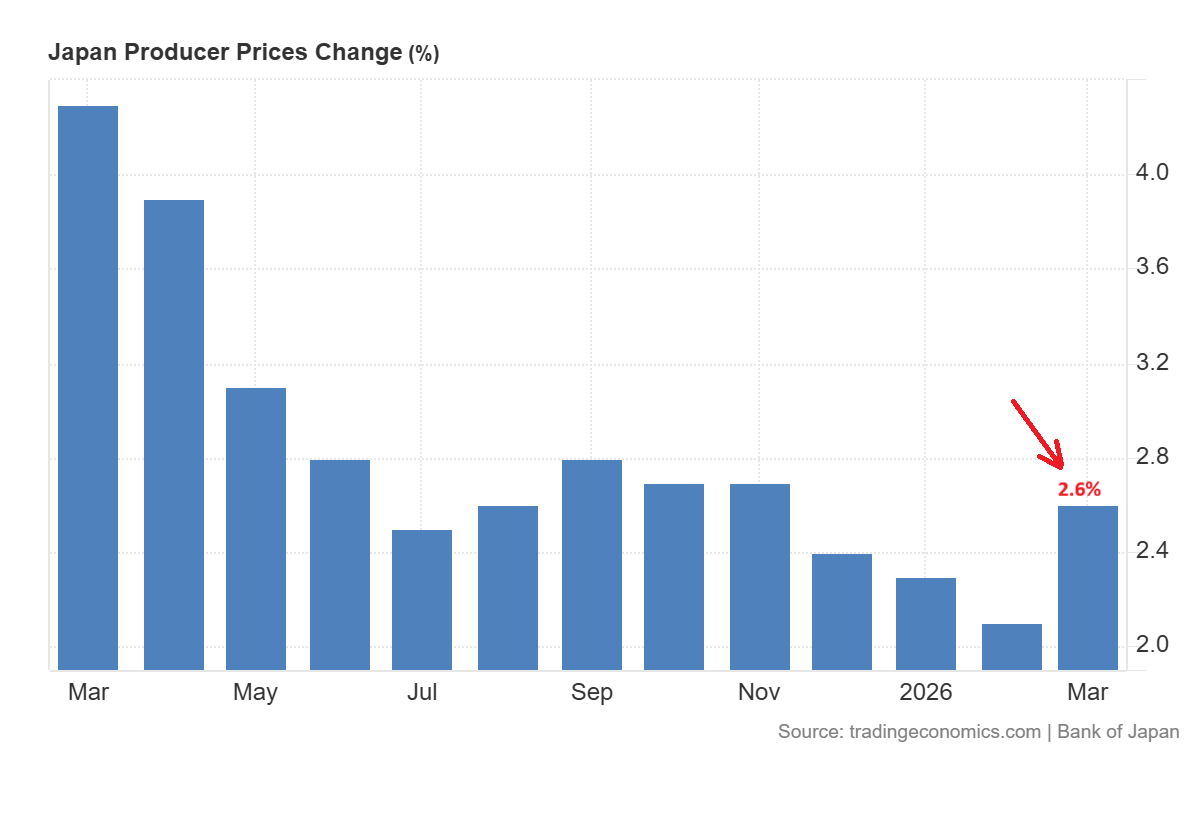
On the other hand, the producer prices also showed strong gains.
The increase in CPI can ultimately damage the demand and constrain the pass-through to core inflation. When this scenario occurs, the Federal Reserve might appear to be tough initially but later markets might deflate such rate anxieties and revert to a more dovish stance. That would once again improve the medium-term case for gold.
Gold Technical Analysis: Bullish Structure Signals Further Upside
The technical outlook for the gold market remains strongly bullish and healthy, as seen in the monthly chart below. The chart shows the parabolic curve that has been emerging in the gold market over the last four decades.
The price development from the 1980s high towards the 2000 bottom, and then the 2011 peak to the 2023 breakout, has formed a strong bullish price structure. This structure was broken in 2024 to trigger an unstoppable rally.
The chart shows the formation of the cup and handle pattern from the 2011 highs to the 2023 breakout. This cup and handle formation just below the key line and then the breakout above the key at $2,500, indicates that the gold market will remain strong for the next few years.
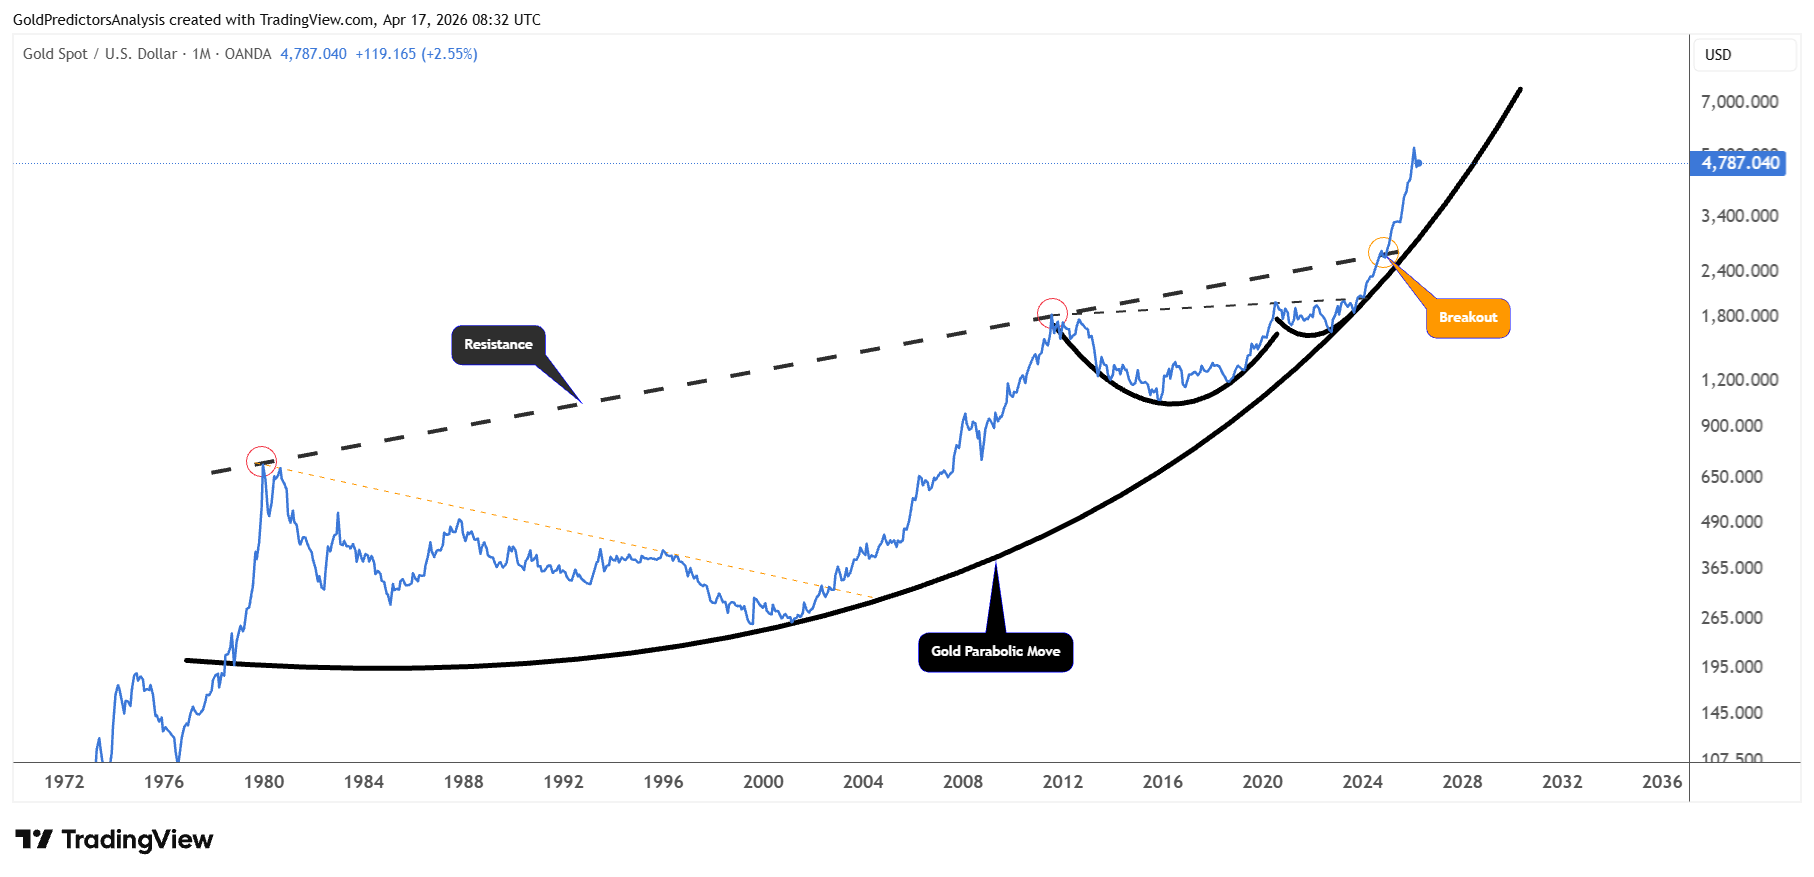
The recent correction in gold from $5,600 to $4,100 is quite minimal and healthy. It does not break anything on the long-term chart. This pullback will further strengthen the bullish outlook and initiate another rally towards $6,500 in the next few months.
The price action for March 2026 shows 24.36% drop, as seen in the chart below. The chart confirms that this drop did not result in any close below $4,400 for even a single day and hit $4,100 as the key level.
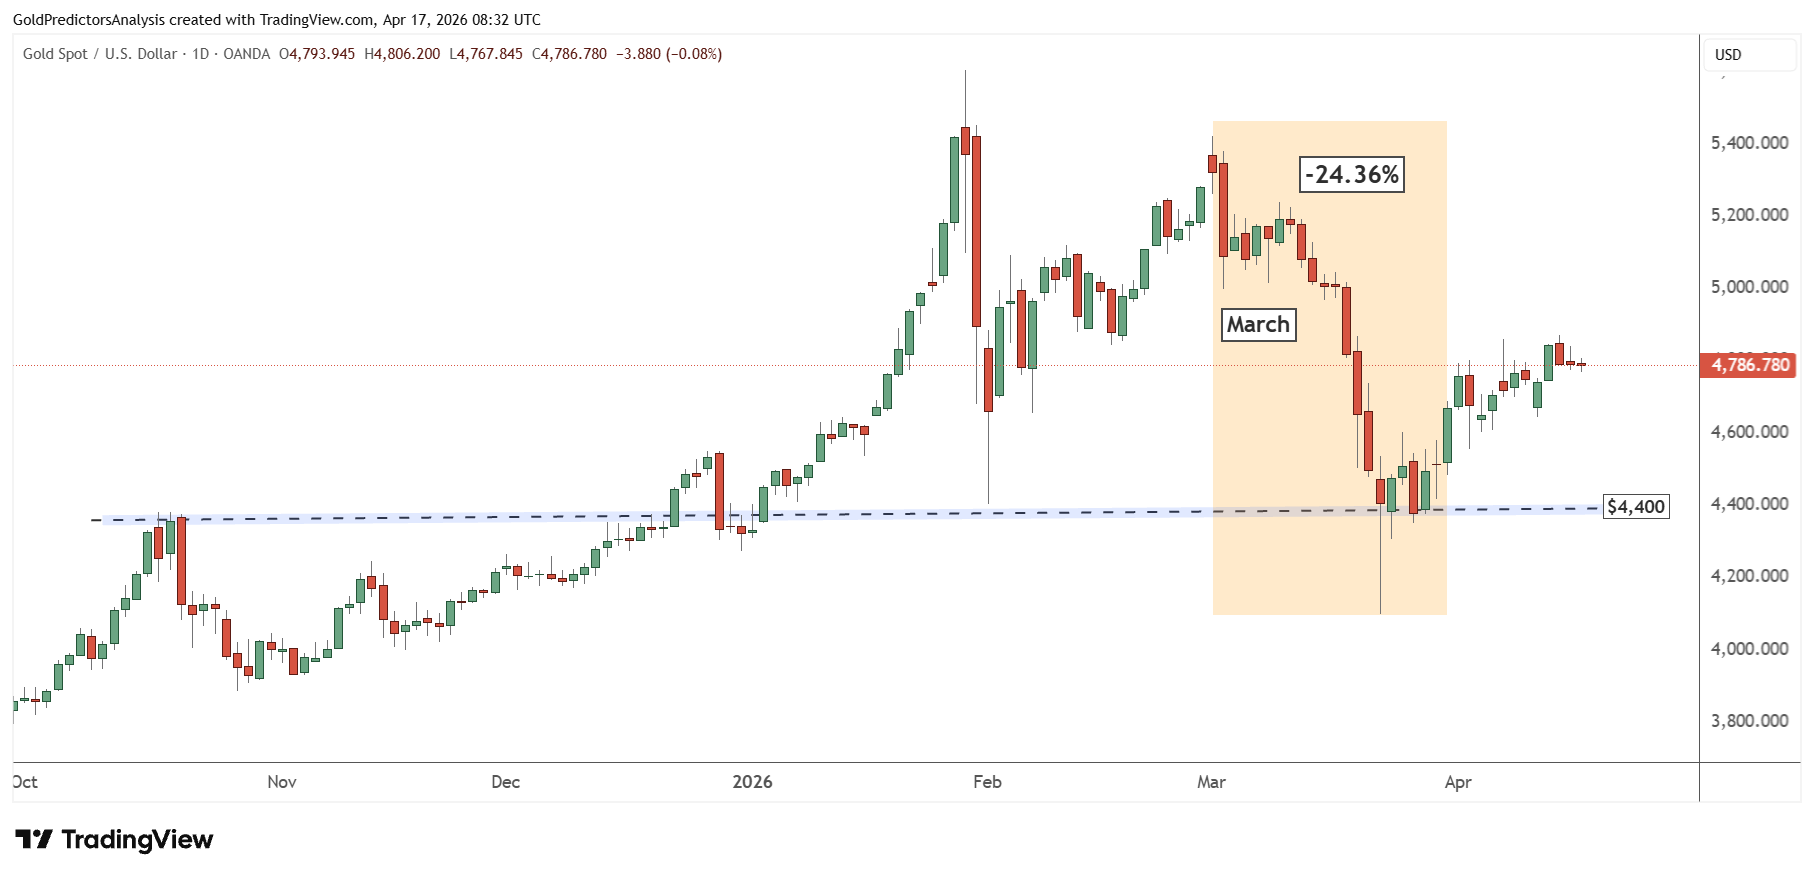
The reversal from the key and failure to close below $4,400 indicate that gold has formed a strong bottom at this level. This bottom will likely take prices higher. However, the strong rallies in 2024 and 2025 will likely produce a consolidation pattern over the next few weeks before the next breakout.
Cross-Market Signals: Stocks, Yields, and Dollar Shape Gold Outlook
The current gold environment is also framed by other significant markets. The S&P 500 has surged above 7,000 and established a higher mark and this is an indication that risk appetite has not fallen apart.
On the other hand, the Dow Jones 30 is still lagging which indicates that the equity signal is not yet fully confirmed.
In the meantime, the 10-year Treasury yield failed to break support at 4.3%. The repetitive retracements indicate reluctance. The target for US Treasury yields remain 4.60%.
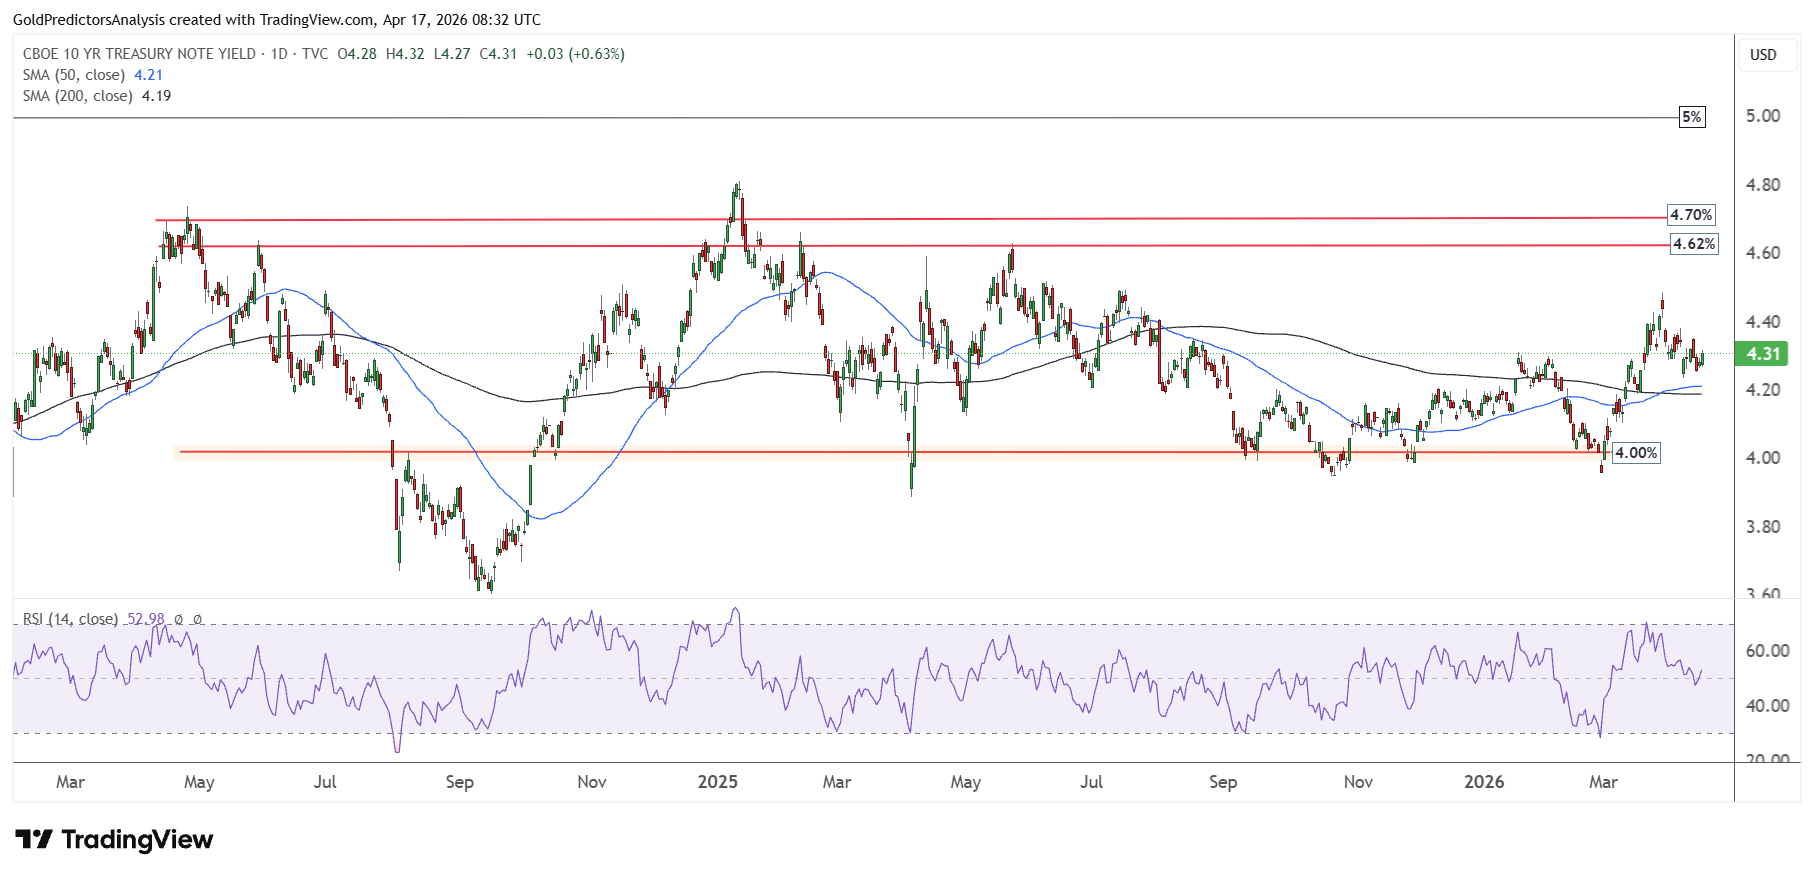
These indications imply that gold is in a transition stage. A powerful wave of liquidation has already struck the market, but the macro setup is not entirely disintegrated. Indeed, there are initial indications of stabilisation. The April ETF inflows are now positive. The options markets are near-term hedging demand, but they remain more optimistic over the longer term. Early signs also point to renewed physical and wealth-management buying with prices above key technical levels.
That does not eliminate the possibility of another wild ride if oil prices surge above $100 over an extended duration. However, it does indicate that the March crash was more probably a liquidity phenomenon than the beginning of a sustained bearish run.
Risk Analysis
The greatest risk to gold in the short term is another series of deleveraging. The March move demonstrated the speed at which prices can decline as investors scramble to de-risk. Markets could experience new liquidity pressures in case oil prices remain elevated or volatility increases. Then, investors might resell gold again to obtain cash.
An increase in yields would place an additional burden particularly when the 10-year Treasury returns above critical points. An appreciation of the US dollar would also be a headwind and restrain gold. A break above 100.50 in US dollar index may put additional pressure on the gold price.
A change of the macro narrative is another risk. If the conflict is calmed down sooner than expected, oil prices may plummet. It would decrease the pressure of inflation and undermine the argument of using gold as a hedge. Meanwhile, the presence of strong equity markets could still encourage capital flight out of defensive assets. If ETF inflows fail to sustain and positioning turns negative again the recent stabilisation could fade. This would probably send gold into further consolidation before it goes up again.
Final Thoughts
Gold remains in a healthy long term upward trend despite the severe correction in March. The recent decline was a result of liquidity pressure rather than a shift in the underlying fundamentals. A big wave of selling has already been absorbed in the market and the indications of stabilisation are already beginning to show. ETF flows have become positive and demand is gradually rebounding as prices are staying above key levels. Its macro environment, which is fuelled by inflation risk and geopolitical uncertainty, still favors gold in the medium term.
In the short run, gold may be in a consolidation stage until the next upward breakout of $4,900. The market will take time to reposition itself following the recent liquidation. The entire structure will be bullish as long as the critical support level of $4,000 holds. In my opinion, the longer-term direction for gold remains healthy and a new upsurge is possible when the present volatility subsides. But any change in liquidity conditions, yields, or the dollar can postpone the move and prolong the consolidation period.
If you’d like to know more about how to trade gold and silver, please visit our educational area.