


The rally in oil prices is reigniting concerns about inflation, and that has led to higher Treasury yields, weighing on the gold price. Brent crude oil has passed $105 and is heading towards $110, and that has altered the market’s response to the Persian Gulf crisis. Typically, geopolitical risk provides a safe-haven bid for gold. But this crisis is first affecting the oil market, which means that inflation and yields are more significant in the short term.
I believe that gold could test the $4,400 to $4,500 support area before attracting fresh buyers. This article presents how oil prices, Treasury yields, the U.S. dollar and the gold-to-oil ratio are setting the tone for the next moves in gold.
The Bigger Picture Behind Gold’s Weakness
Oil Breakout Revives Inflation Pressure
Brent crude oil has broken above $105 and is testing the $110 area. The move is significant because oil is again becoming key global inflation driver. It also shows that markets expect the conflict to continue as negotiations in the Persian Gulf have stalled.
This is bad news for gold. Normally geopolitical risk would boost safe-haven demand. But this is a crisis that is first affecting the oil market due to the supply shock in the Strait of Hormuz. Rising oil prices lead to higher inflation expectations, which lead to higher long-term Treasury yields. The higher yields put pressure on the gold price.
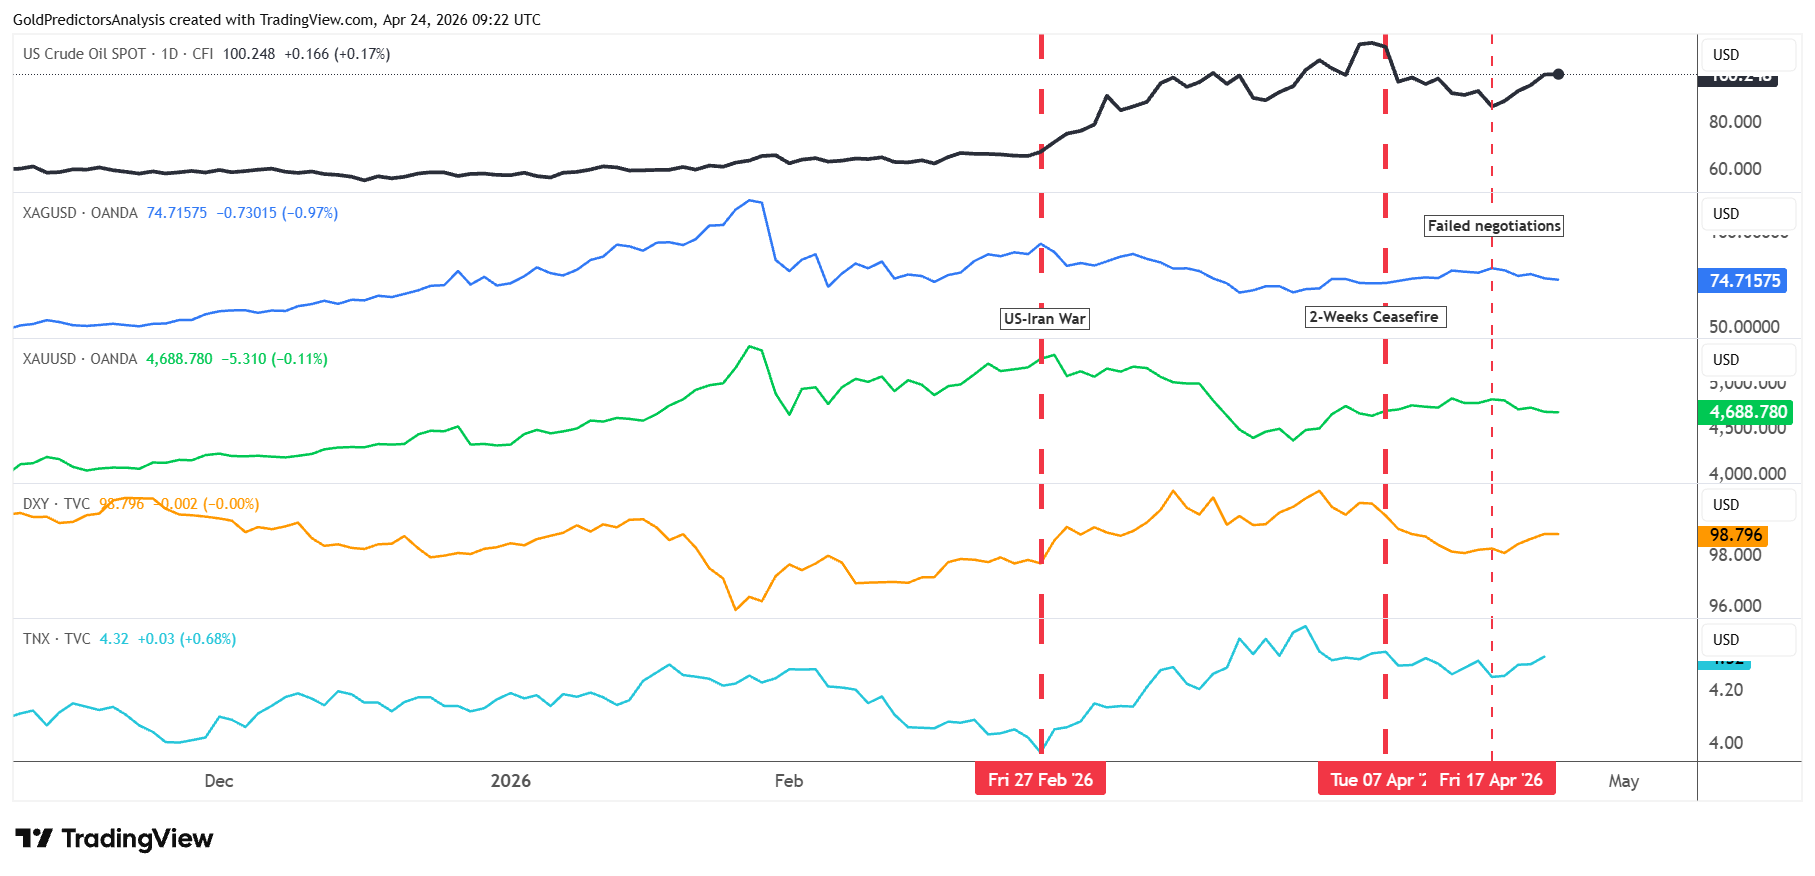
The chart below shows that the oil is trading opposite to gold since the US-Iran war began. The rise of oil prices keeps the US dollar and US Treasury yields positive which pressure the gold and silver (XAG) prices.
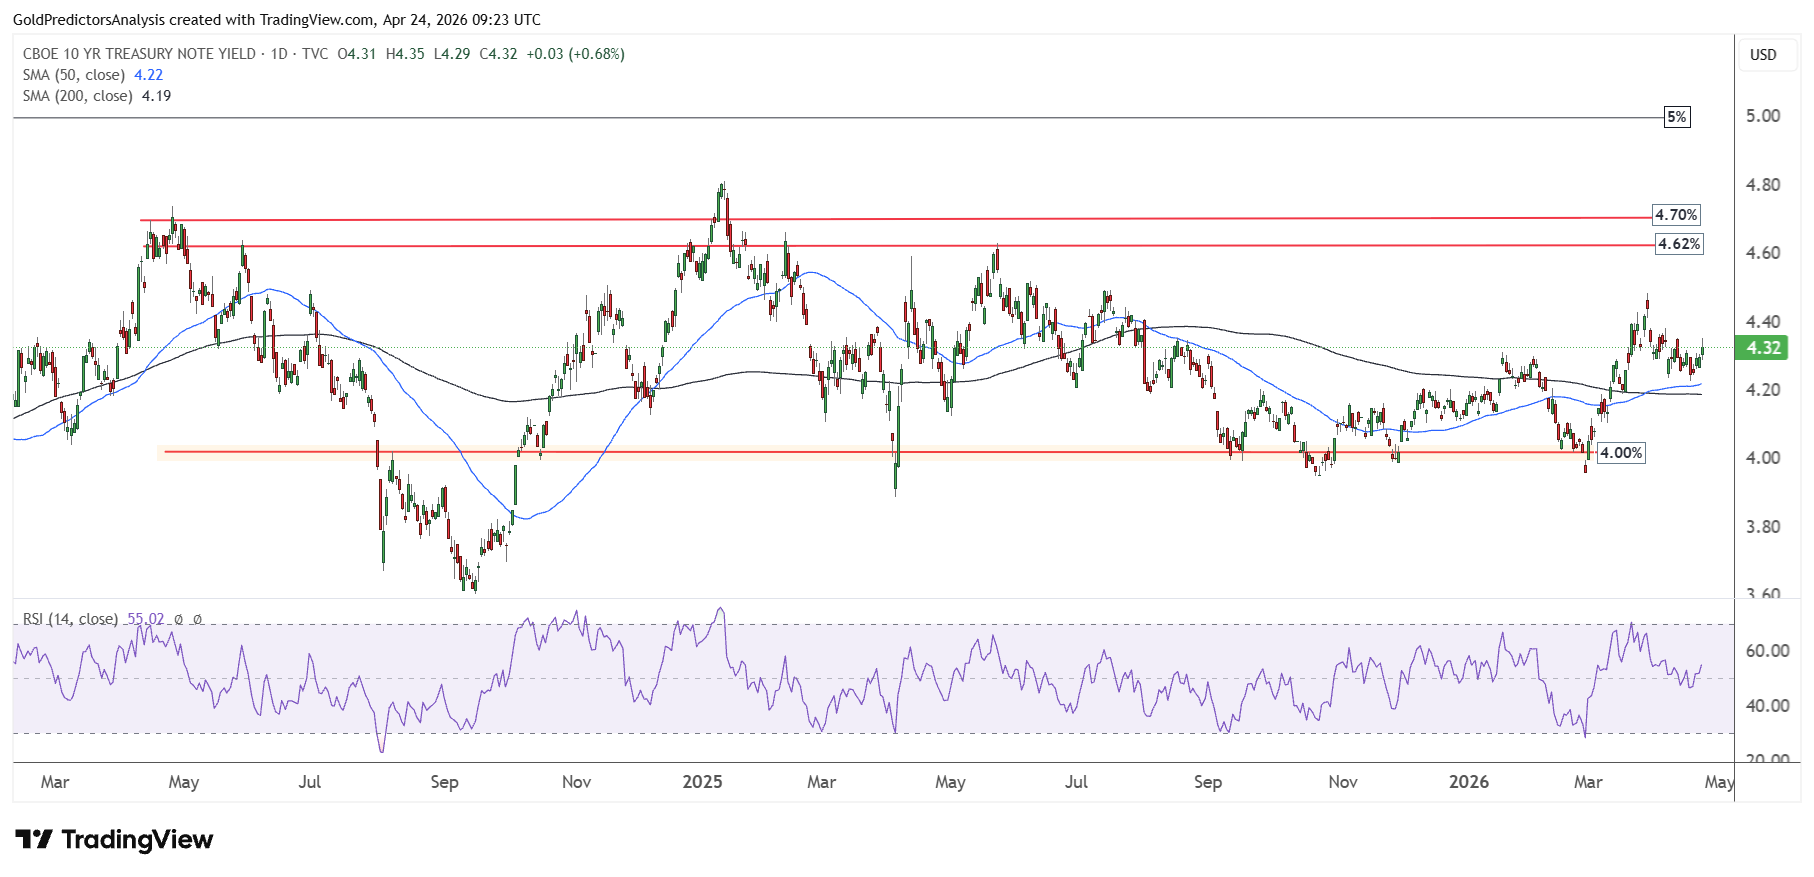
The 10-year Treasury yield has already rallied to 4.48%. A correction from the 4.48% has found strong support at the 4.3%. Now the yields is going to 4.5% in the next few days. This is the major bearish path for gold. Higher long-term yields can still cap gold’s gains even if the U.S. dollar depreciates. For the moment, the yield market is sending the signal that the oil shock may sustain inflation.
Gold Price Forecast
Every new Gold analysis as it publishes, today's technical signal and key levels, live price — on one page.
See all Gold forecastsFed Liquidity and Dollar Signals Create a Mixed Setup
The Federal Reserve has also added another layer of setup. The Fed has been increasing its balance sheet by buying short-term T-Bills since it switched policy in December 2025. This is not QE because these purchases have little effect on long-term yields. But the $170 billion has provided financial market stability following the repo market disruptions late last year.
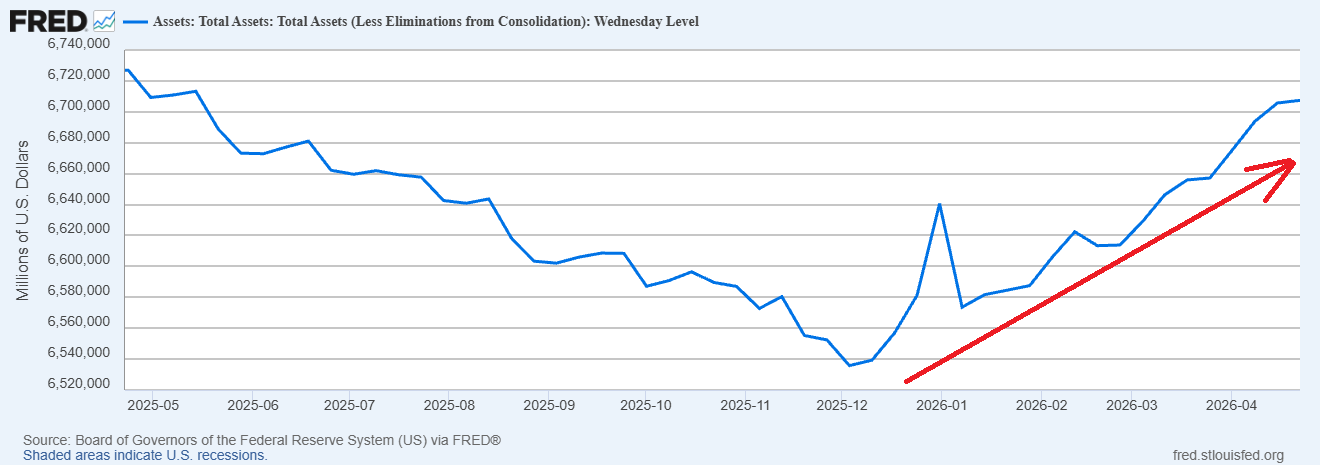
This is why risk assets have held up despite the oil shock. But it does not take the pressure off gold. If the liquidity support buoys equities but oil drives up yields, the safe-haven premium for gold may be reduced in the short run. This makes the macro environment mixed and not necessarily bullish.
The other signal comes from the U.S. Dollar Index. The dollar is currently rebounding from the support around 98. A break below this level will lead to long-term support near 96. On the other hand, a break above 100.50 is required to change the US dollar bearish story. In the current environment, long-term interest rates are more important.
I believe this macro environment suggests a short-term test of gold downside around $4,500 per ounce. The precious metal may continue to trade sideways until there is more clarity on the Persian Gulf situation. Gold could remain under pressure if oil continues to rise and Treasury yields continue to move higher. But if yields don’t break to the upside or if the dollar breaks to the downside, gold may find support a bit sooner and resume its momentum.
Technical Picture Is Constructive
From a technical perspective, the gold price failed to break above $4,800 and continues to drag lower. Overall, the price is trading in a consolidation zone between $4,500 and $4,900. A break of this range will take prices in the next direction.
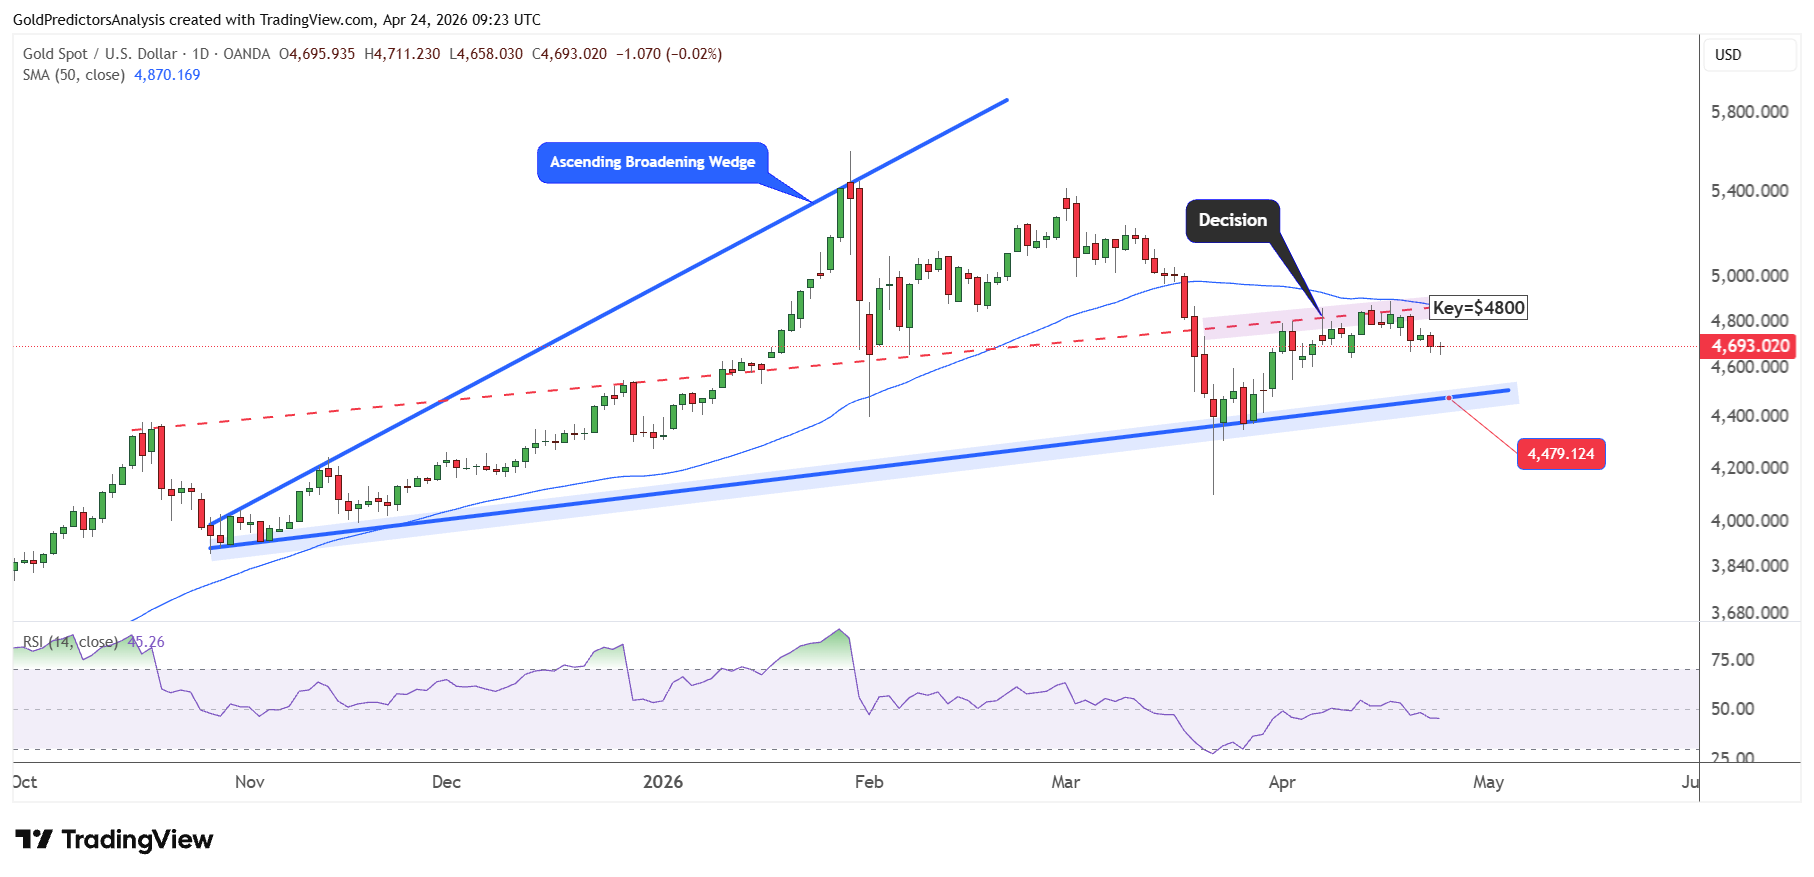
As prices fail to break the 50-day SMA, the recent drop in gold may likely be toward the support of the ascending broadening wedge pattern, which is between the $4,400 and $4,500 area.
Therefore, this support zone will be critical, and a break below this level will indicate a drop toward the $4,000 area. However, a break above $5,000 will indicate further upside toward $5,600.
Gold-to-Oil Ratio Shows Why This Shock Is Different
The ratio between gold and WTI oil provides good perspective of their respective market reactions to shocks. The biggest spike occurred during the COVID-19 supply shock when crude oil prices fell as global air and sea travel, aviation and industry slowed. This was not the case for gold because people sought out safe-haven investments.
This drove up the ratio because oil prices dropped much more than gold. So the 2020 peak doesn’t show weak gold. It shows an unprecedented plunge in oil demand while gold was supported by fear, liquidity and crisis hedging.
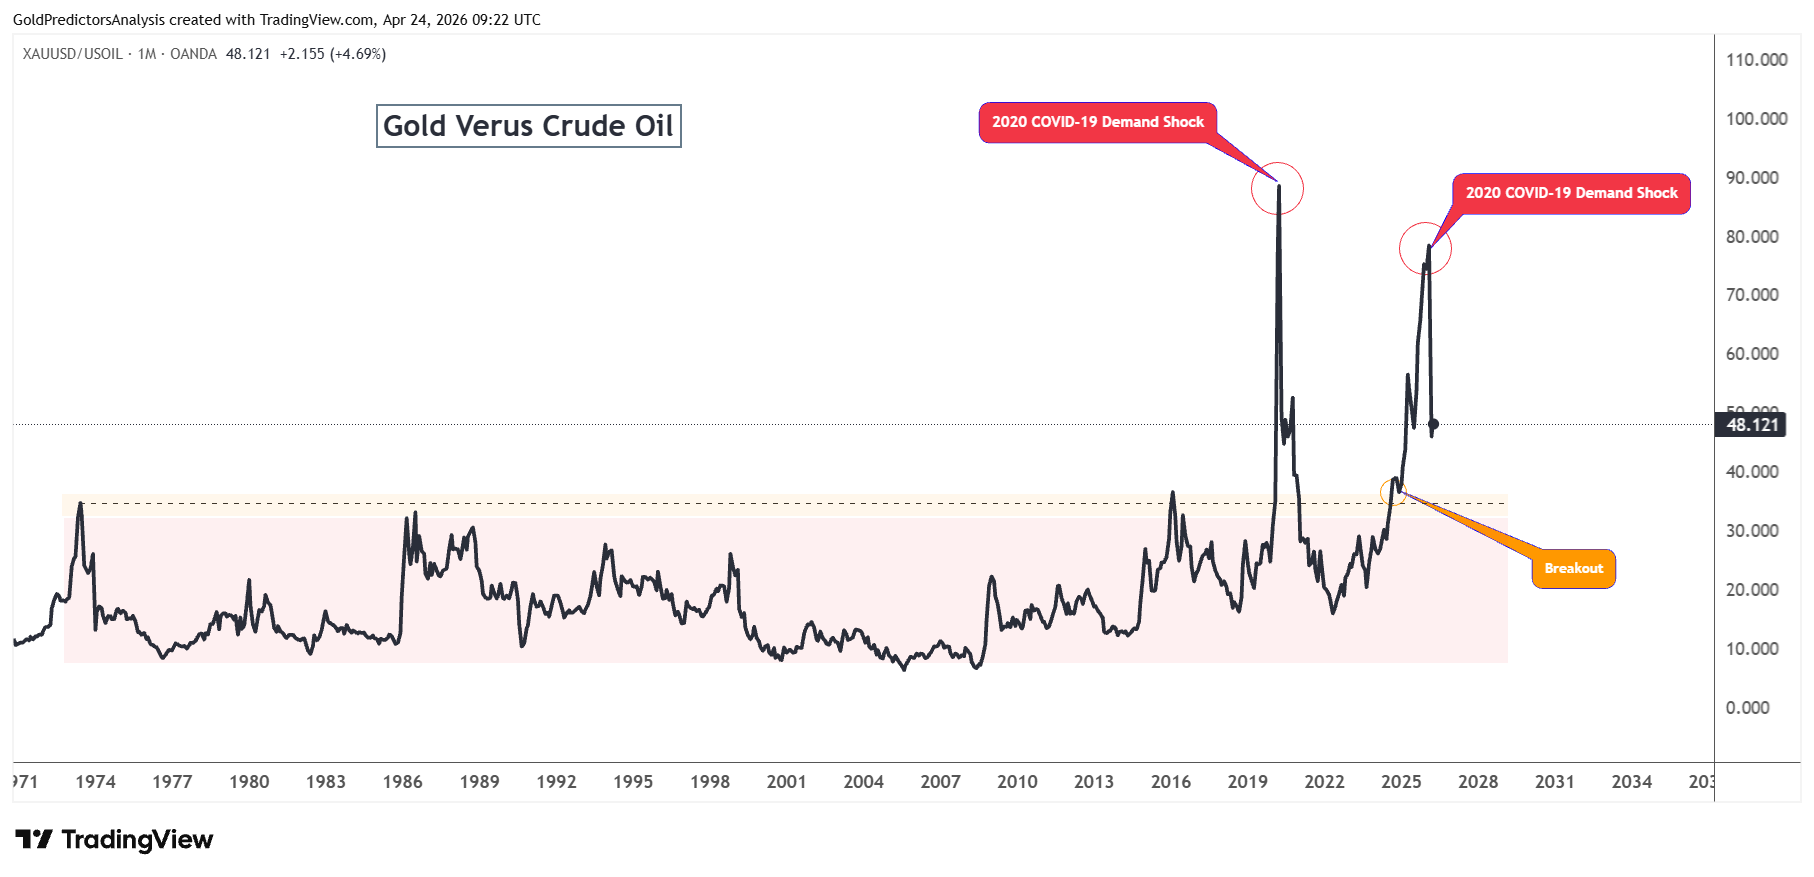
This 2026 setup is different because we have a supply shock, rather than a demand shock. Oil prices are rising due to the threat of further escalation and the Strait of Hormuz, while gold is under pressure in the short term due to higher inflation risk, rate expectations and a stronger U.S. dollar.
In this kind of situation, oil demand can push down gold in the short term because rising oil prices raise inflation expectations and impact interest rates. But gold could find support again if the war escalates or inflation becomes more difficult to manage.
The heavy volatility in the ratio can be removed on the log chart, which shows that the gold-to-oil ratio has hit strong resistance at the ascending channel pattern before dropping lower.
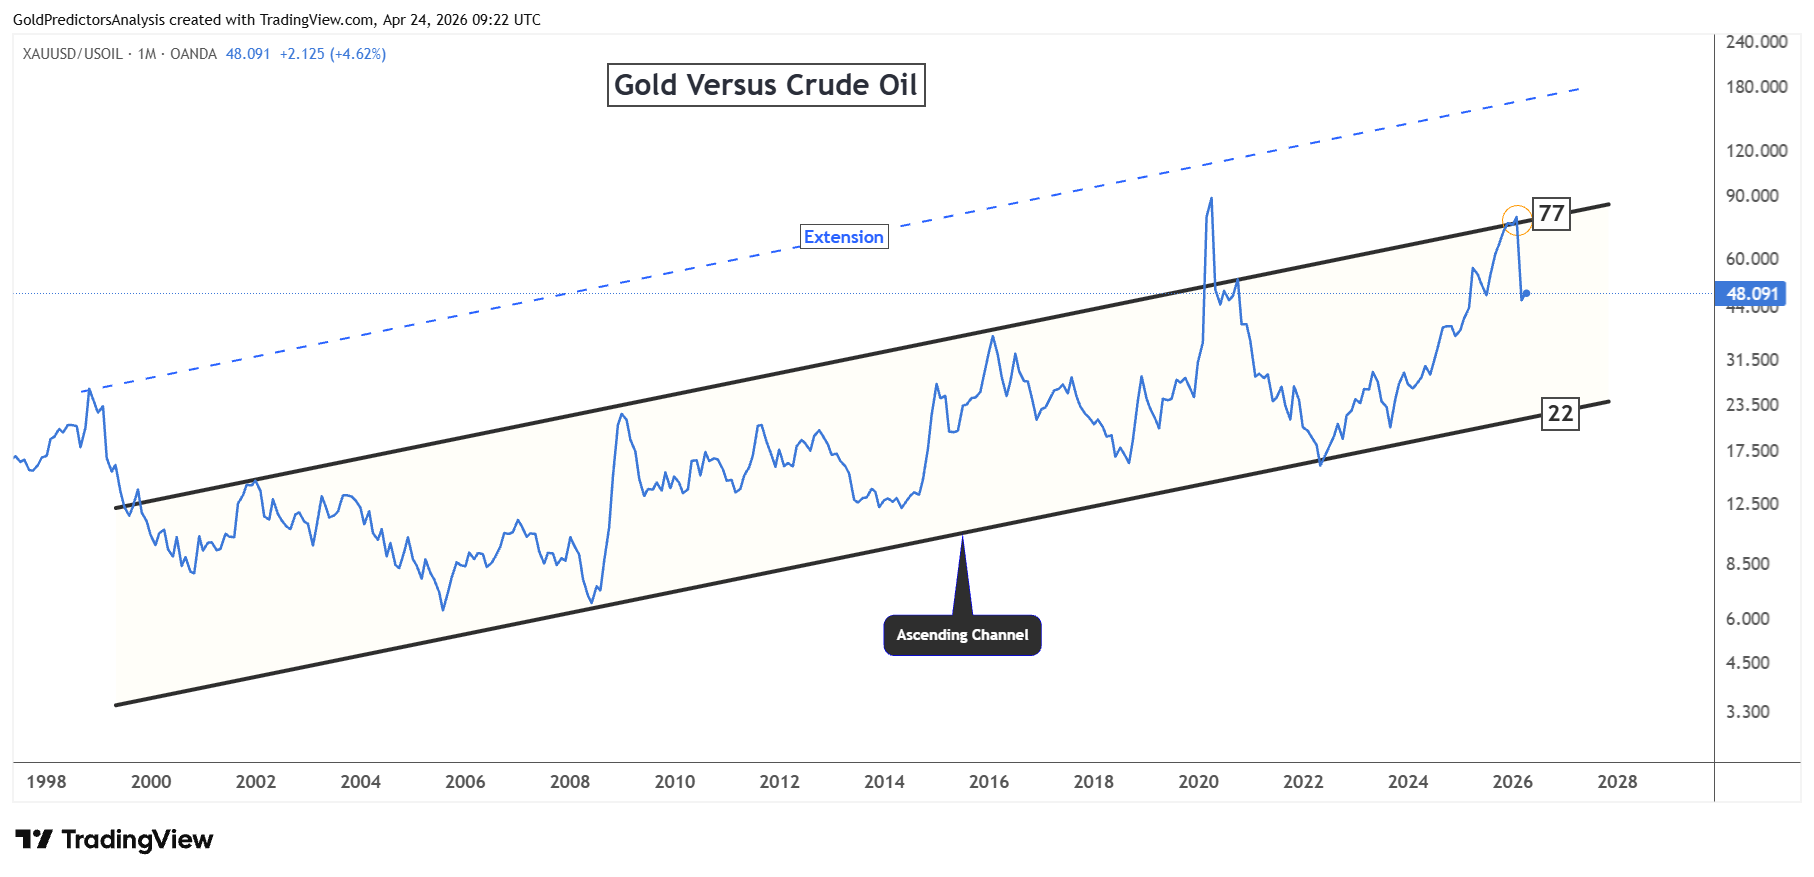
The 22 level remains the strong key support level. If the ratio continues to drop to the 22 level, then the strong surge in oil prices will likely set a long-term buying opportunity for gold, as crude oil prices will likely peak.
Risk Analysis
The greatest risk is that crude oil keeps increasing which keeps inflation expectations high. When Brent crude stays above $100, long-term Treasury yields could possibly soar. This would continue to put pressure on gold since an increase in yields makes it less attractive to hold an asset that yields no interest. The technical structure would also be undermined by a break below the support zone of $4,400 to $4,500. A break below this zone will push prices to $4,000.
The other risk is Persian Gulf crisis remains unresolved for longer. This could continue to make oil volatile and increase volatility in asset classes including the precious metals. Nonetheless, the risk is not entirely bearish. When the crisis worsens or inflation becomes more difficult to control, gold could again be considered a safe haven. A break above $5,000 will confirm that the correction is over.
Bottom Line
The oil rally has shifted the market dynamics for gold. The Brent price above $100 supports inflation expectations and long-term Treasury yields. It makes gold less attractive even though geopolitical tensions are high. In the short term, gold may remain rangebound or retest the $4,400-$4,500 support until we get more clarity on the Persian Gulf situation.
But it is not all doom and gloom. Gold may find the long term buying opportunity if oil prices peak around this stage and the gold to oil ratio reaches key support of 22. If gold breaks below $4,400, it may fall further to $4,000. But a break above $5,000 would keep it bullish. So, oil may put downward pressure on gold in the short term but the same events could help gold later if inflation, financial stress and safe-haven demand worsen.
If you’d like to know more about how to trade gold and silver, please visit our educational area.