



There are many elements to cover as we have this ‘soft reopening’ of the Straight of Hormuz. We have seen high-traffic days on the 21st and 24th, with 14mb of crude transiting the strait on June 22 – the busiest day since March 1. Then the attack on UN escorted ships, Iranian dark-fleet vessels switching their AIS transponders back on, Indian imports of Russian crude hitting all-time highs, and plenty of other weeds we could crawl into.
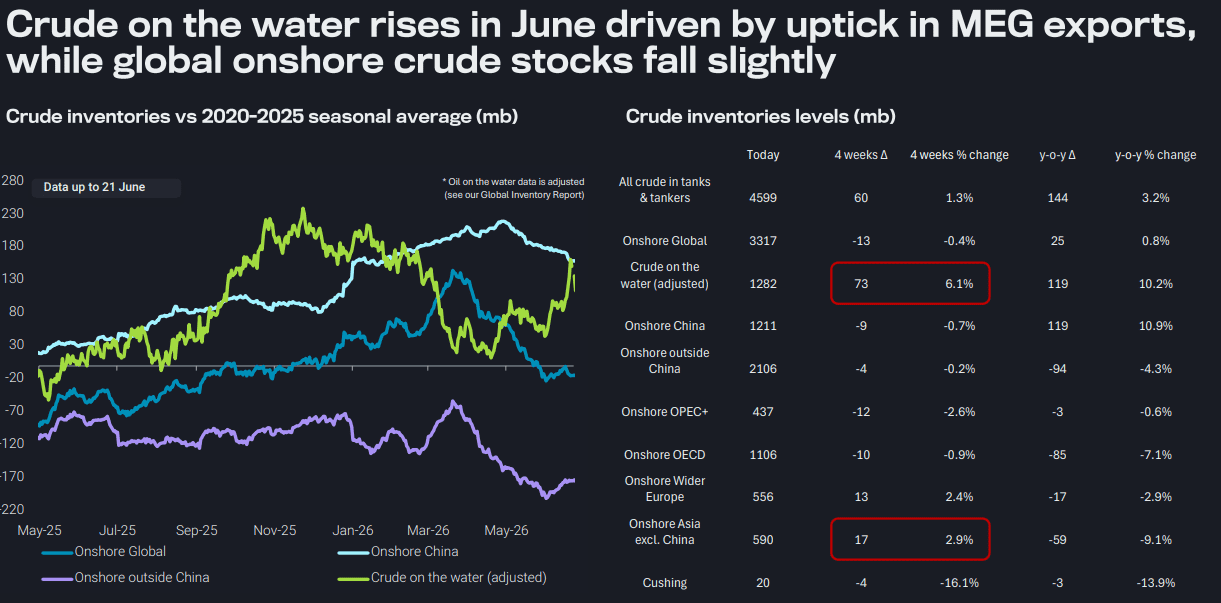
I have serious doubts it lasts. At the time of writing, the US has struck Iran a second time in the last 48 hours, on the back of Israel de facto breaking the Memorandum of Understanding (MOU) with sustained attacks on Lebanon. The real trading and price risk here is more detailed than the headlines, and it all comes down to one question: higher or lower? As is with trading oil, there are no simple answers but I want front month oil exposure here. I think risks are to the upside. And like our lord and saviour Jeff Currie says, I want to 100% be exposed to the oil and gas names upside here.
There is something going on under the hood though that is way out of whack and this will probably setup a massive trade for September.
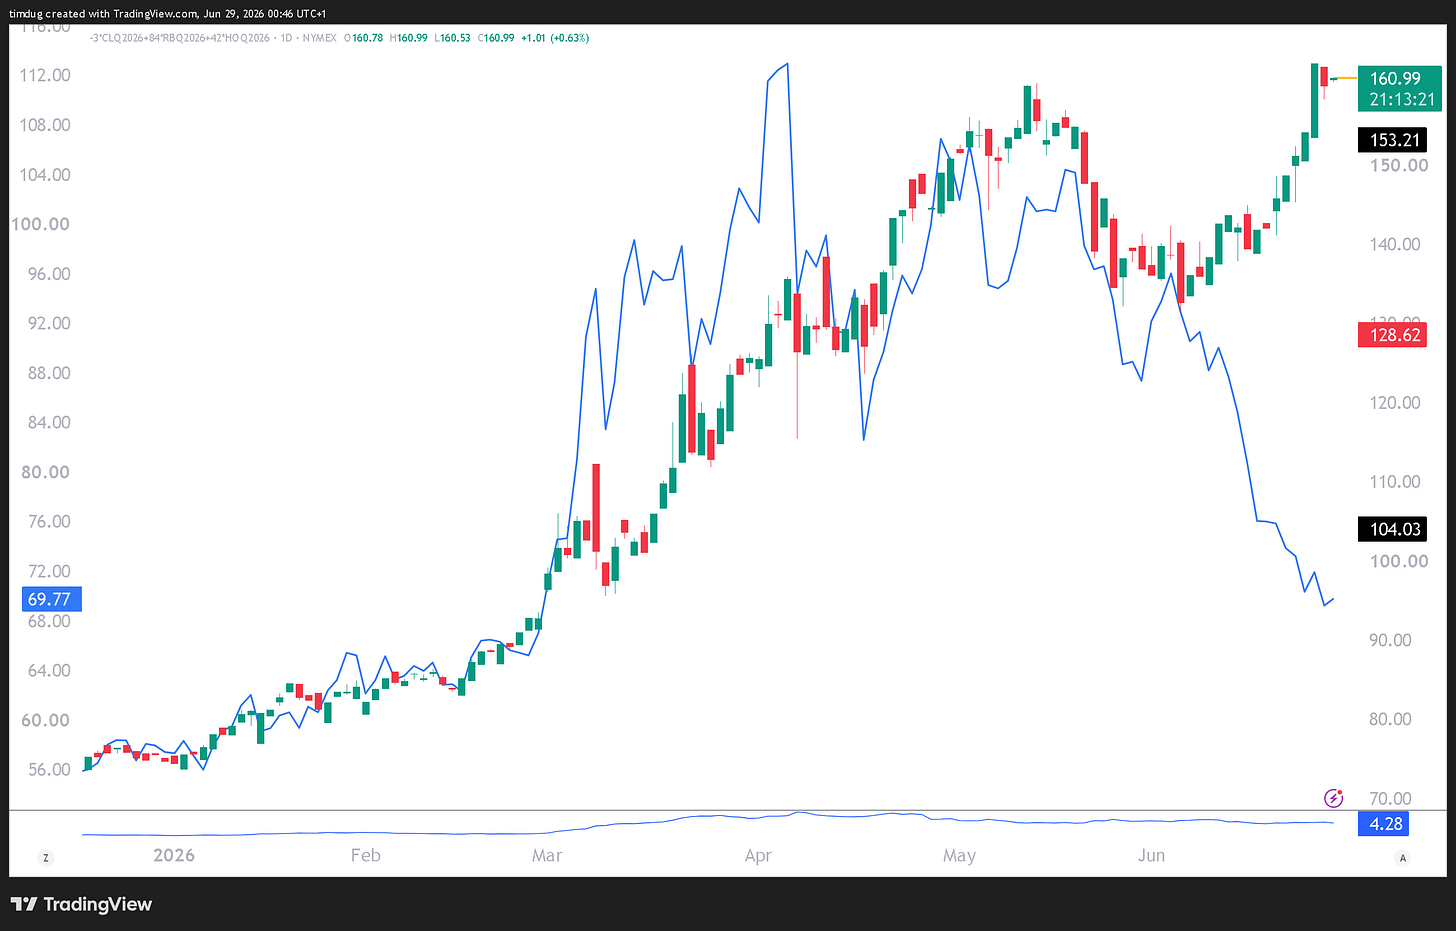
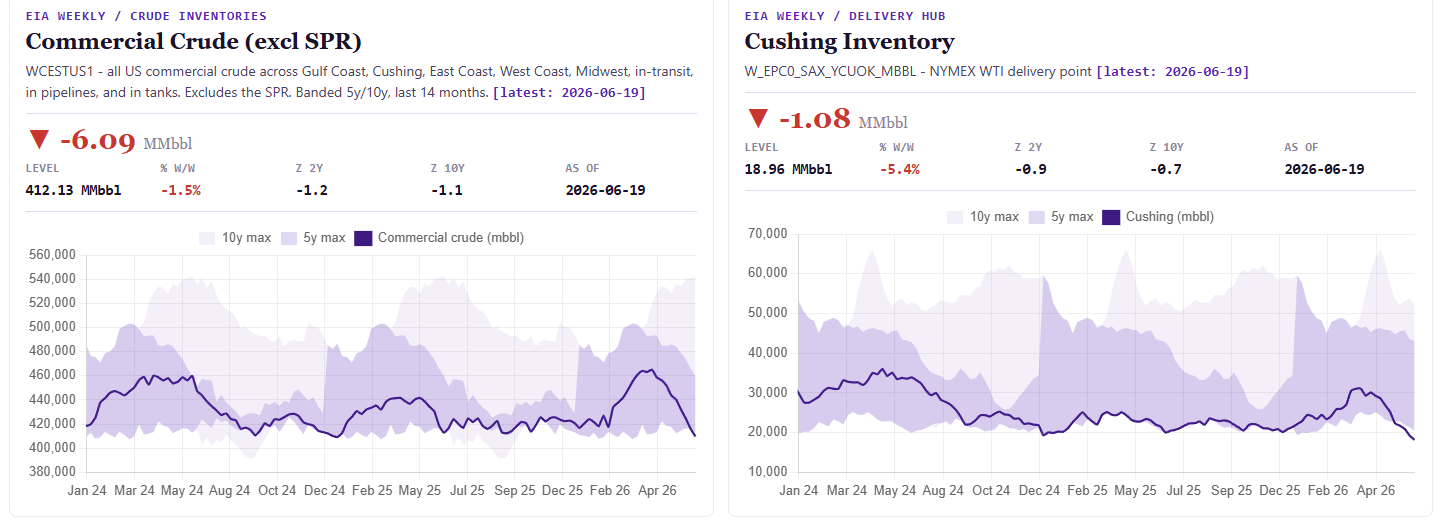
Oil is cheap and getting cheaper – down roughly 40% on flat price over the last two months. Refining margins though are at the highs. Those two things aren’t supposed to happen together. What is worse, is that we are in a situation where oil could be trading at $40 and the price at the pump could hit new all time highs. All within a 70% probability chance within the next 3 months.
So lets get into it.
Crack Spread Is the Key
Crude is collapsing and refining margins are at the highs – at the same time. Those two are not supposed to be on the screen together. The 3-2-1 crack spread (below) is a measure of the refiners profit margin.
You don’t normally get both. Cheap crude and fat refining margins cancel each other out. When oil is cheap because there’s too much of it (like now), refiners run flat out to grab it. Refined fuel (products) flood the market too, and the margin gets competed away.
When margins are fat, refiners buy every barrel they can, drain the surplus, and crude firms back up. One always drags the other back to normal. Nothing solves low prices like lower prices. Basically something gets so cheap, it gets wider use again, then normalises back to the mean.
So seeing both at once – crude falling, margins at the highs – means the link between them has snapped.
Think of it like a bakery. If flour is suddenly dirt cheap because there’s a glut of it, you’d expect cheap bread too – the saving flows through to the shelf. What you’re seeing instead is dirt-cheap flour and bread at record prices, the baker pocketing the widest margin in years. That doesn’t happen unless something is jammed between the flour and the loaf.
Brent Oil Price Forecast
Every new Brent Oil analysis as it publishes, today's technical signal and key levels, live price — on one page.
See all Brent Oil forecasts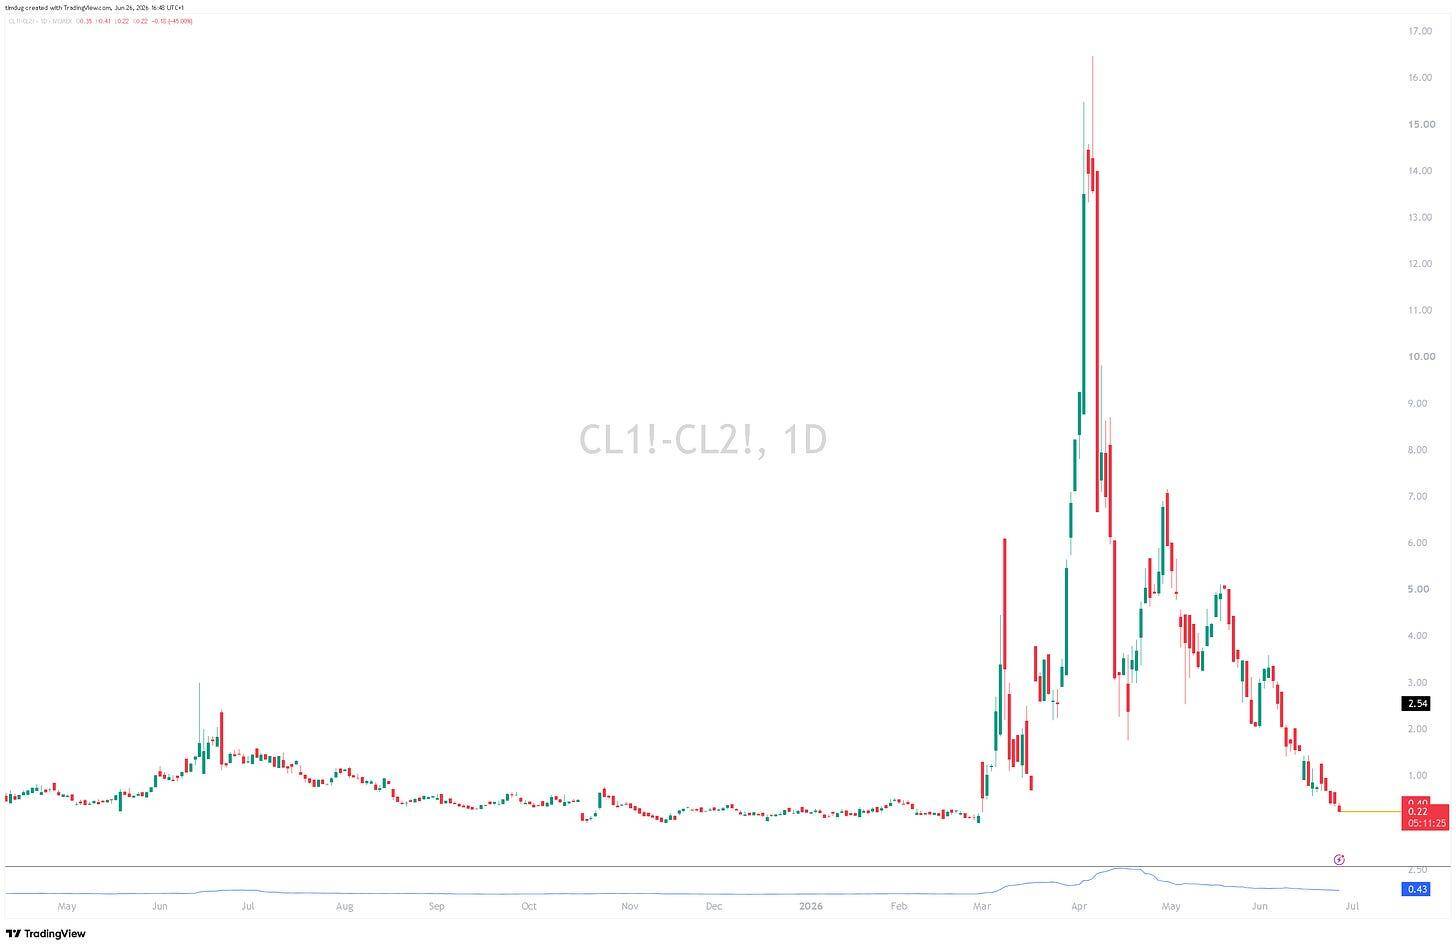
The Great Dislocation
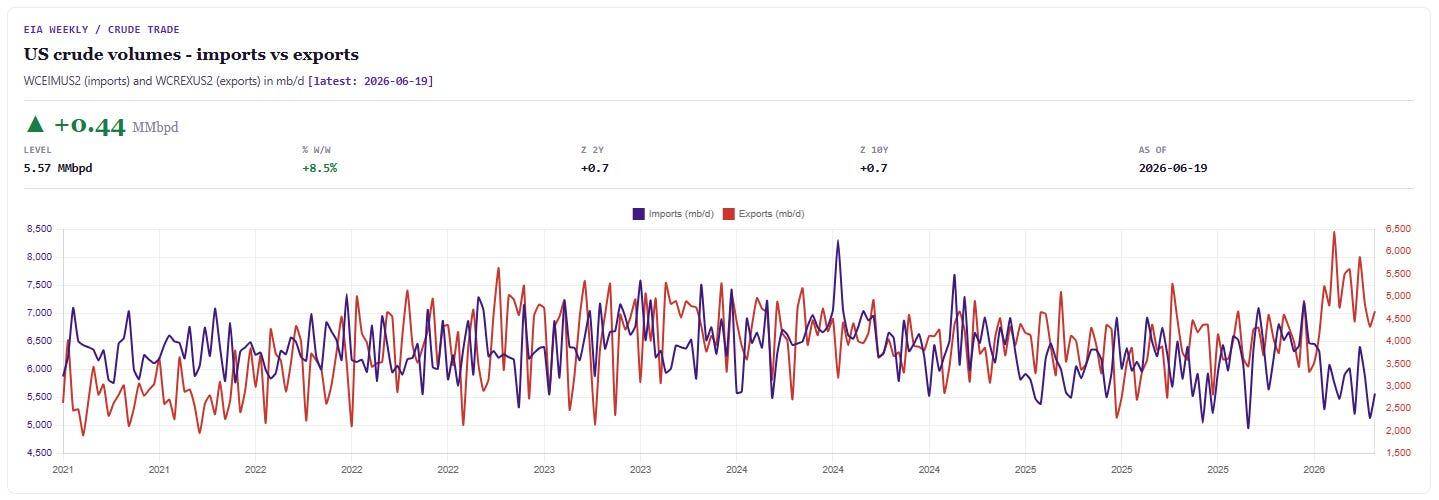
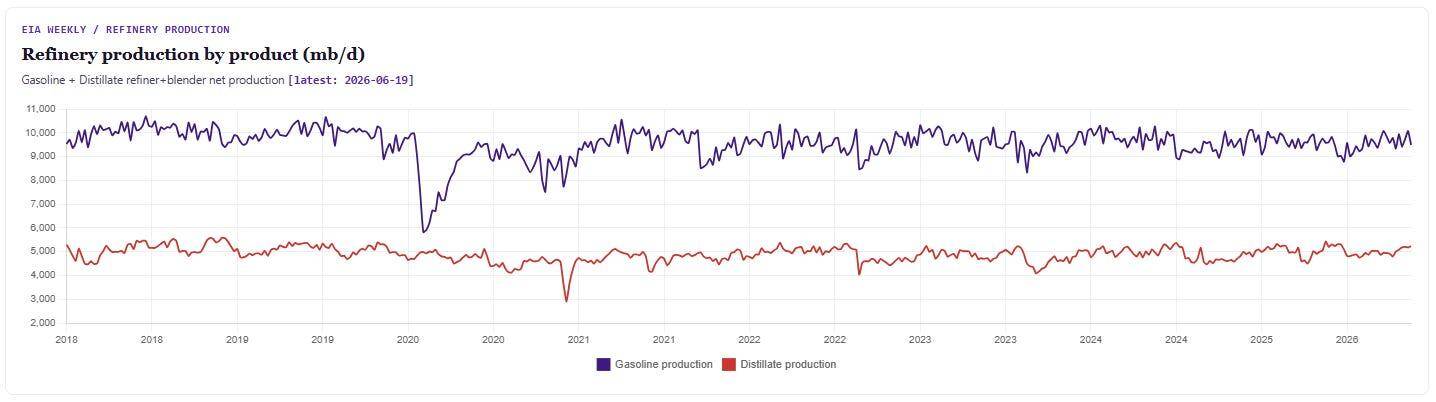
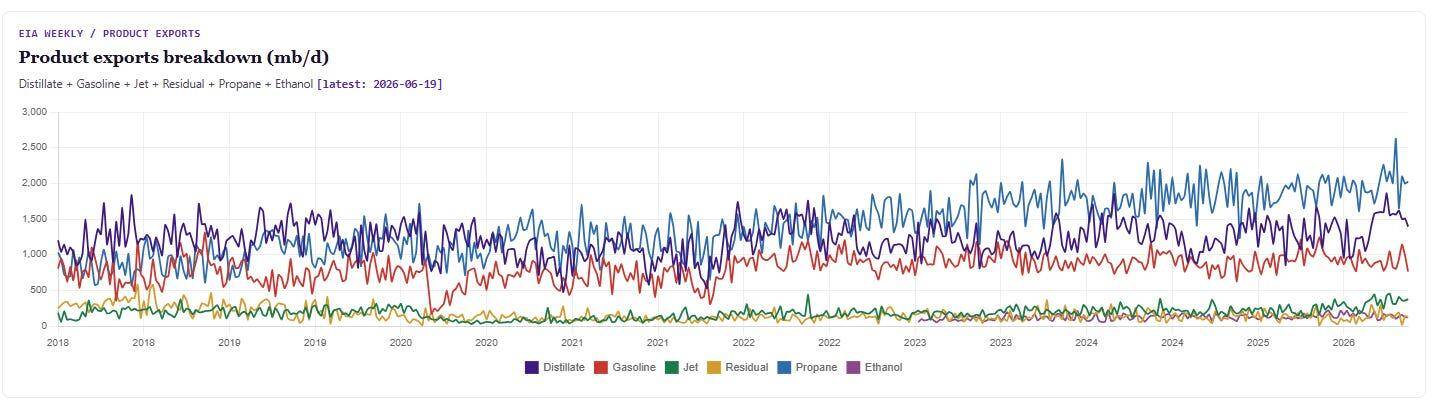
What has snapped is that there is so much oil now, that refiners can not process fast enough. US Refiners are now propping up the new American moniker of net exporter and swing producer. In this new world, they have to run like the clappers in order to meet new-found emergency demand and new levels of oil released into the system. Never mind ‘Drill baby drill’, ‘Refine baby refine’!
It’s a bonanza! The ovens are maxed. US refiners ran at 96.1% in the week to June 19, Gulf Coast 96.7%, crude runs of 17.1mb/d (EIA). There is no spare refining capacity to absorb the extra barrels. So the crude piles up cheap and unrefined, while fuel stays tight and margins stay fat.
So you would think, ok, cool. Welp! The refiners are maxed out, there is an SPR glut there waiting for refining, just let them process through the glut and all will be good? The problem with this is that there is zero slack in the system. Slack you say?
There Are Two Kinds of Slack
1. Utilisation headroom. (flow buffer) Normally, refiners run somewhere in the 85-92% range, leaving room to run harder when fuel demand spikes or another plant goes down. That spare capacity is the system’s shock absorber. If a refinery trips offline, others can lift runs to cover it. At 96.1% national, 96.7% Gulf Coast, that headroom is nearly gone. There’s maybe 3-4 points left before the physical ceiling. So if a plant goes down now, almost nothing can be dialed up to replace the lost output.
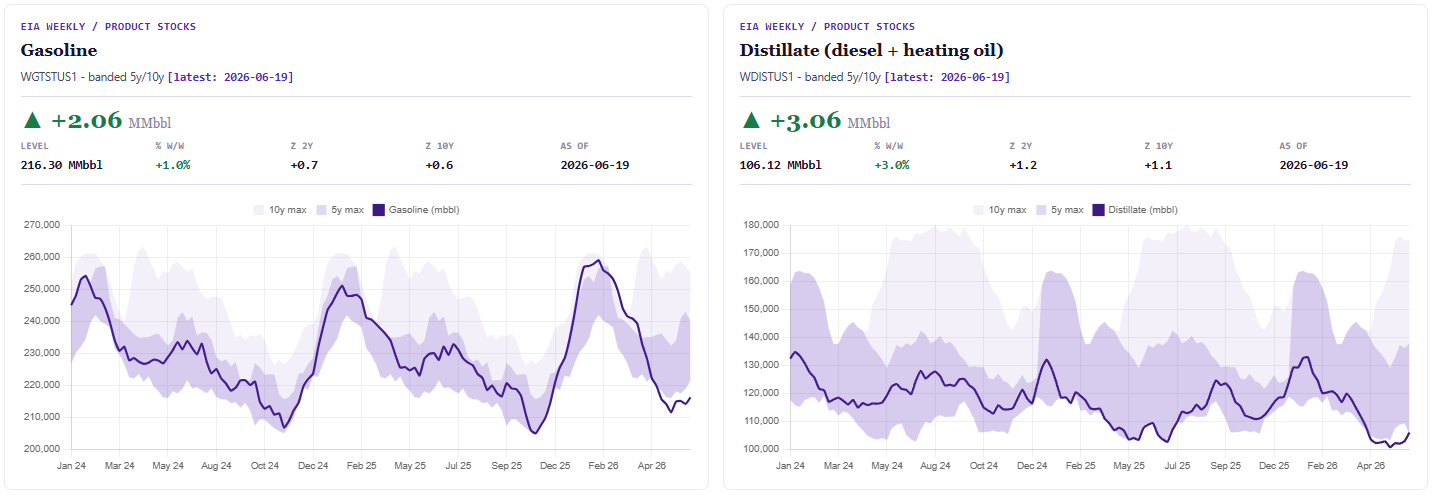
2. Product inventory (stock buffer). This is the bigger one. Even if refiners can’t run harder, a system with fat fuel inventories can absorb an outage by drawing down tanks – you sell stored diesel/gasoline while the refinery is fixed. That’s the cushion that stops an outage becoming a price spike. And here’s where it bites: distillate is 10% below the 5-yr average, the second-lowest mid-June since 2000. So the stock buffer is thin too.
Normally, you have at least one of the two. Either spare refining capacity (run harder to cover a loss) OR fat inventories (draw tanks to cover a loss). Glut 2.0’s danger is that both are depleted at once – utilisation near the ceiling AND product stocks below average. There’s no flow buffer and no stock buffer. An outage has nothing to lean on from either side. Stocks of gasoline and diesel are on their knees!
Fall Turnaround Season
So if things are tight in product, with refining going at 96%+, whats the worst that could happen? The refiners turnaround the processors for maintenance, changing over to winter grade gasoline and prep for heating season. To avoid price spikes through this period, we must see stocks rise into September.
Thanks to Vortexa for a great oil report. There is a ton of rhetoric about what China are playing at. The facts are that our Eastern friends stepped off the import market for the last 6 or so weeks, thus providing well needed breathing room for Europe mainly, to get some relief.
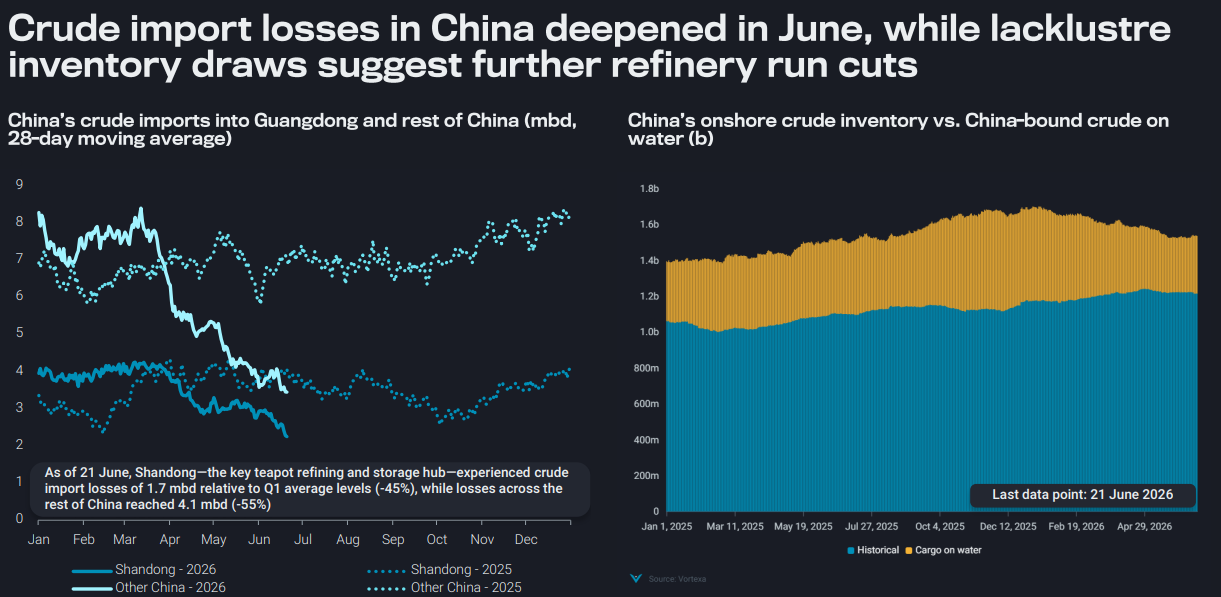
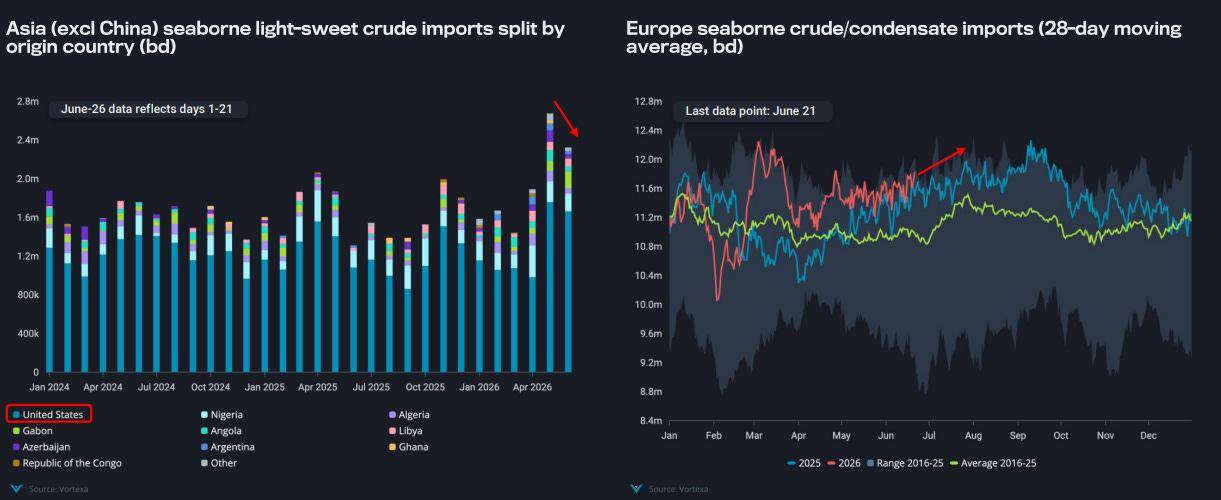
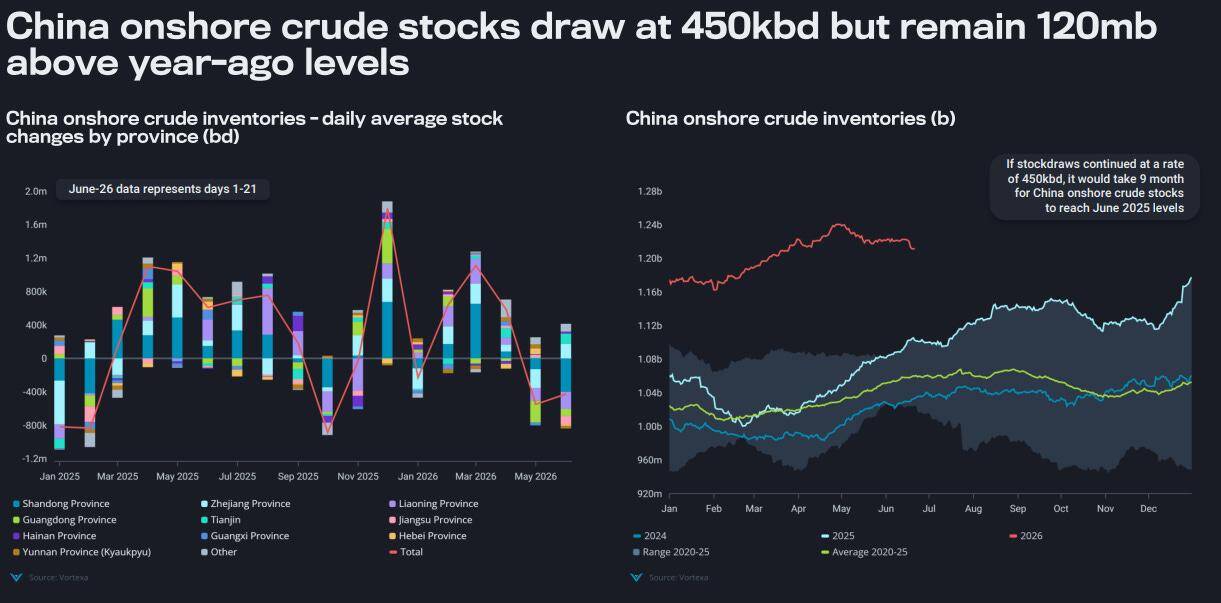
The Net Net
This is a refining-capacity squeeze, not a crude story. Upside risks from here on will be born from geopolitical risk. If we slip backwards off this MOU stool, expect a reacceleration to the highs. You will have to price in what a fresh closure of the SOH would do to the OECD group. I would price that as worth at least $50 risk. Have you seen where OECD strategic reserves are at? We are already on thin ice. Please keep in mind that Trump threatened the lives of Iranian negotiators at the last Swiss meeting.
The point of this entire report is to highlight that this is how precarious things are. If Iran wanted to press here, it would yield maximum impact at a point where The OECD can not handle another 2 months of low/no shipments.
Commitment Of Traders Report
Brent COT
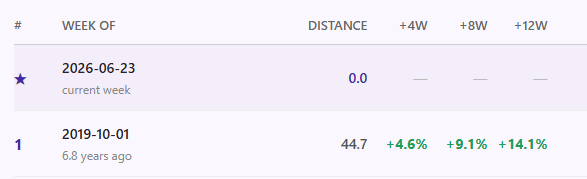
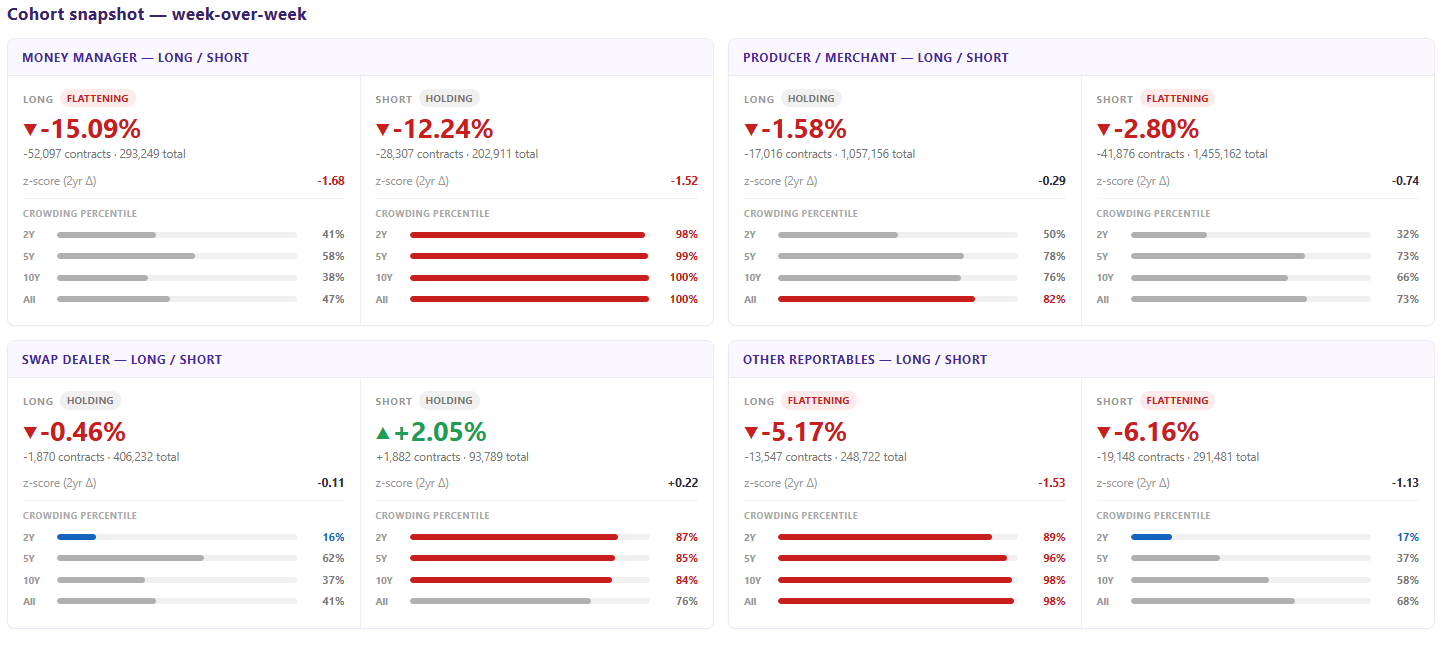
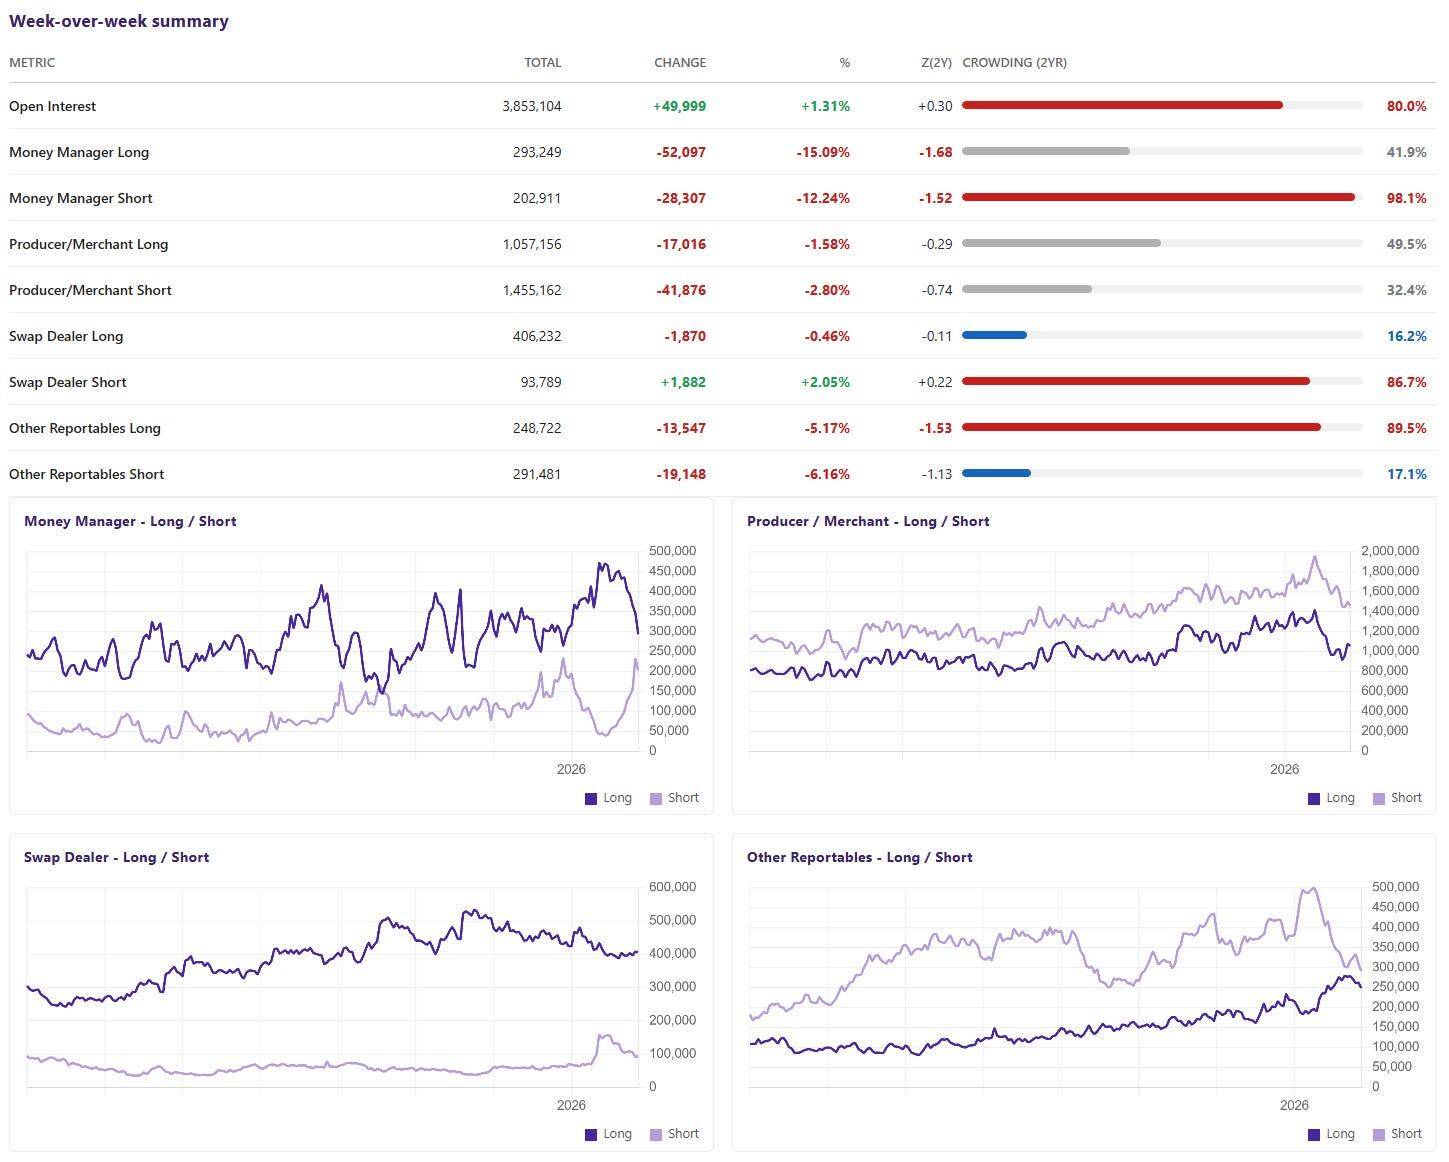
I want to speak about some machine learning that I have been working on for the last 18 months with Max, my quant. My analysis is that the nearest match to this current COT reading is the week of the 1st October 2019. We are at 100% score on swap dealer positioning long and short. 83% on PM Short. So producer hedging and Swappies are identical to that period.
MM trimmed longs -15.1% (-52k) this week while covering shorts -12.2% (-28k). That moved MM from 1.5:1 long to 1.4:1 long – at the 42nd percentile (2yr) on the long side. Biggest one-week conviction shift in months. OI expanded +1.3% (+50k) – fresh money entering even as positioning shifts. OR covered shorts -6.2% (-19k). PM covered shorts -2.8% (-42k) – likely taking profits on producer hedges into weakness. SW pressed shorts +2.0% (+2k), with SW shorts at the 87th percentile (extreme hedging-cover regime intact) and longs at the 16th.
The read: MM cashed in shorts, flattening 28k contracts, but also flattened 52k longs. Swappies shuffled the books flattening 1800 longs, increased the same amount short. Their clients look to be net about 306k contracts long still though. Looks to me overall that MM took money off the selling table. I’ll want to watch and see if they build length in the next report.
What’s the Next Move?
We will revisit the crack spreads closer to September this year to look at how the product refinery is going. I suspect we will have incredible long ops in the last week Aug, first week Sept this year.
For now though…
This is what happened next from that COT reading on price in Oct 2019. Funny enough, my system also tells me that in the prior COT report, we had the same 3 positioning at above 92% on all three. It was good for a +$14 rally in oil. So yeah, I want to be long!
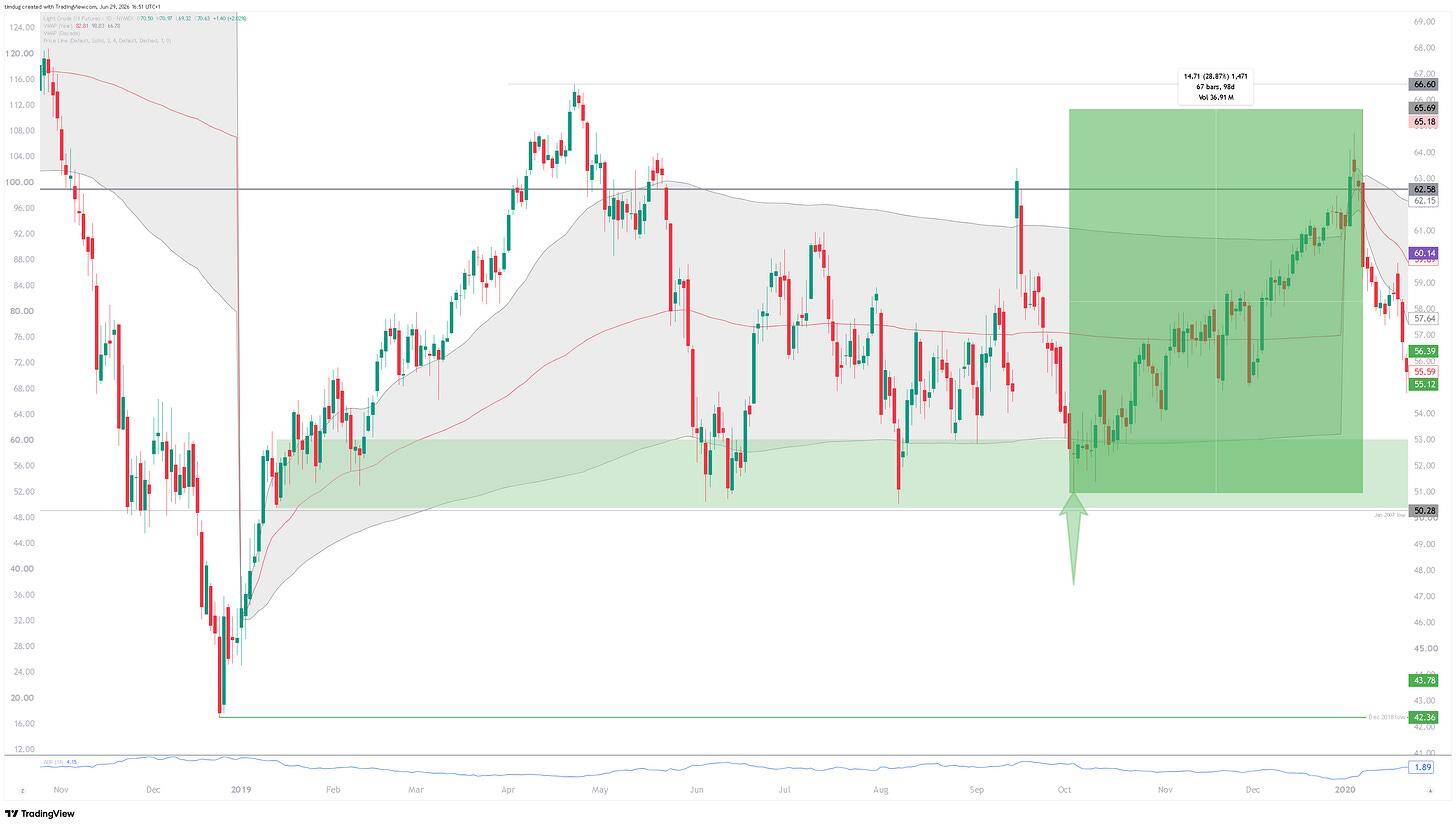
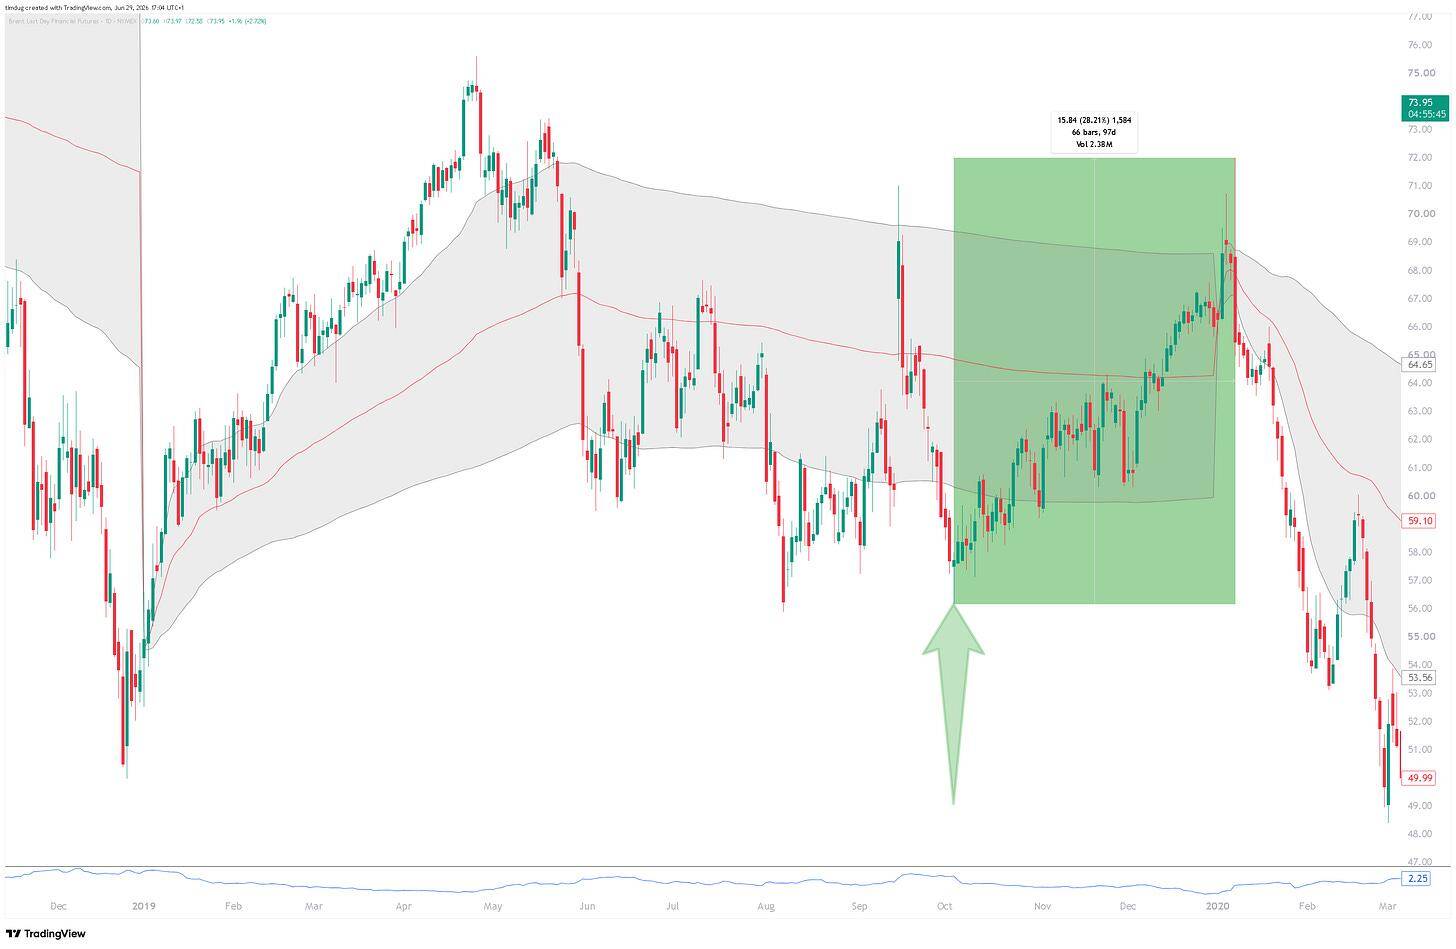
My trade hypothesis for this week. It could last through to next week. We will need a catalyst for this though. I imagine that it would be something indicating that the MOU is falling apart. Iran walking away/ Iran closing SOH until something changes that Trump will not do. Something of this magnitude. Without a catalyst like this, we would rather not be too early to the barn dance!
I’ll be watching for an initial push up to fail, then flush to new lows, then a failure for a grand flush down to hold. The gap closes on WTI at $67.74.
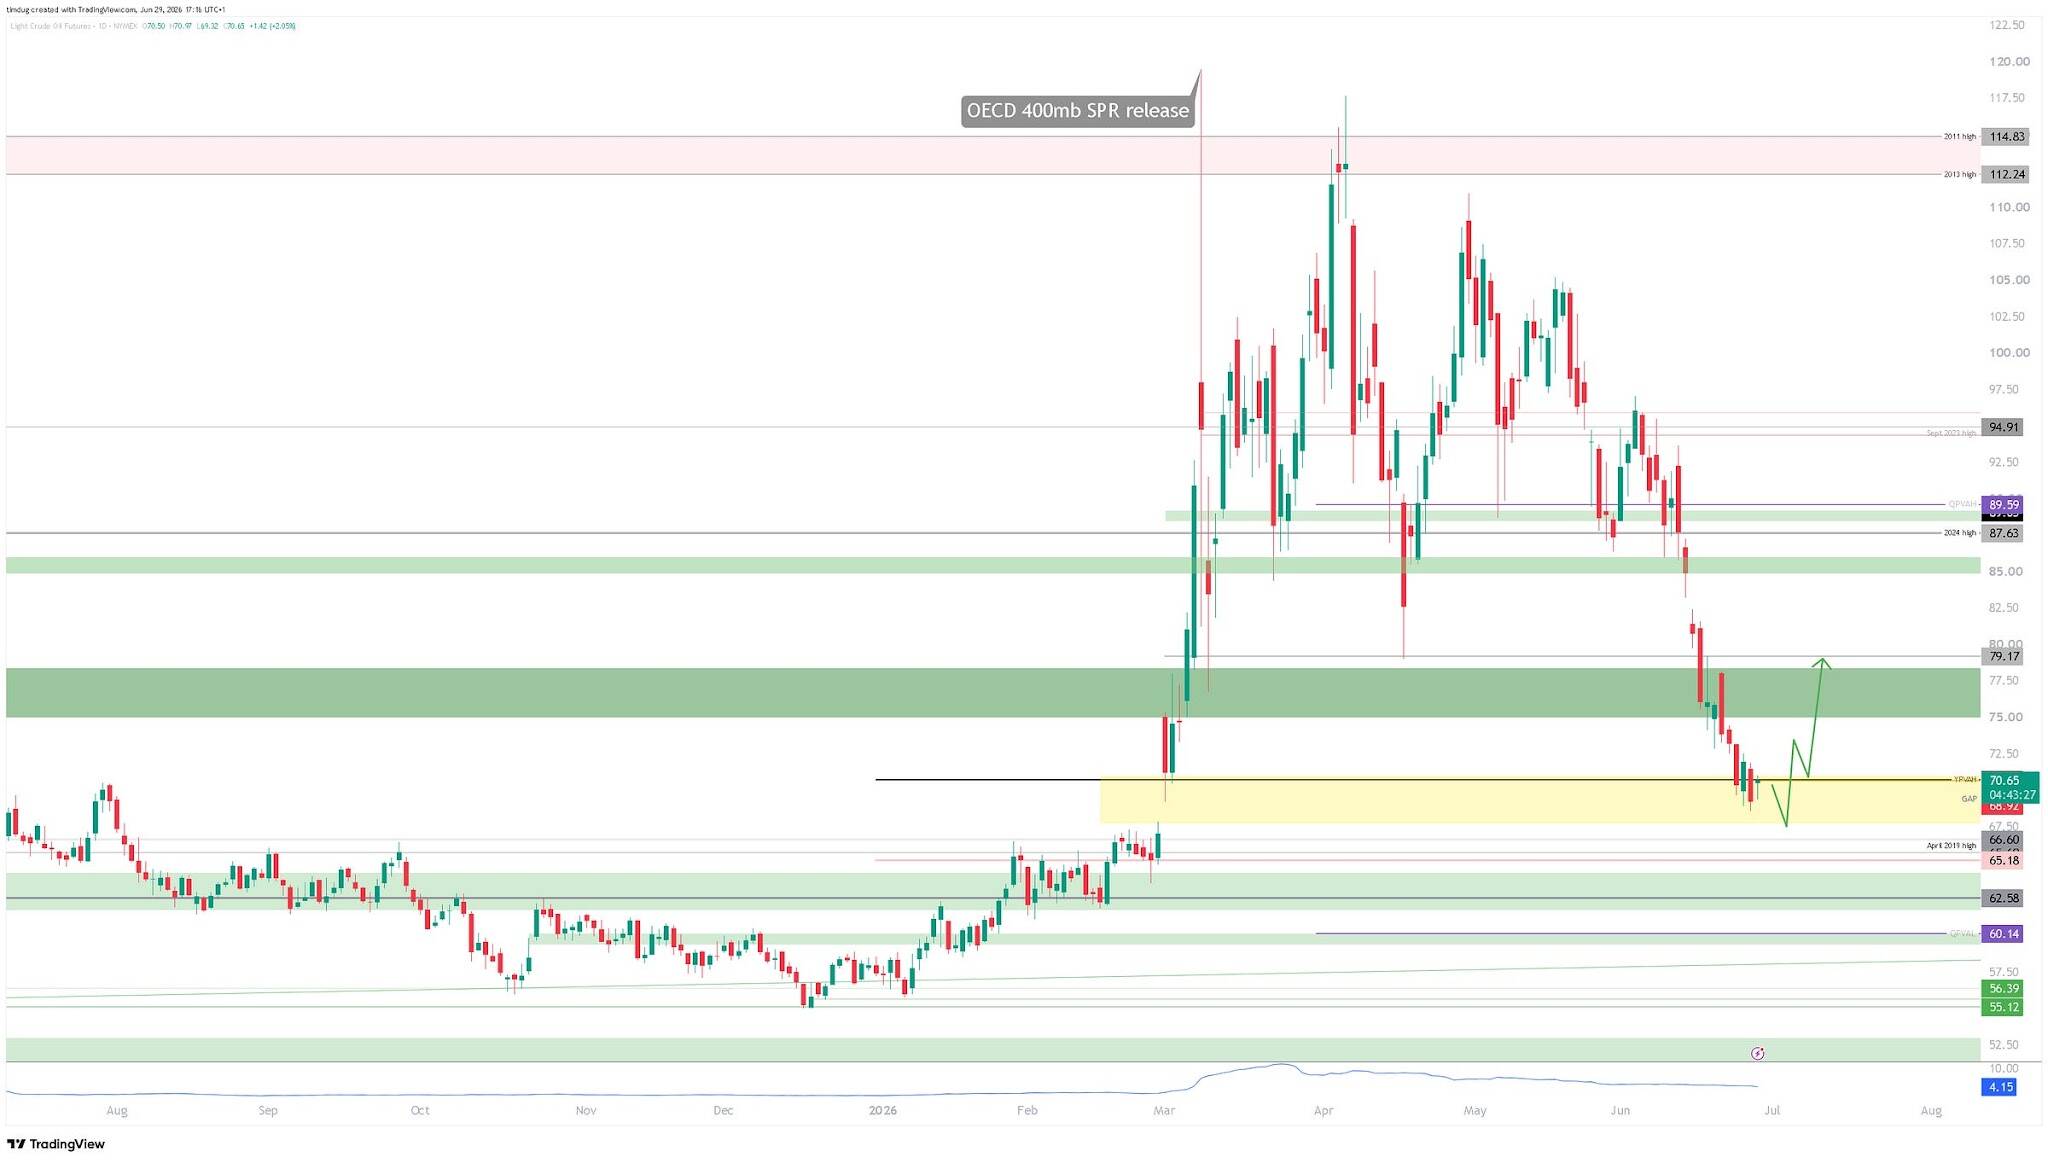
How was my driving on the last leg down?
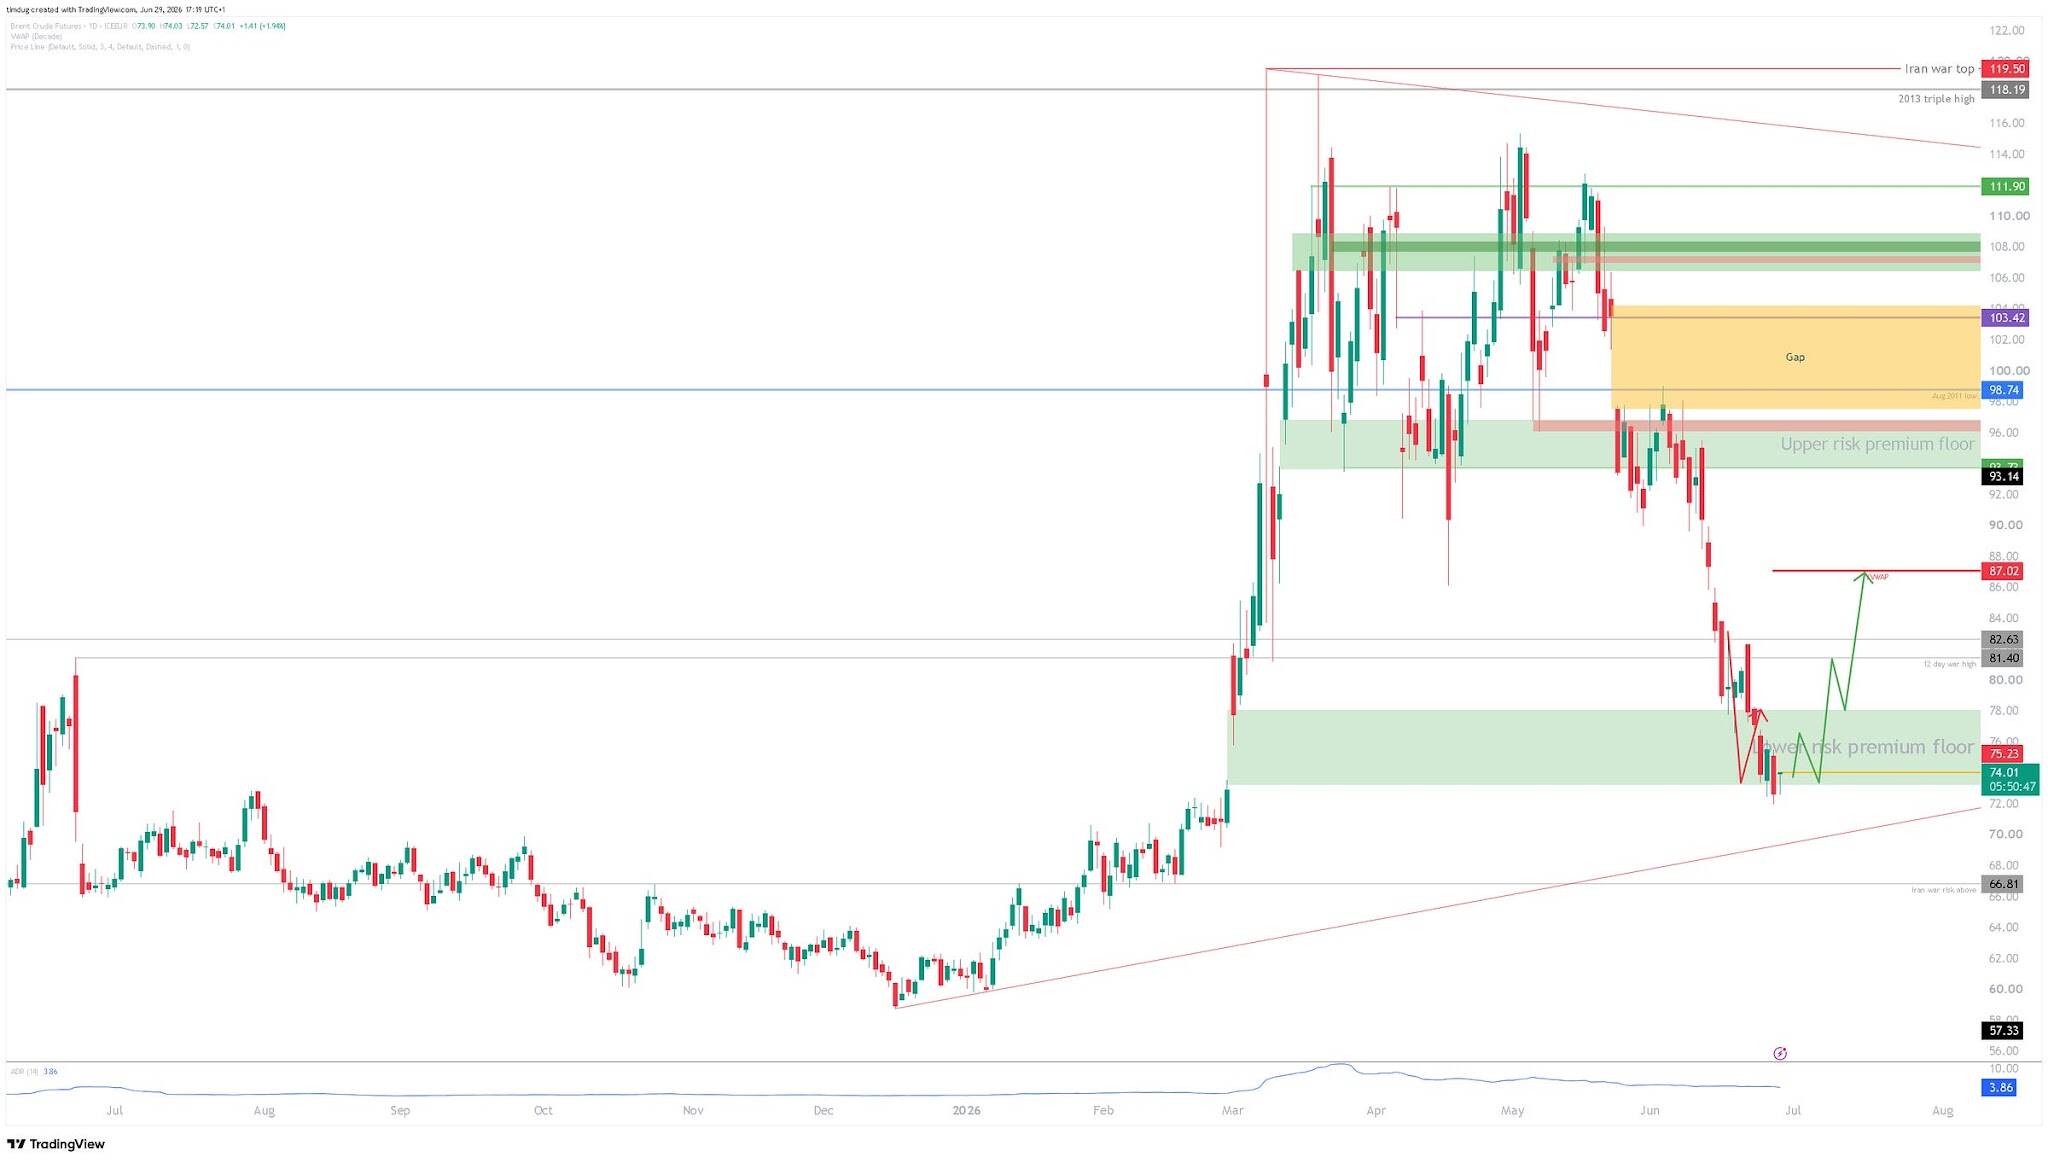
That’s the report!