


In this report: Petroline exposure, China’s crude cutoff, IEA stock mechanics, COT positioning, and this week’s trade falsifiers
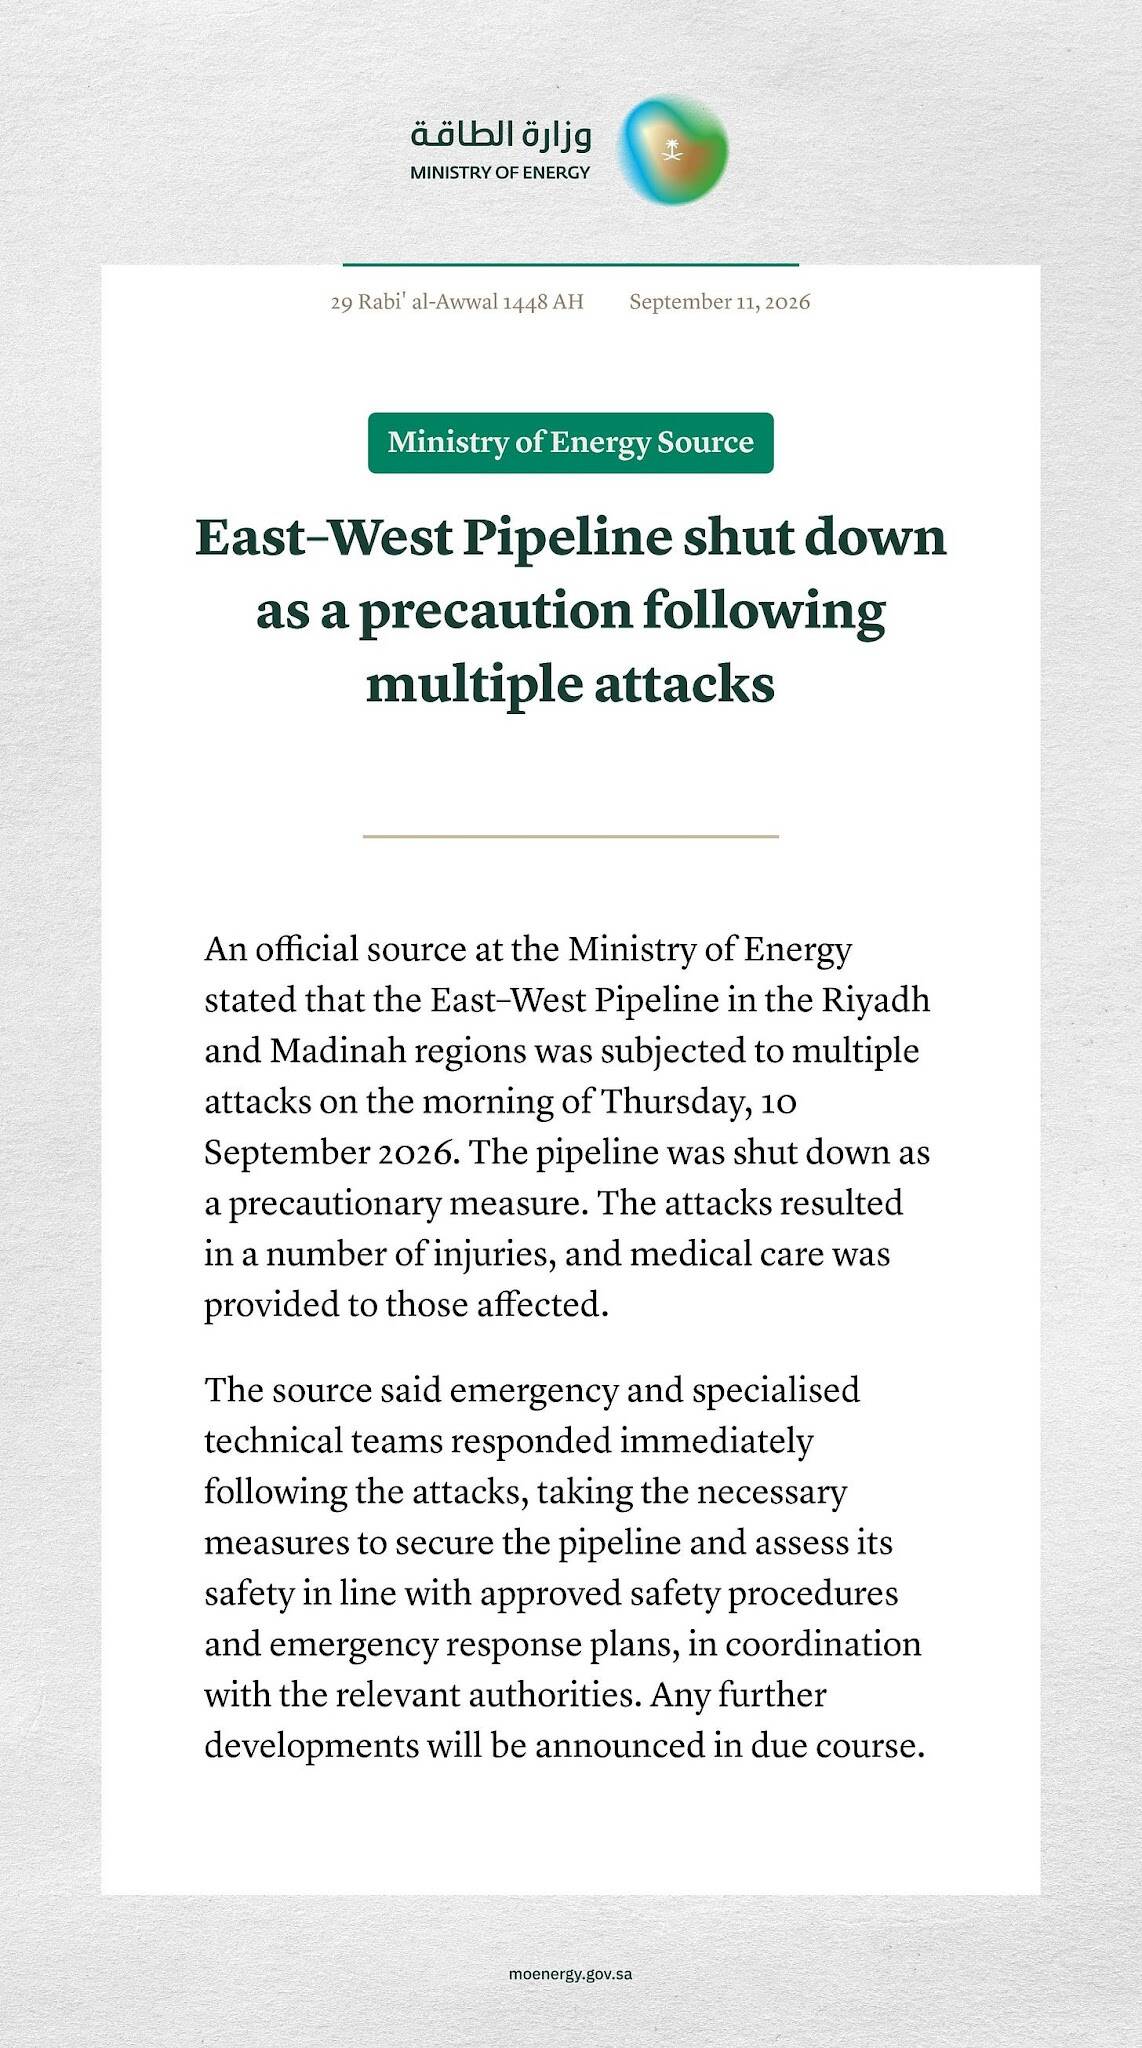
Saudi Ministry of Energy statement on the precautionary East-West Pipeline shutdown following multiple attacks. Source: Saudi Ministry of Energy.
“The Kingdom has chosen not to retaliate at this stage and to support the efforts of the Iraqi government” to allow Iraq to take measures to prevent attacks from its territory – Saudi Foreign Ministry, in response to targeting of East-West Pipeline,
Welcome to the third phase of the war- with long tails that will echo through the financial system for all of 2027 and well beyond. Let’s not pretend that there is a way to print our way out of this Trump/Netanyahu hole. They wanted a war, they got it and we wear it!
There is a sister report to this one, MEG region flows. There is simply too much to cover at this time to have in one article. The situation requires contextual and situational awareness that spans more than just one compact article. So please have a read. In short, we have about a 2mbd-5mbd outage from the system right now. We will wait to see how Saudi repairs deliver over this week. In my opinion, there are extreme shortcomings that will leave this bypass route exposed. Even if Saudi get the Petroline back to where it was, a doubling of major security assets will have to be made on this pipeline, simultaneous to a doubling of security around Yanbu and Jazan refinery.
Trump has already turned down any military intervention to help Saudi. I see this situation actually suiting American strategy, effectively attempting to solidify regional ideas about reliance on US protection. Though that reliance should now be questioned, given that exact protection failed to deliver anything over the last 7 months, unless you were Israel.
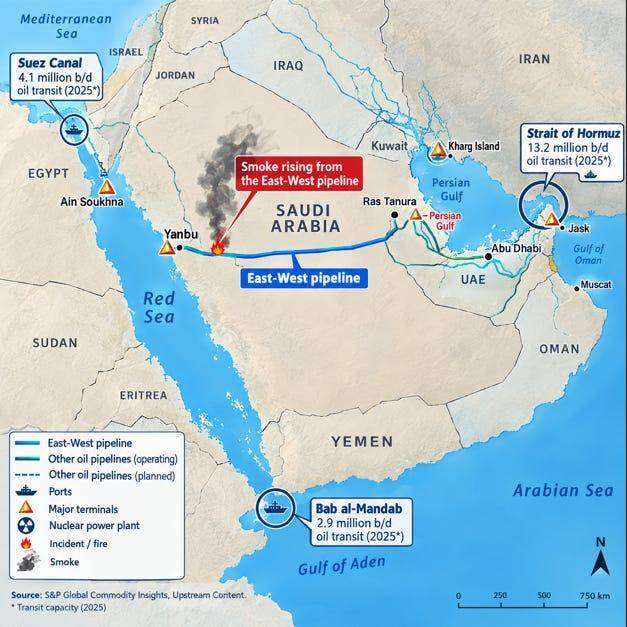
Saudi Arabia’s East-West Pipeline and key regional oil chokepoints, including Hormuz and Bab al-Mandeb. Source: S&P Global Commodity Insights / Upstream Content.
Red Sea Disruptions Threaten Saudi Oil Exports via Yanbu and the Petroline
Ansar Allah (The Houthis) stepped up maximum pressure in the Red Sea and across the West of the Arabian coastline, capturing several islands and ports inside the Bab al Mandeb strait. This effectively secures their complete dominance of the southern access to The Red Sea. The direct effects of this strategically strengthen Iran’s position even further across two of the three most important regional shipping routes. This is now forcing MEG region Asian exports into a 54-day transit time. A ship leaving Yanbu last week will arrive in South Korean on November 7th approximately.

More commonly referred to as the East-West pipeline, The Petroline has provided key relief to the situation in the Straits of Hormuz. Briefly, this line carries up to 7mbd of Saudi crude to the Red Sea port of Yanbu. In turn, Yanbu can load about 4mbd, however of recent weeks, this actual loadings have dropped to approx 2mbd in August. As The Houthis continue to assert domain dominance in the Red Sea, I could see this easily move to as low as 500kbpd or zero. There will be severe limitations to how Saudi can protect itself.
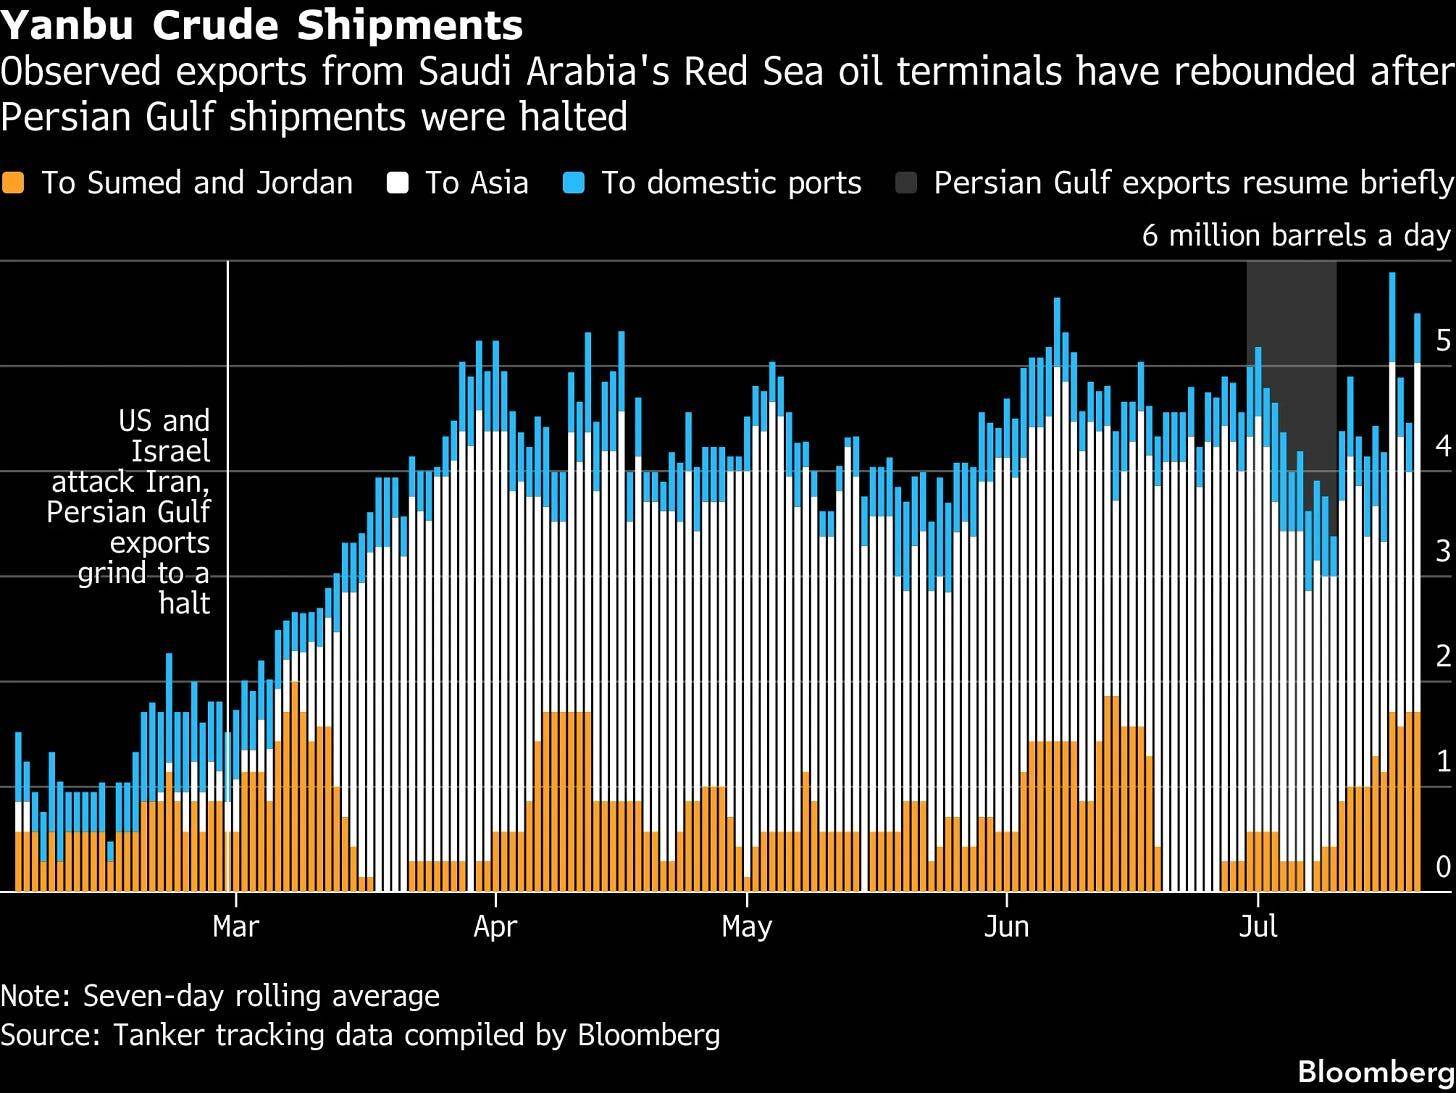
Yanbu crude shipments by destination, showing the shift in Saudi Red Sea exports. Source: Bloomberg tanker-tracking data.
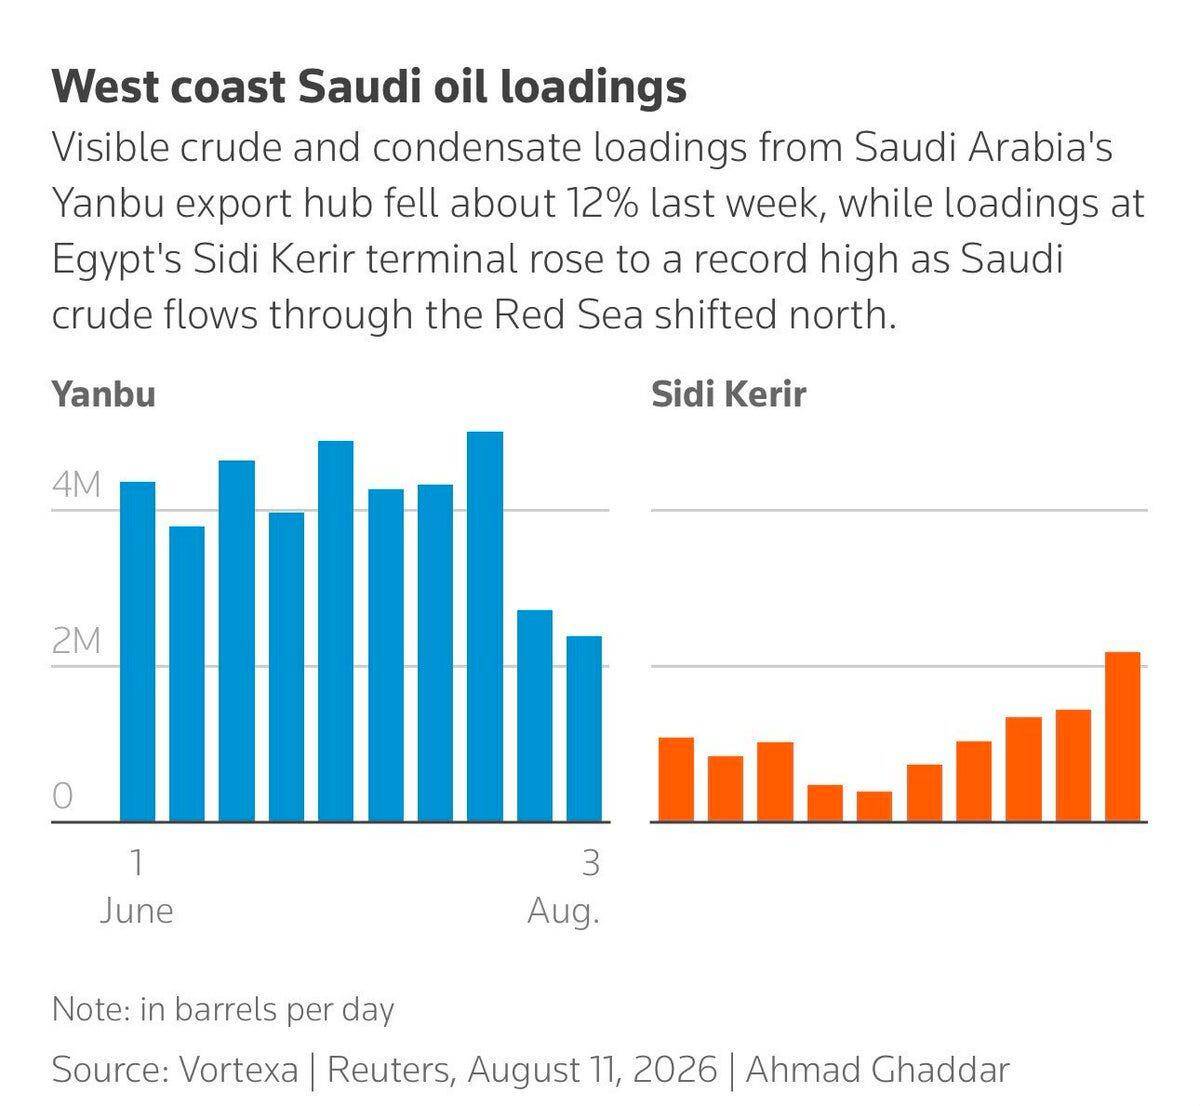
West coast Saudi oil loadings from Yanbu and Sidi Kerir. Source: Vortexa / Reuters, August 11, 2026.
China Crude Supply Squeeze Lifts Demand for Oman and ESPO Oil
Chinese refiners are tuned to process the middle eastern grades of crude. Saudi Arab Light, Arab Heavy, Basrah Medium, and Upper Zakum. These are all effectively cut off from China. So if we look at the greater strategic goals of The US, a war to win is not really the target. The war to disrupt Chinese imports is the goal. Force China to eat into national SPR reserves and clip their energy security wings. That’s the real game. From this chart below, guess which grade of oil China buys? Yes, the Oman one.
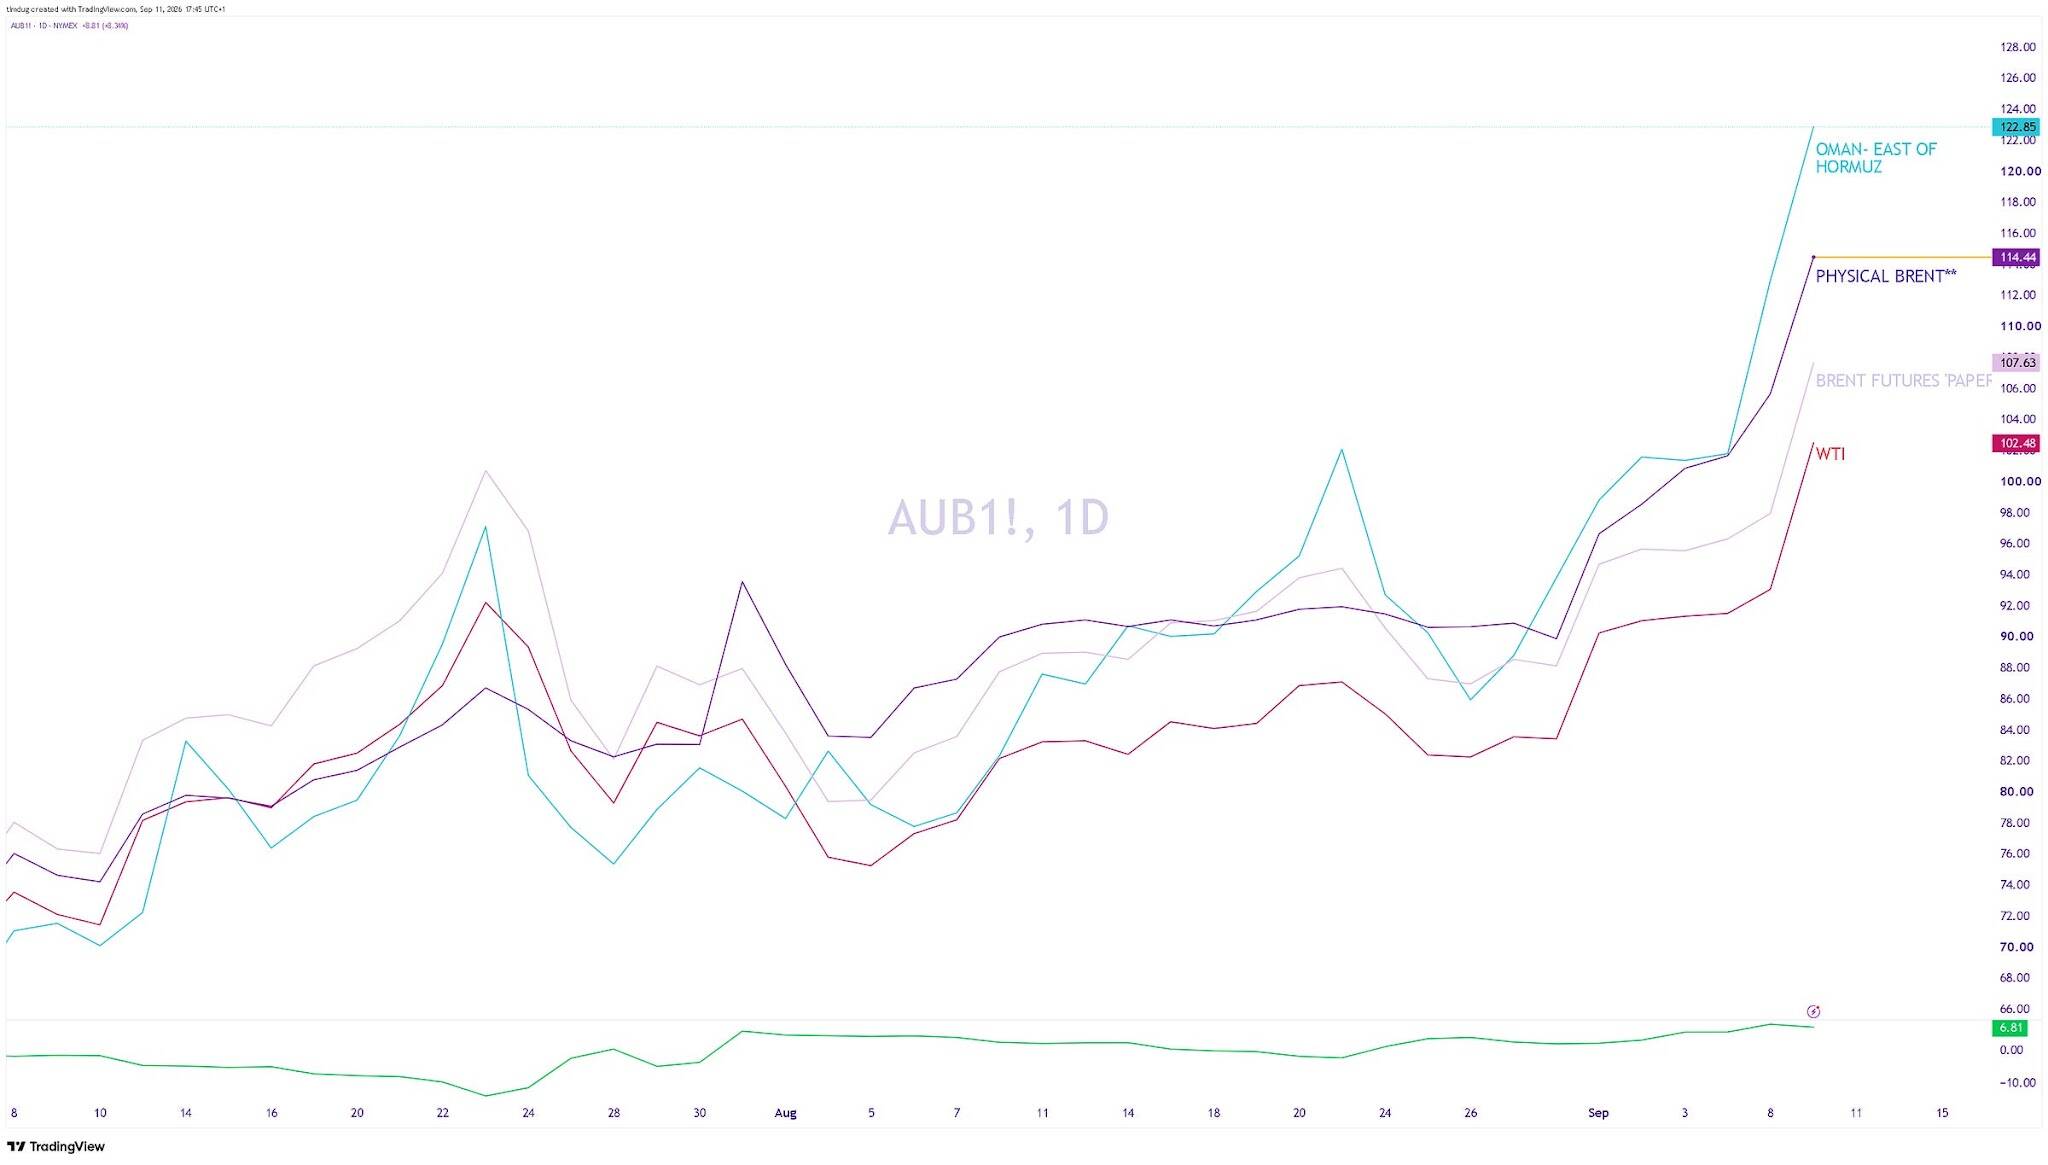
Crude benchmark price chart highlighting the bid for Oman crude relative to other regional grades. Source: TradingView.
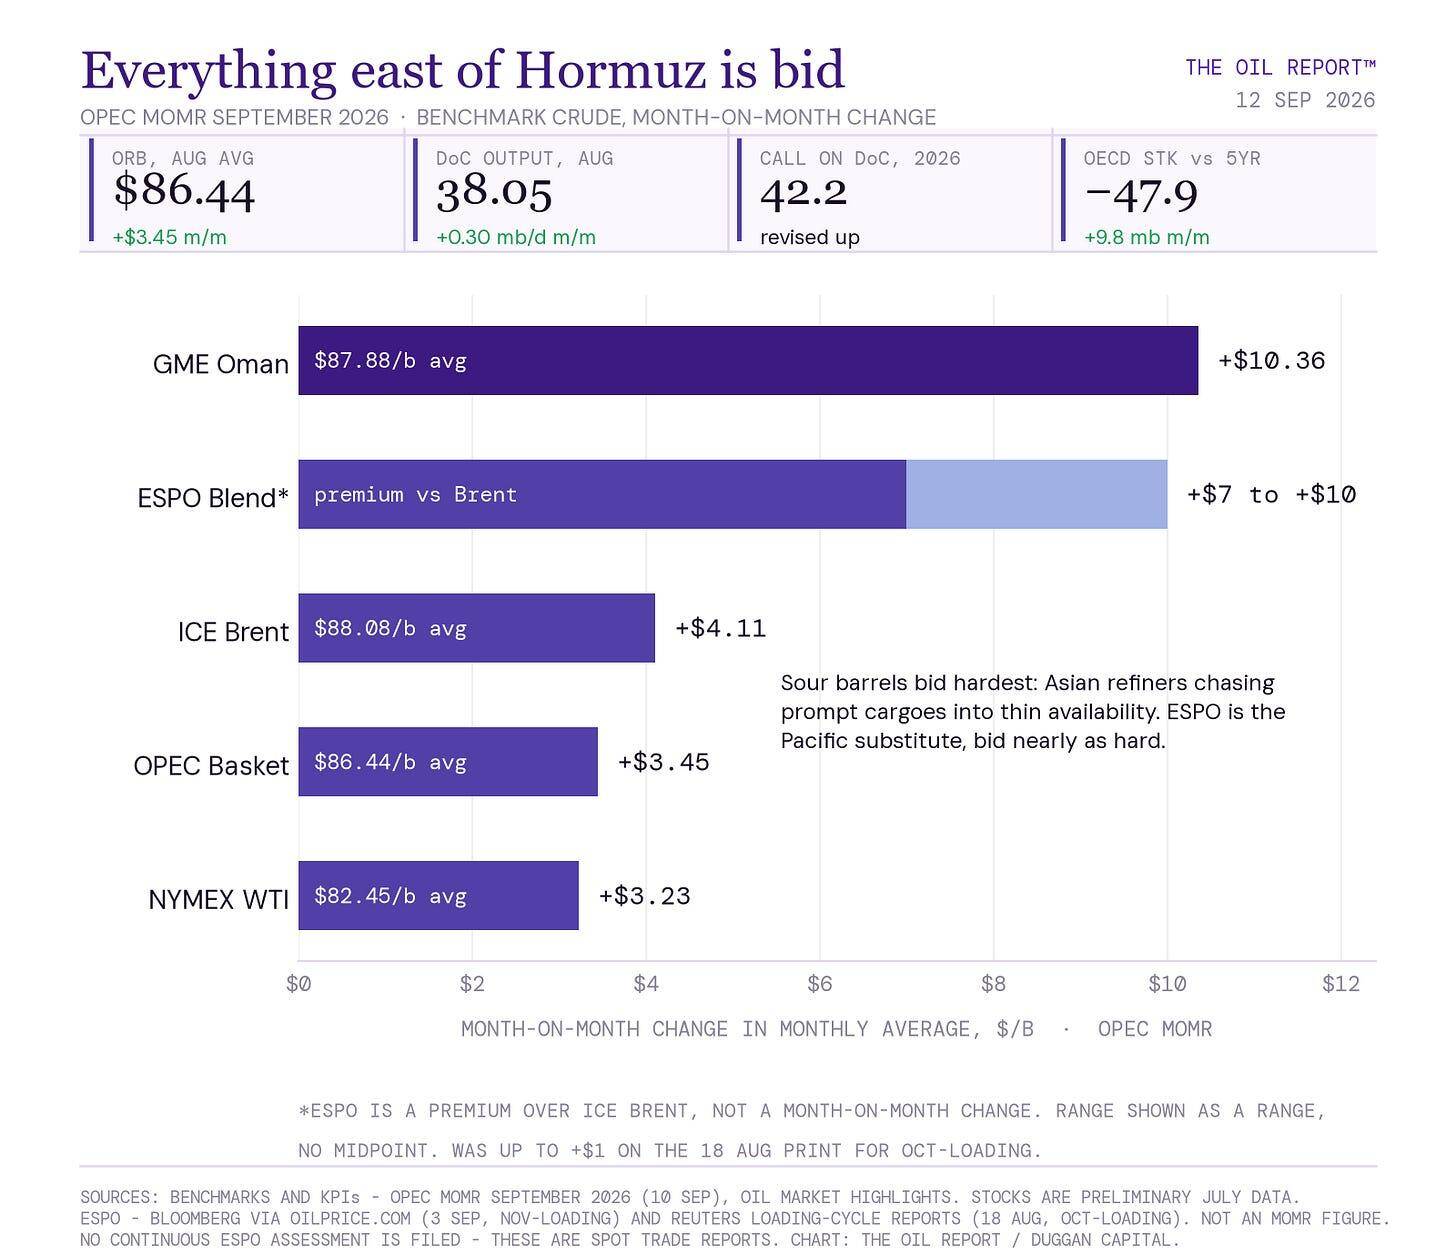
September 2026 benchmark crude moves, with Oman and ESPO outperforming Brent and WTI. Source: OPEC MOMR, Bloomberg and Reuters; chart by The Oil Report / Duggan Capital.
US Crude Inventory Data: EIA Flows Point to a Larger Stock Draw
Measured flows are the four pipes EIA actually meters on crude tanks: production + imports in, exports + refinery runs out, times 7 days. It’s what stocks should have changed by if those meters told the whole story.
This week they said tanks should have drained 1.62 mb – imports and production didn’t quite cover what refiners burned and exporters shipped. The headline only drew 0.39 because the SPR transfer and the adjustment (the unmeasured barrels) topped up the difference. Purple bar
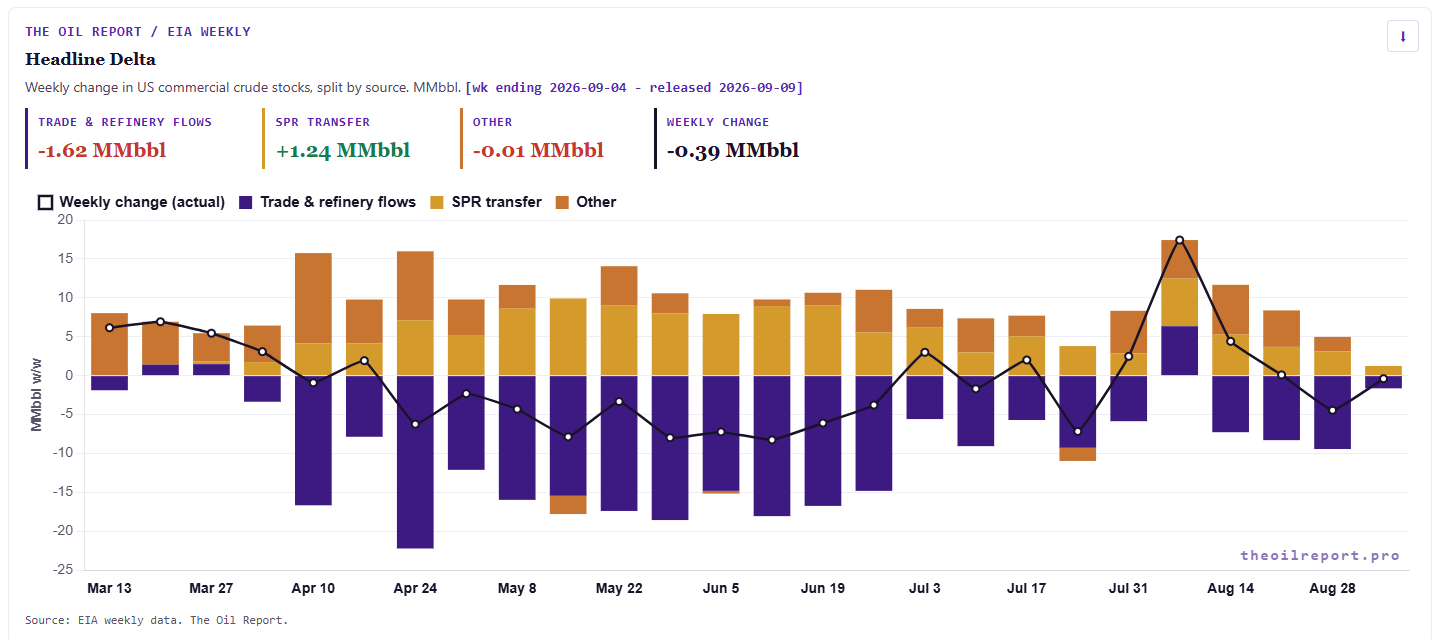
Weekly change in U.S. commercial crude stocks, split by trade/refinery flows, SPR transfers and other adjustments. Source: EIA weekly data / The Oil Report.
September OPEC Report: Oil Output Recovery Stalls as Brent and WTI Rise
Not really that important in the scheme of things at this time.
The main takeaway to track, is recovery is stalling, despite soundbites of 15mbd transits from The White House. As per the September OPEC report, Output has slipped from June 3.15mbpd to 0.3mbpd in Aug. Shut-in barrels came back fast, then stopped.
Prices recovered across the board in August – the OPEC Basket up $3.45/b to $86.44, Brent up $4.11 to $88.08, WTI up $3.23 to $82.45 – with hedge funds adding 12% to combined Brent/WTI net length between the weeks of 28 July and 25 August, concentrated in Brent.
Oil Market Outlook: Supply Shock Risks Leave Few Relief Valves
I have been trading single stocks and ETFs since about 2005. I placed my first futures trade in 2011 on WTI, getting long into the Libyan crisis that brought oil to $112/barrel WTI and 44 days of gasoline going up at the pumps. It was an action packed year to pop my futures trading cherry.
Ever since then, I have paid close attention to the macro on oil and how DXY moved on these types of geo risks. Im taking a long way round of saying, that is the time since, I have seen a few oil shocks and moves that would take your breath away. What is different about this situation, however, is that I have never seen this level of shock confluence, with no levers to pull to turn it around.
Bar a US withdrawal from the entire region, I see no intentions coupled with ability for oil production and shipping to rise at a ‘rescue’ rate. Venezuela? Guyana? Africa? These are all off the table as white night production basins. A mixture of old to ‘not existing yet’ infrastructure hobble their abilities. So where else can we look to for a hero? Canada. To be continued………..
COT Report: Speculators Build Bullish Crude Oil Positions
Combined NYMEX & ICE report: Big speculators are betting on higher oil prices: +411,159 contracts net long across all four crude markets, +6.7% on the week. That is a bigger long bet than they have held in 84% of the past two years. WTI alone looks more stretched at 94%; adding the four markets together brings it back to 84%. Taking the other side are the producers and the banks — producers holding fewer shorts than in 96% of the past two years, banks holding more than in 84%. Open contracts changed +1.0%, so this is new money rather than old bets changing hands. It shows where the crowd stands, not when it moves.
Careful to assume though this positioning holds through this week. In fact, a better presumption is that a lot of it changes Monday and Tuesday. I am developing a ‘nowcasting’ system to give me estimates of MM changes in positioning each day in real-time.
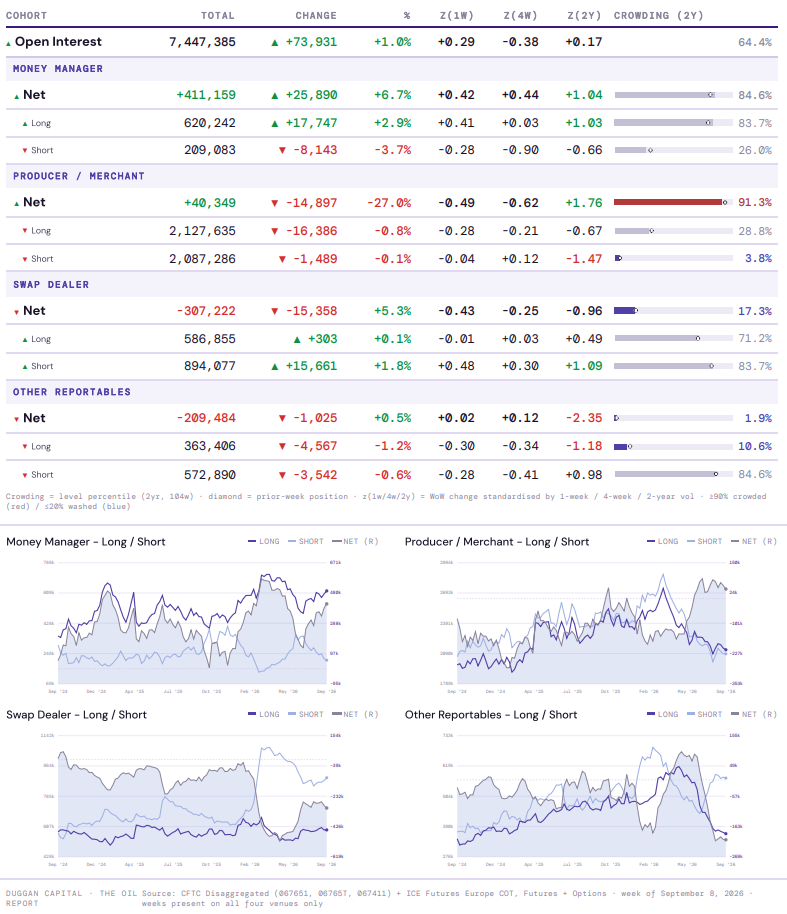
Combined NYMEX and ICE crude oil futures and options positioning. Source: CFTC Disaggregated COT data / The Oil Report / Duggan Capital.
Brent Oil Trade Outlook: Key Bearish Falsifiers to Watch
The falsifiers to this week’s price action.
- Trump turns on his heels and there is a US withdrawal of troops. Given the new strategic push from The Houthis, I see this as being an extremely low probability.
If the US Navy were to withdraw, while Saudi are under such threat, it would probably cause Saudi to rethink their holdings of US treasuries. We would then see Scott Bessent at work again trying to plug more holes. - China withdraws from crude oil imports market. I see this also below a 30% probability. If they are to do so, this would bring them back to drawing from their SPR reserves. It is my view that this is the US strategy that China will not want to play into. Pay the higher price, don’t cut into their energy security buffers.
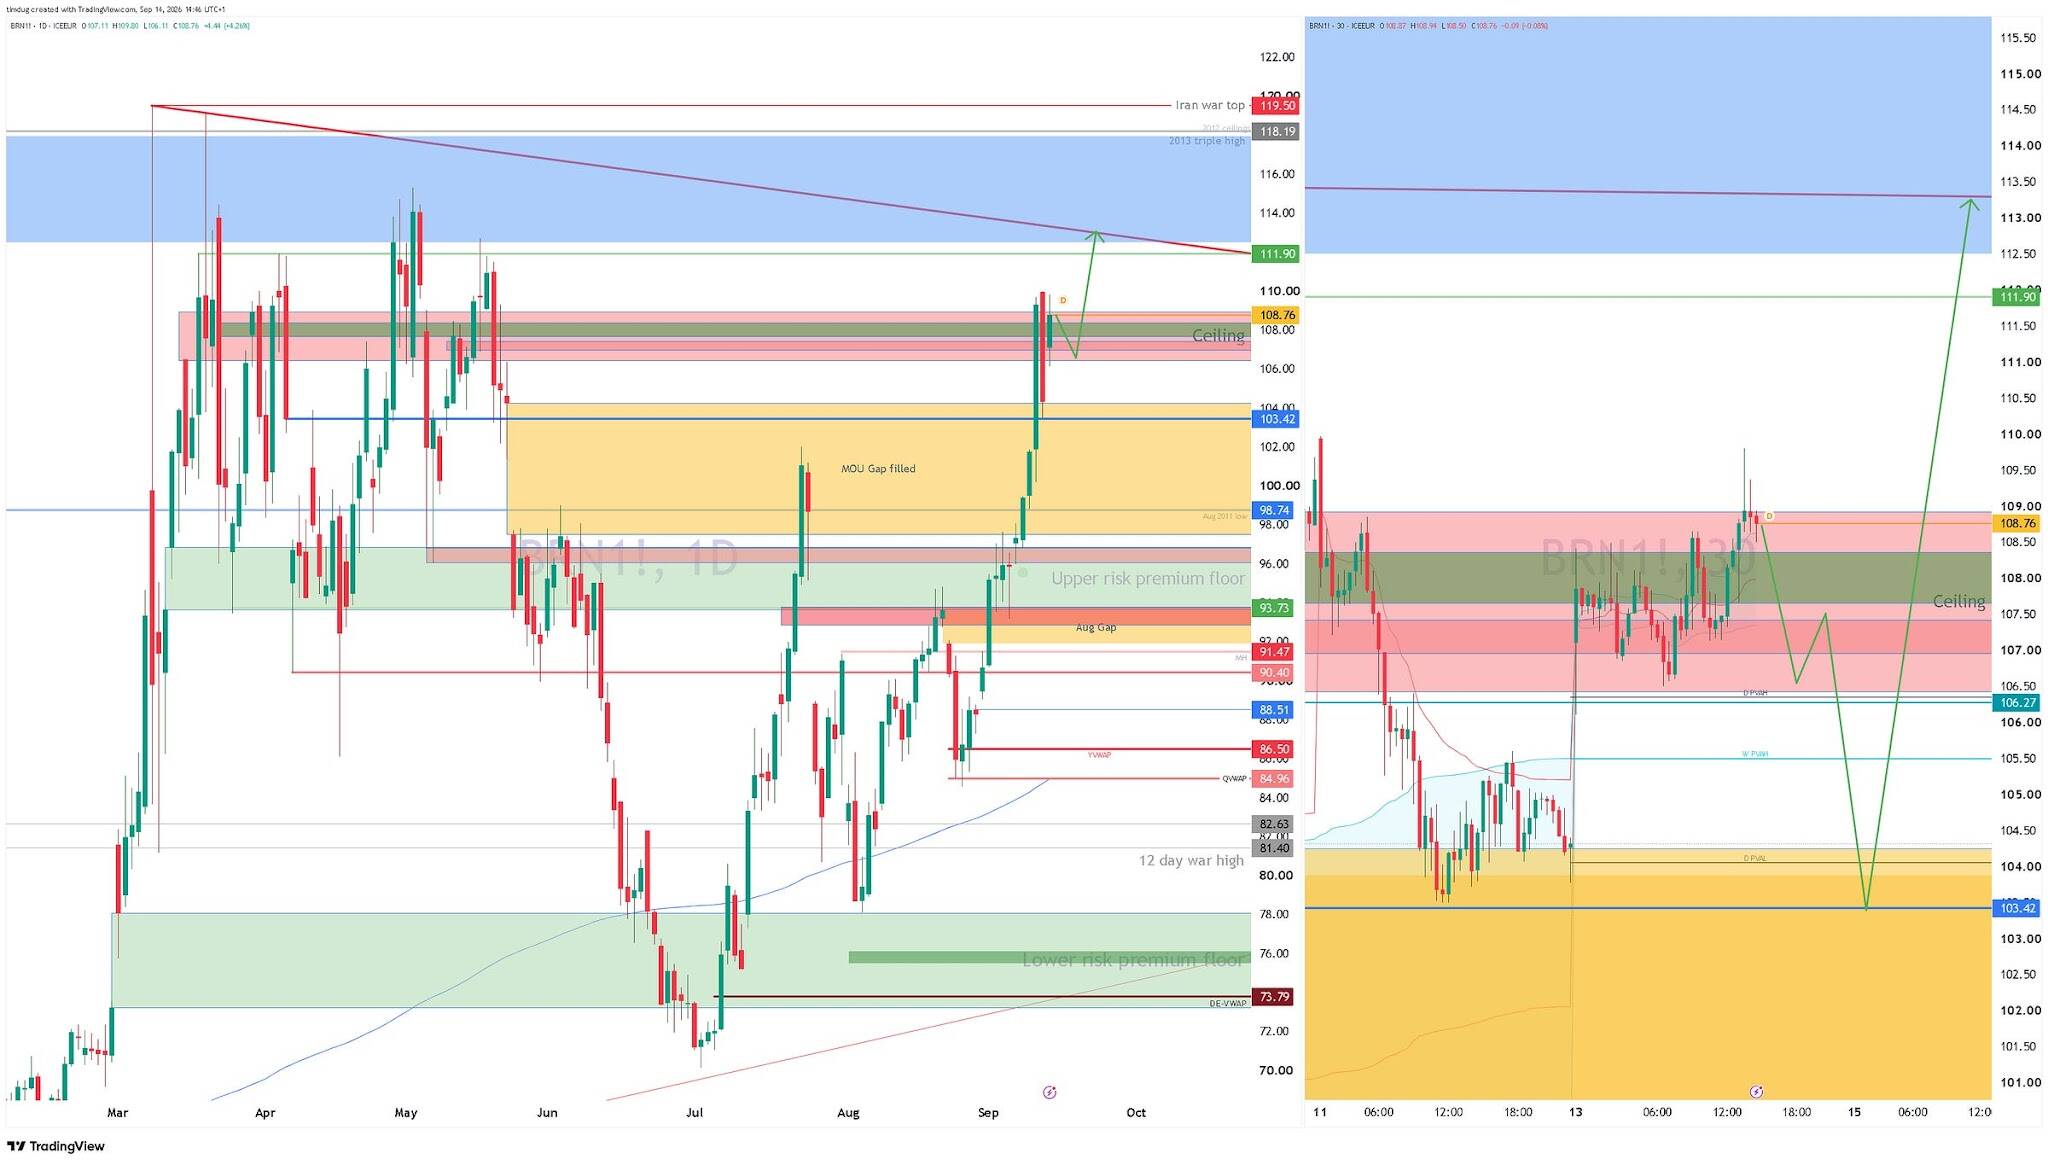
Brent daily and 320-minute charts showing key support, resistance and projected paths. Source: TradingView.
If the falsifiers happen, specifically the withdrawal of naval assets, here is what I would be looking at.
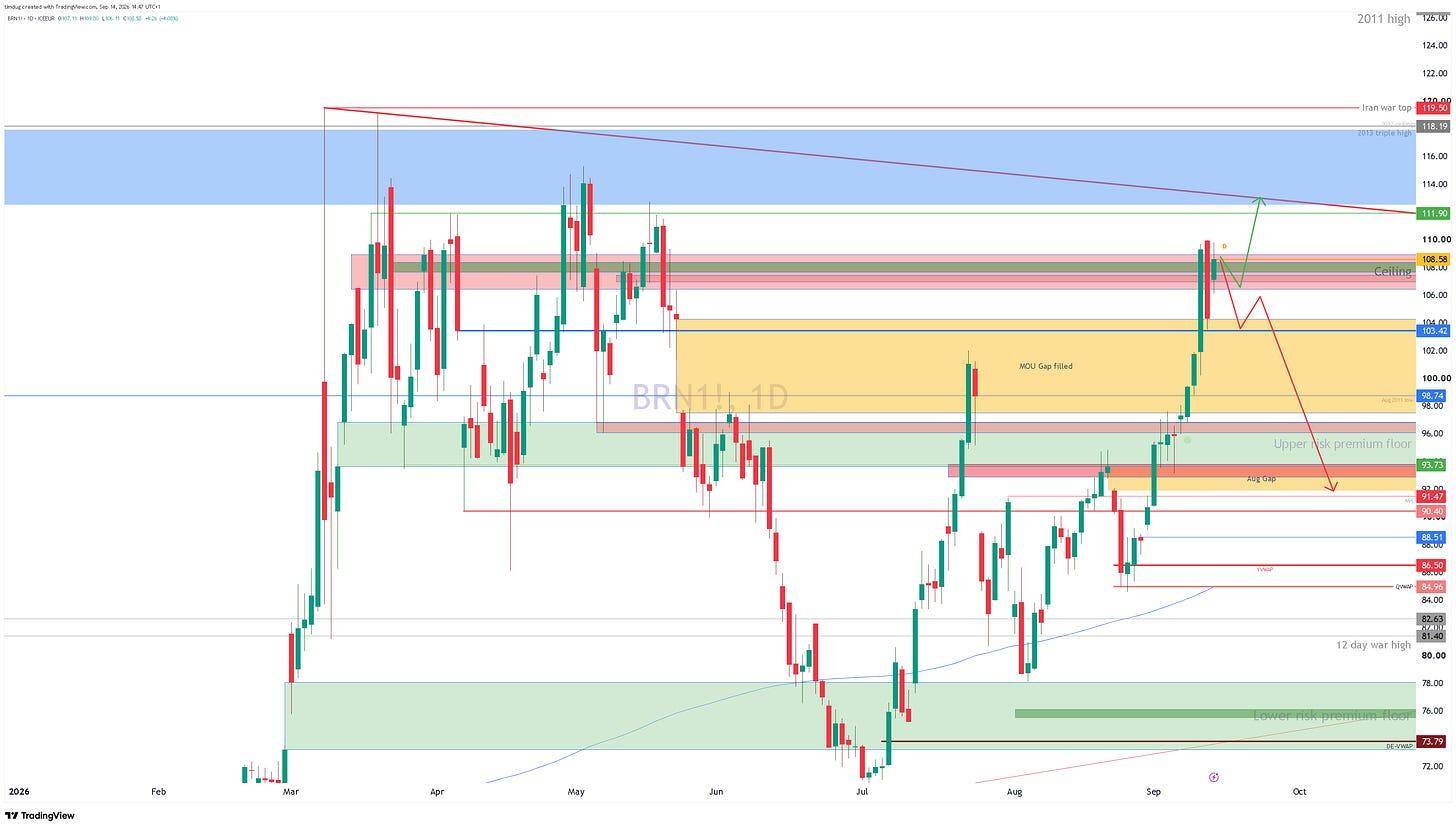
Brent daily chart with key support and resistance zones. Source: TradingView.