



Oil has barely reacted to a disruption already removing hundreds of millions of barrels, implying the market expects a quick resolution. If that assumption is wrong, the repricing higher has not started yet.
The issue is not just lost supply, but inaccessible spare capacity trapped behind the Strait of Hormuz. The shock is larger than historical precedents and resolves far slower than the market is pricing.
Positioning data shows extreme length via swap dealers and rising open interest. That supports the macro bullish case but increases the risk of sharp tactical pullbacks.
The Week As It Progressed



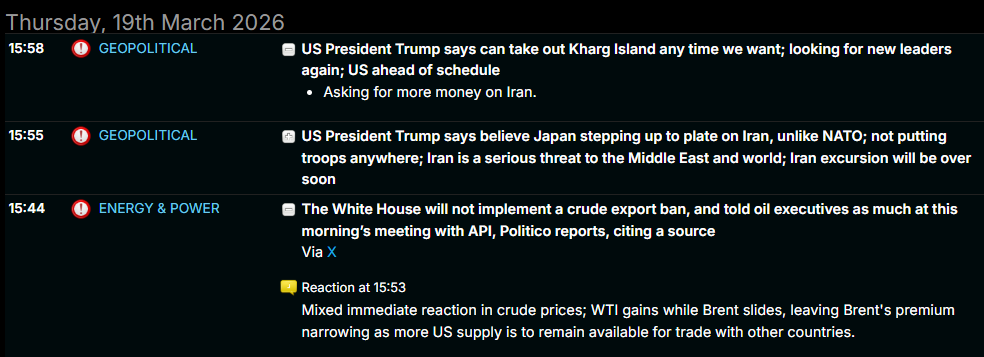
Source: Newsquawk.com
Market Is Underpricing A Structural Supply Shock
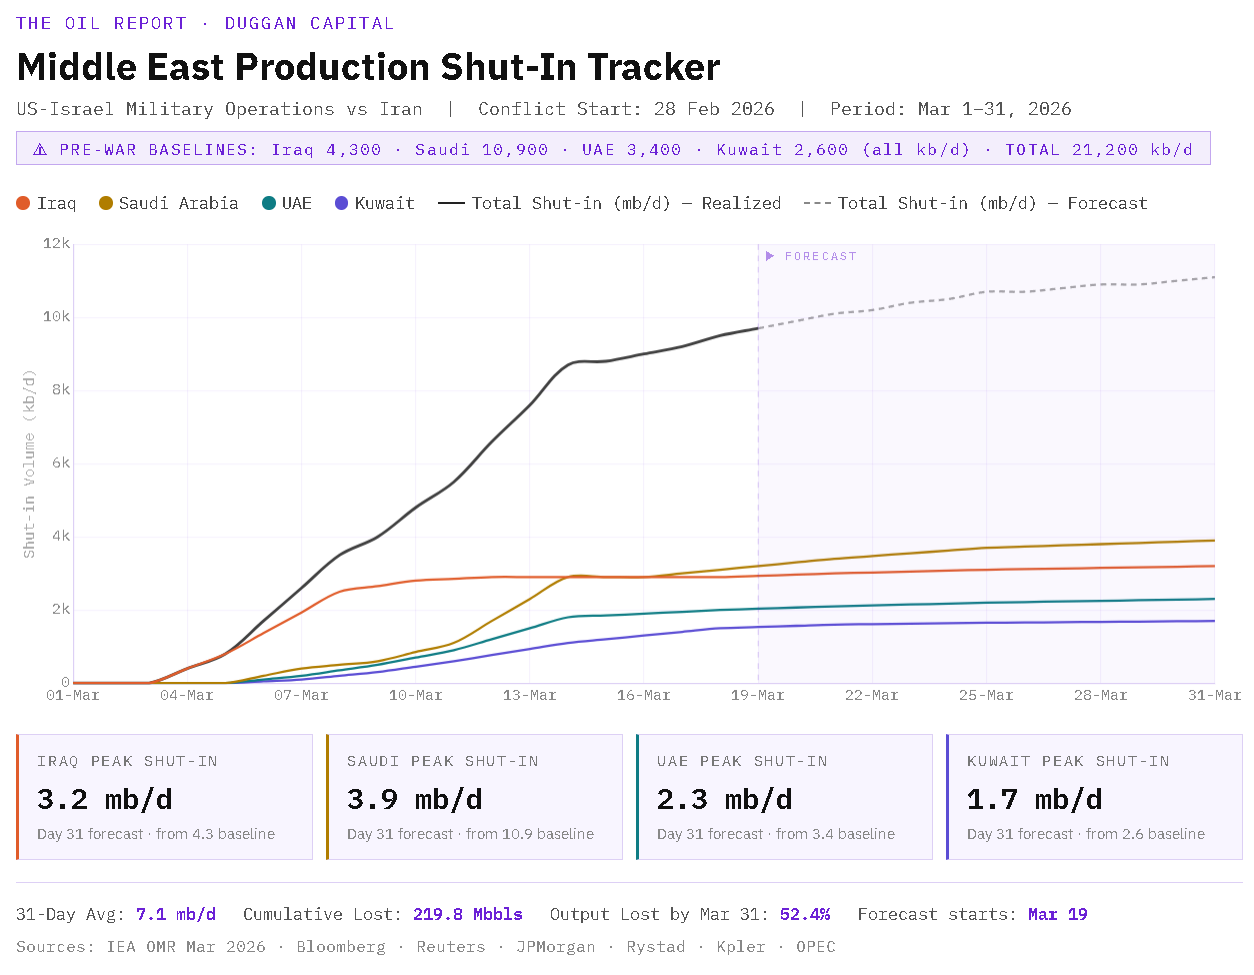
Twenty days in, the Hormuz disruption has already consumed the equivalent of 200-400 million barrels. The surplus that was supposed to define 2026 has been smashed. Iran is charging tolls on the world’s most critical waterway. Qatar just lost 17% of its LNG capacity for up to five years. And oil is only modestly higher-which means the market still thinks this is short. It may be pricing the wrong war.
Brent Oil Price Forecast
Every new Brent Oil analysis as it publishes, today's technical signal and key levels, live price — on one page.
See all Brent Oil forecastsSince the Strait of Hormuz was effectively ‘closed’ on March 1st, somewhere between 10 and 20 mb/d of export flow has been disrupted. Over the first twenty days of the conflict, that translates to between 200 and 400 million barrels of oil that did not reach its destination. Annualize the disruption and it strips 0.5 to 1.0 mb/d from 2026’s average supply figure-and that number grows with every week the choke point remains closed.
The pre-war surplus was always going to be tested by something. This is something.

What Hasn’t Happened Yet
‘‘Greatest global energy security threat in history. Some facilities will take six months to be operational, others much longer. People understand this represents a major challenge, but I am not sure the magnitude and consequences of the situation are well understood. These are vital raw materials for the global economy’’
IEA’s Head, Fatih Birol in The FT
The EIA STEO, finalising its March forecast with Brent at $104/b on March 9th, assumed shut-ins peak in early April and ease gradually as transit resumes. That is the optimistic scenario-the one where the conflict is contained, the escorts work, and insurance markets recover their nerve. It may well prove correct. But it is worth noting that the EIA was also assuming no major infrastructure strikes when Qatar Energy’s Ras Laffan trains took a missile on March 19th.
The most telling signal is not what oil has done. It is what oil has not done. Prices are elevated but not panicked. The market is not pricing a multi-quarter closure. It is pricing a disruption that ends-probably soon, and probably with some form of US naval enforcement of transit. That may be right. But if it is wrong, the move higher has barely started. Currently, the market is essentially selling insurance against duration. That is not obviously a bad trade. It is just not obviously a good one either.
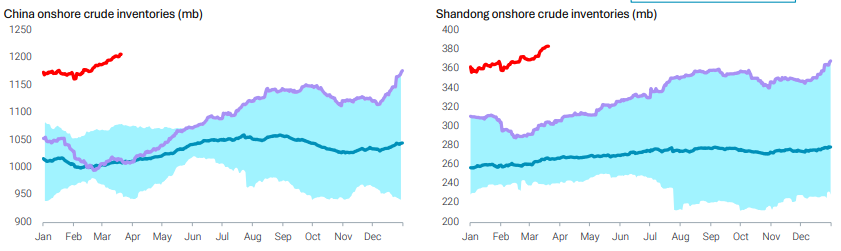
A Look at China
Guess who is already implementing fuel rationing, while sitting on bulging storage.

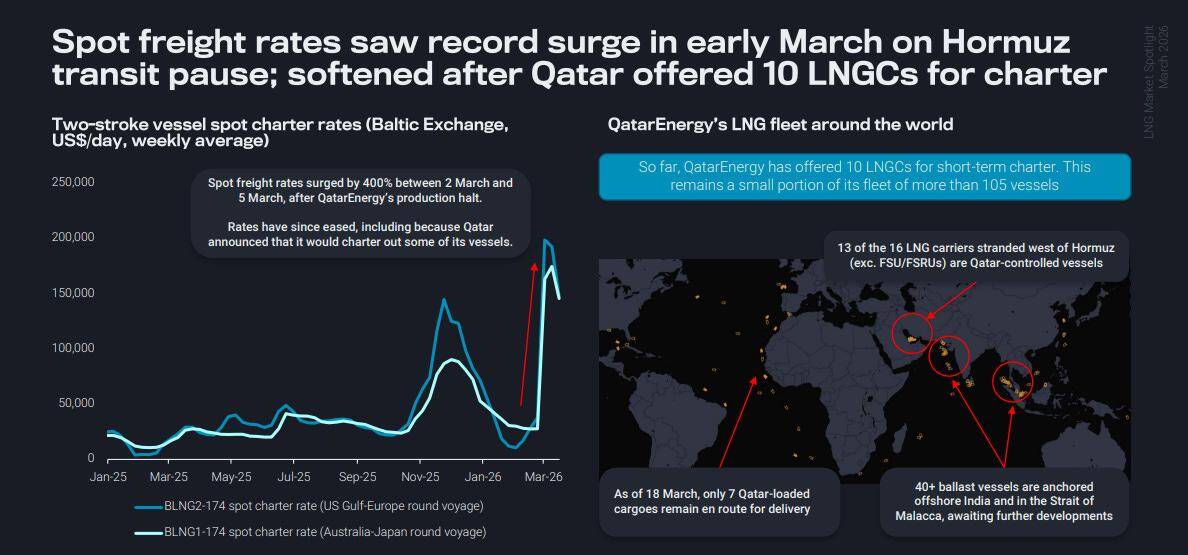
Freight Rates & LNG
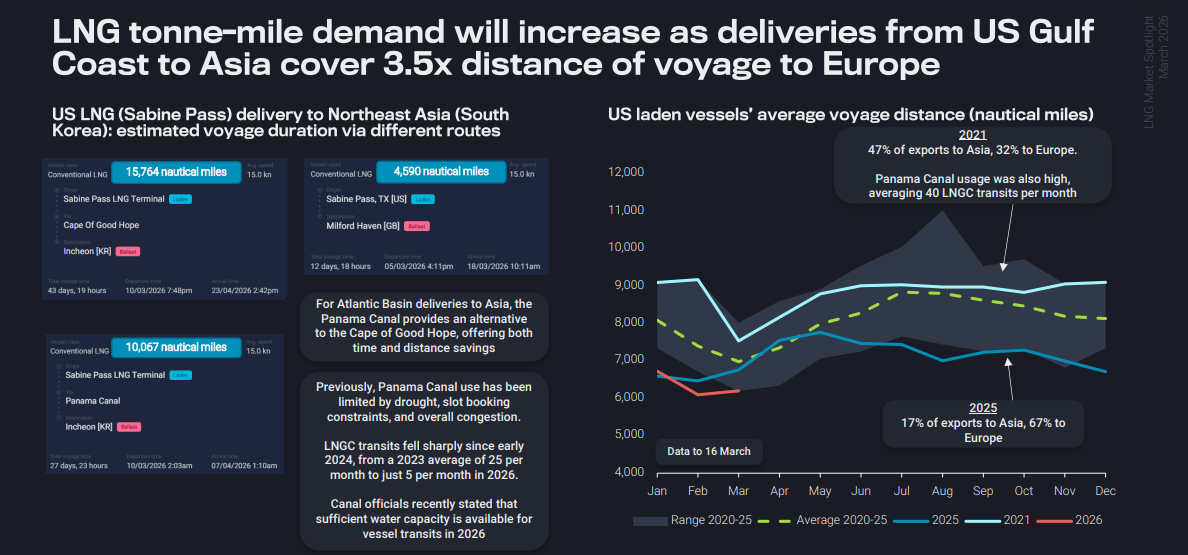
When the Strait of Hormuz closed to LNG tankers, shipping rates went through the roof-up 400% in three days-as companies scrambled to lock in vessels. Qatar then released 10 of its tankers onto the market, which took some heat out of the immediate panic. Qatar didn’t volunteer spare capacity out of goodwill- it simply had no cargo to put on those ships after its production was forced offline. The underlying problem remains very much intact. Tankers can no longer take the short route through the Gulf. Vessels are now sailing either around the bottom of Africa or through the Panama Canal-adding weeks to each voyage and tying up ships far longer. Fewer effective vessels, longer routes, disrupted supply: freight rates reflect a market under genuine structural stress, not one that has found its footing.
And while we are on gas. If I had a magic wand, I couldn’t create a better bull thesis for any company that produces or makes money from extracting gas in Europe . It’s called NRT -3.46%↓ and pays an 11% divvy. We have done a deep DD (due diligence) on NRT in-house and I suggest you do your own as this is not investment or trading advice.
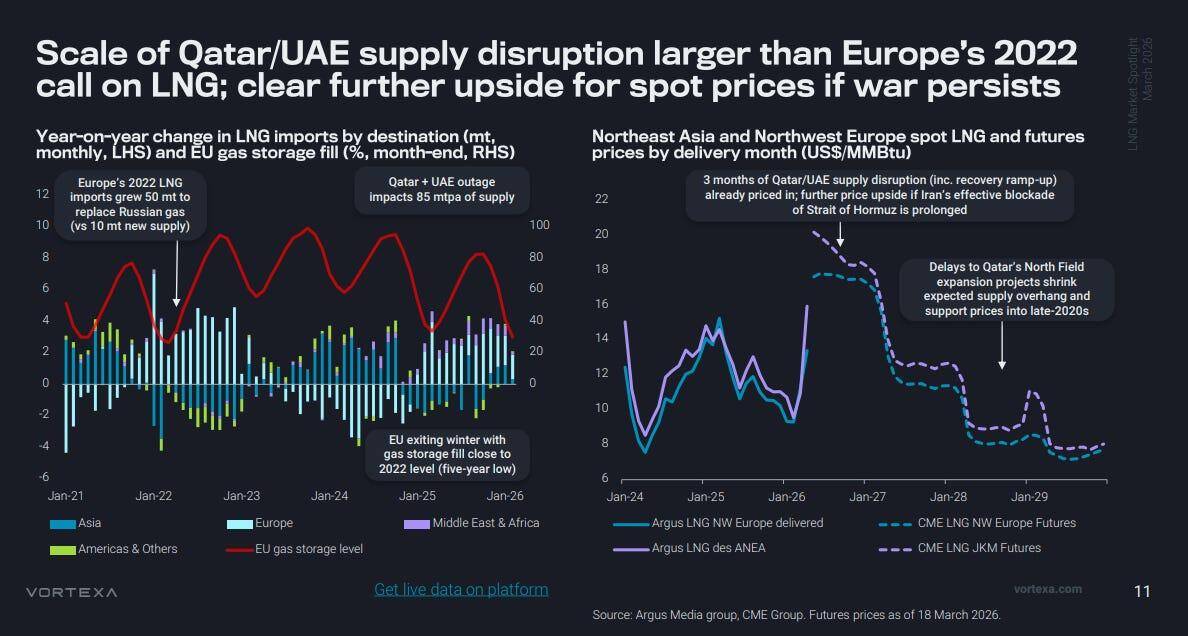
Source: Vortexa
Greater Asia Also Getting Hit
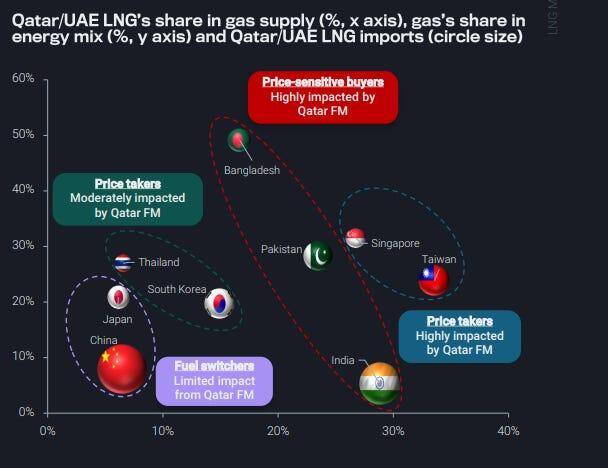
Source: Vortexa
No TACO? Drain the Glut
Trump 1.0, drain the swamp. Trump 2.0, drain ‘The Glut’.
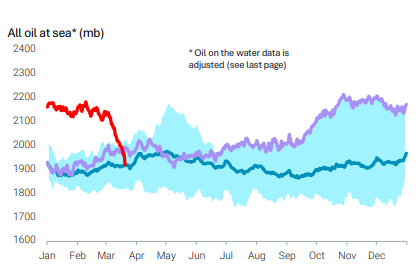
All along, people have denied there was a glut of oil. Well, there WAS a glut. It was sanctioned oil from Venezuela, Iran, Russia and anywhere else that was on the naughty boys list. Failure to understand this or to deny there was a glut was a failure to understand the details. I think we now can full lay to rest the glut chat. But what happened? Trump needed a pressure value to open in the absence of a TACO.
- Lifted sanctions on Venezuelan oil.
- Lifted sanction on Russian oil on water/ in transit/glut oil.
- Lifting sanctions now on Iranian oil on water/ in transit/glut oil.
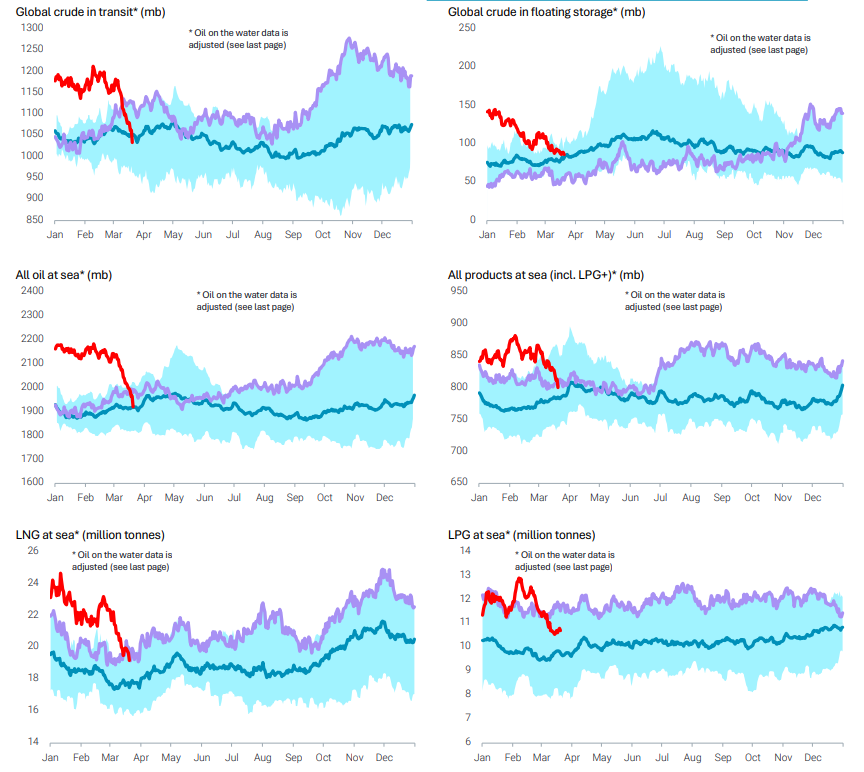
See the way the chart was at +220million? Now it’s back to 1.9m .ie the 5yur average? So just tot up the scores.
- G7 +400mb.
- Drain the Glut +130mb.
- OPEC Increase production from March +206kbpd.

Inflation: Remain Seated….
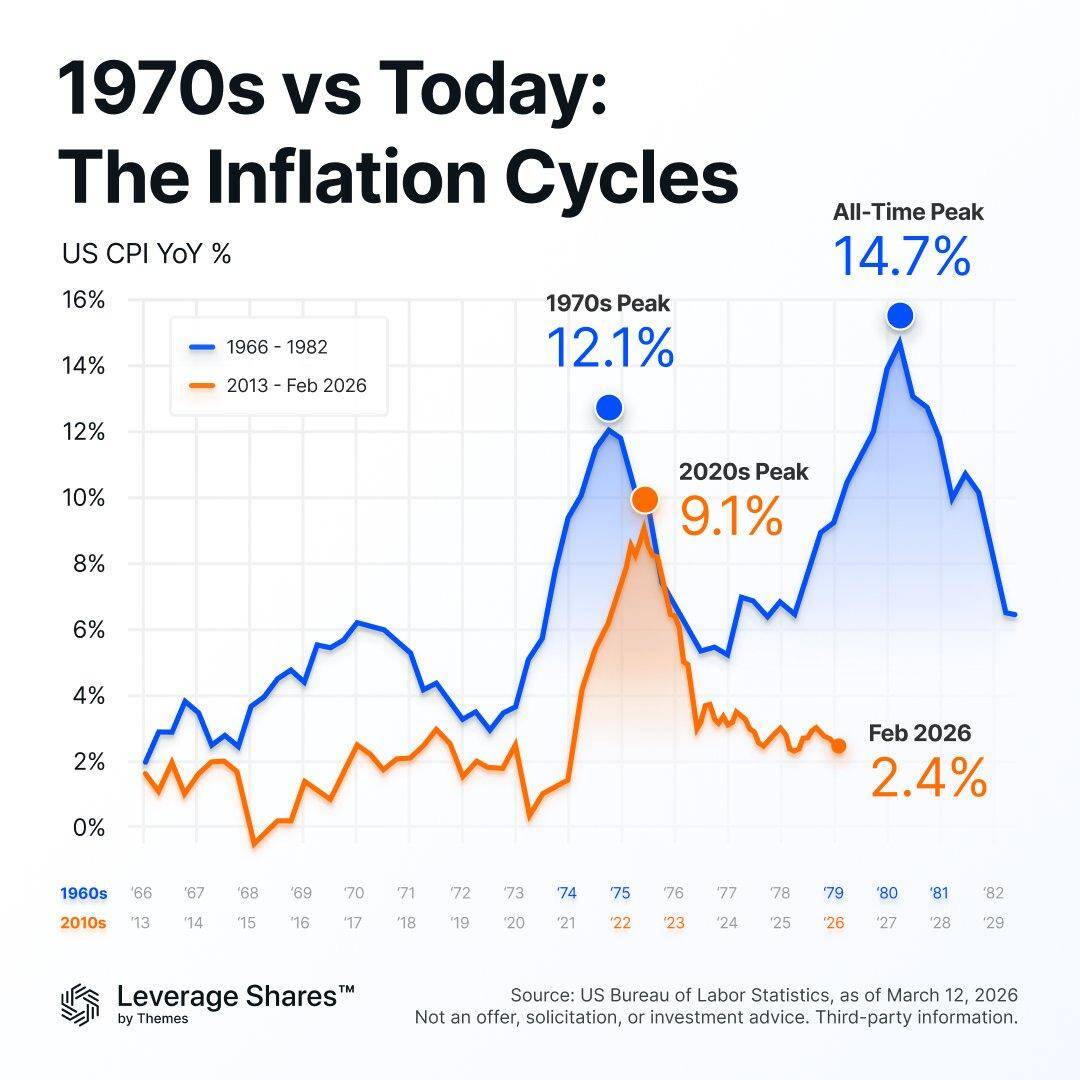
The 1973 inflation mirror undersells what is actually happening. The 70’s Arab embargo was, at its core, a political gesture dressed up as an energy crisis – barrels were redirected, not destroyed, and the realized supply loss was manageable precisely because the global market had room to absorb it. Saudi Arabia could turn taps. Alternative routes existed. 1973 removed 7% of global supply. Today’s Hormuz disruption threatens close to 20% – nearly three times as large, with no comparable historical precedent.
The system bent but did not break. Today, the numbers are simply in a different category. Close to 20 million barrels per day moved through Hormuz before this started. The bulk of that is now gone – the IEA estimates nearly 10 million barrels per day of total liquids physically shut in across Gulf producers. That is twice the Iranian Revolution. Twice the Gulf War. There is no modern template for a disruption of this size.
The deeper problem is not the volume – it is the architecture. Every prior oil shock since 1973 played out against a backdrop of significant idle production capacity sitting in the Gulf, ready to cushion the blow within weeks. That buffer is still there in theory. In practice, it is completely inaccessible – locked behind the same choke point that triggered the crisis in the first place. Meanwhile, the forces that will eventually bring prices back – US shale responding to the price signal, strategic reserve releases, demand destruction – are real but slow. They work over quarters. The shortage works over weeks. That gap between the pace of the problem and the pace of the fix is where the inflation is going to live. As mentioned in a note last week. I am long TAGS 1.08%↑ and CANE 0.77%↑ and always NRT -3.46%↓ .
Macro: Gold, Rates, and Oil
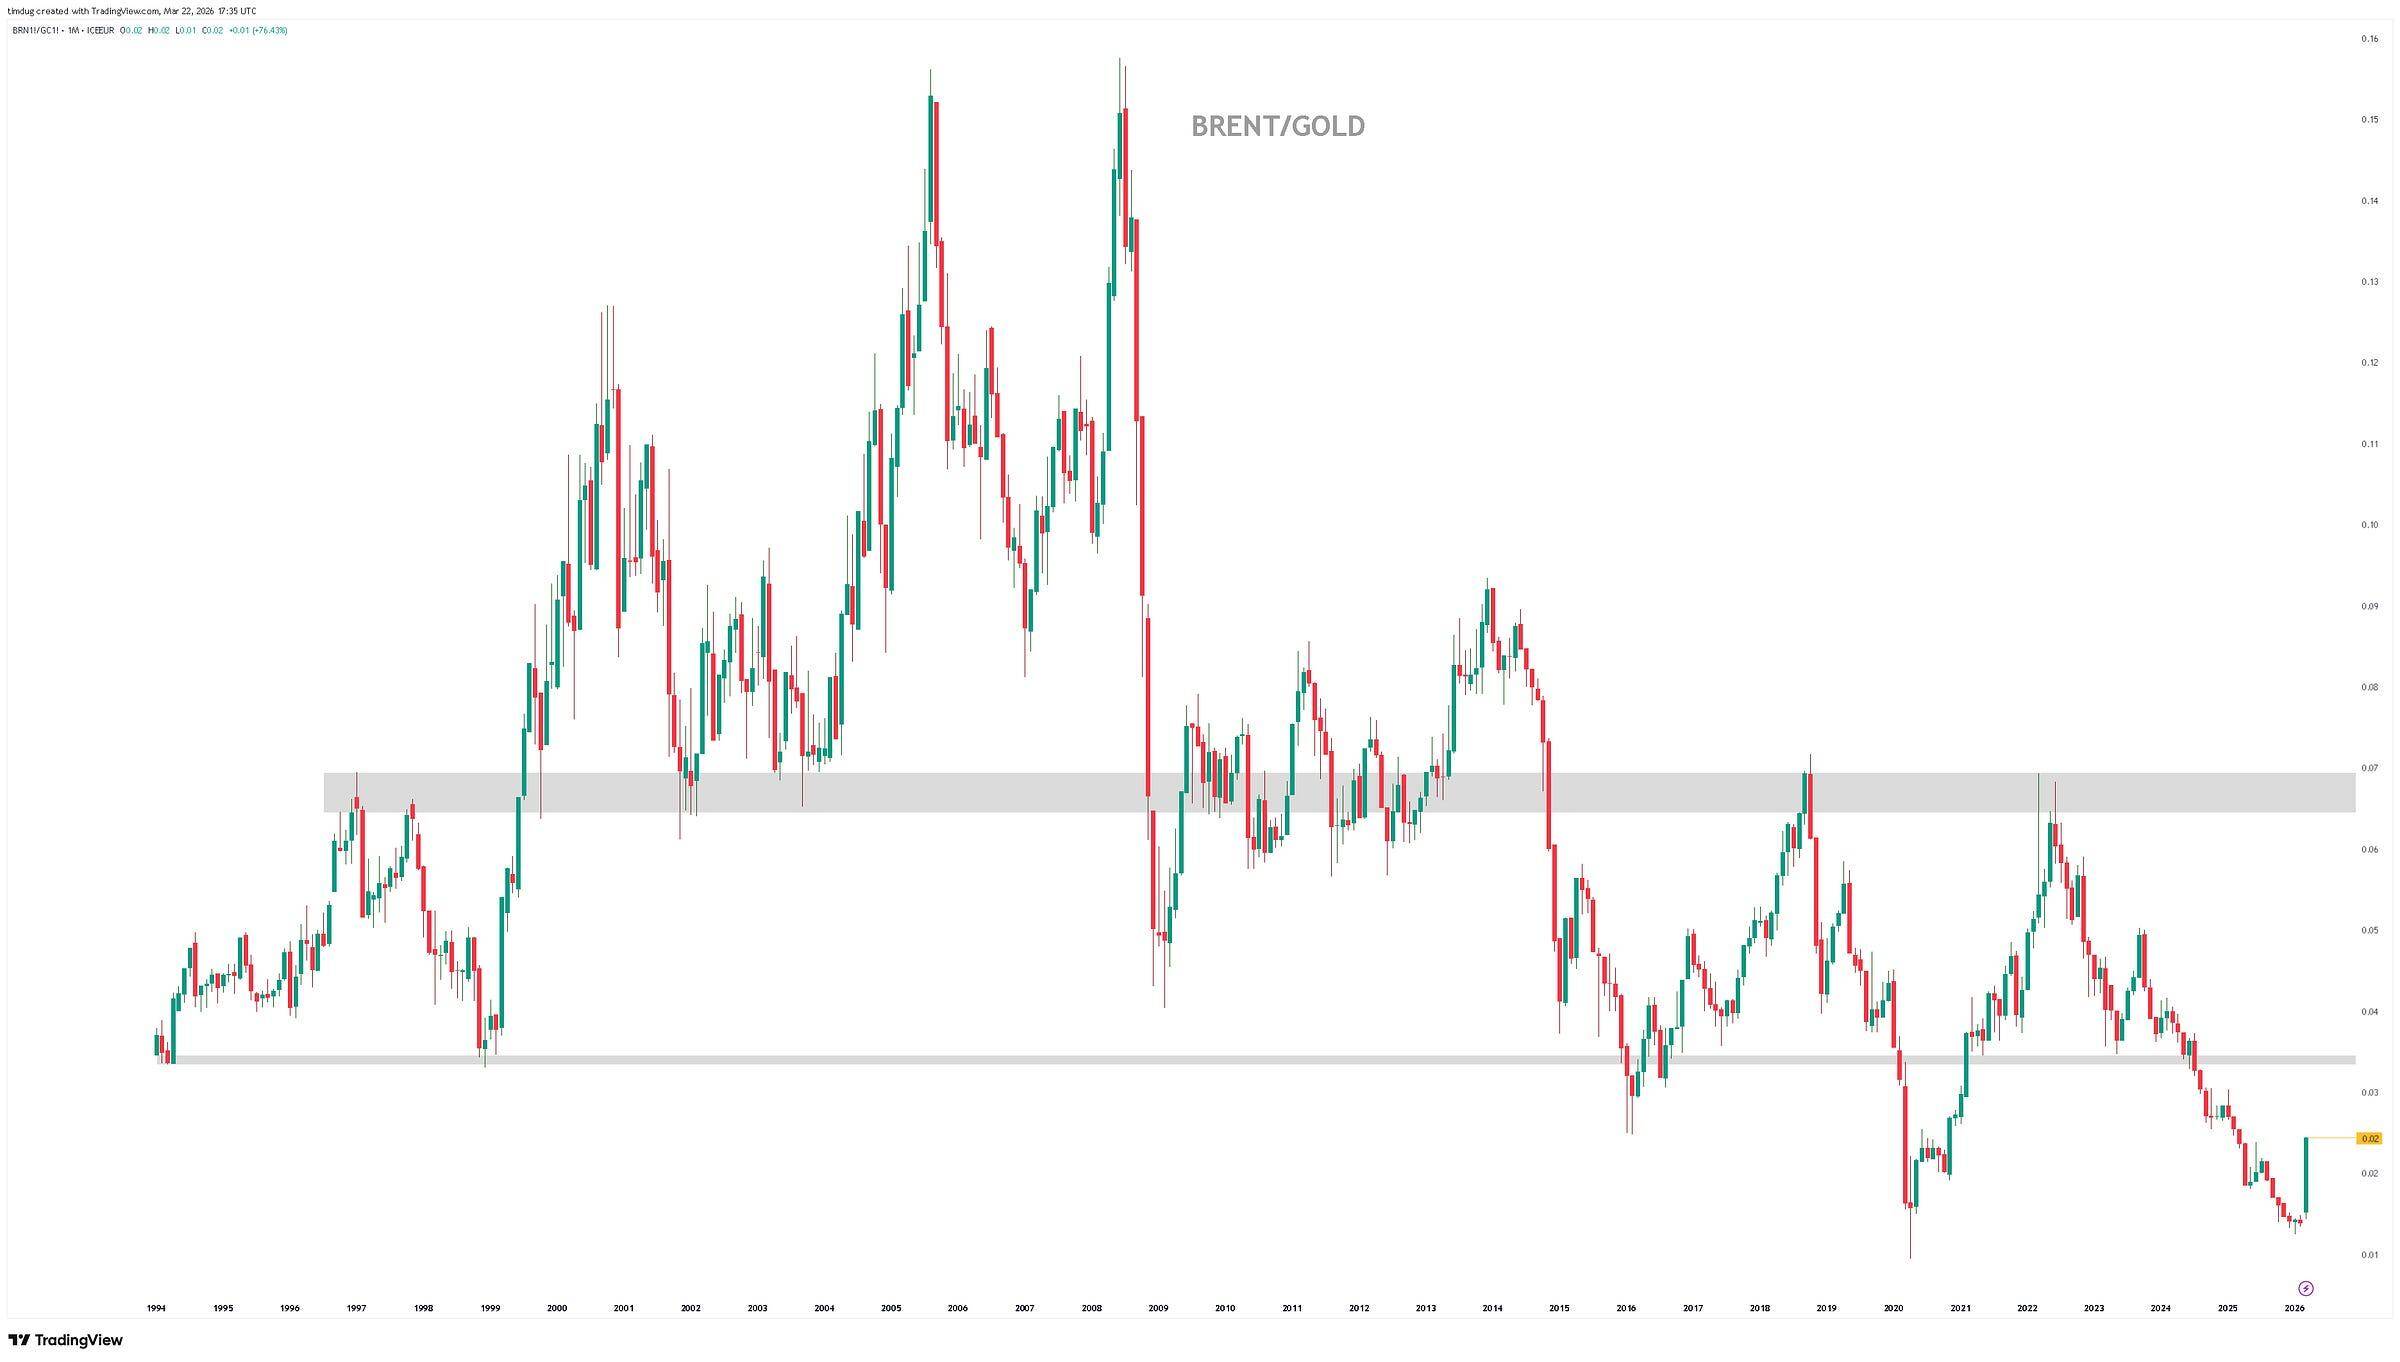
The gold-oil relationship is flashing and everyone is talking about golds move last week. I highly suggest if you are interested in Gold-have a look at VBL GoldFix. An exceptional resource for metals and macro- A Friend of the Oil Report.
Simply put, people are deleveraging out precious metals to cover their equity positions. A standard move. Gold doesn’t actually rally during the crisis periods as traders are selling out of it to cover their ass elsewhere. It rallies afterwards when things like QE happen, money printing, fiat debasement, etc. Think long burn risk rather than immediate crisis risk asset.
Central banks are not in the rate-cutting mode markets hoped for three months ago and are looking at hikes, not cuts. The inflation impulse from an oil shock of this magnitude would, if sustained, force a hawkish pivot. Central banks are watching and ready to act-the question is in which direction: hiking to suppress energy-driven inflation, or cutting to offset the growth shock. Oil above $90 for a quarter forces the former. Both outcomes are bad for risk assets.
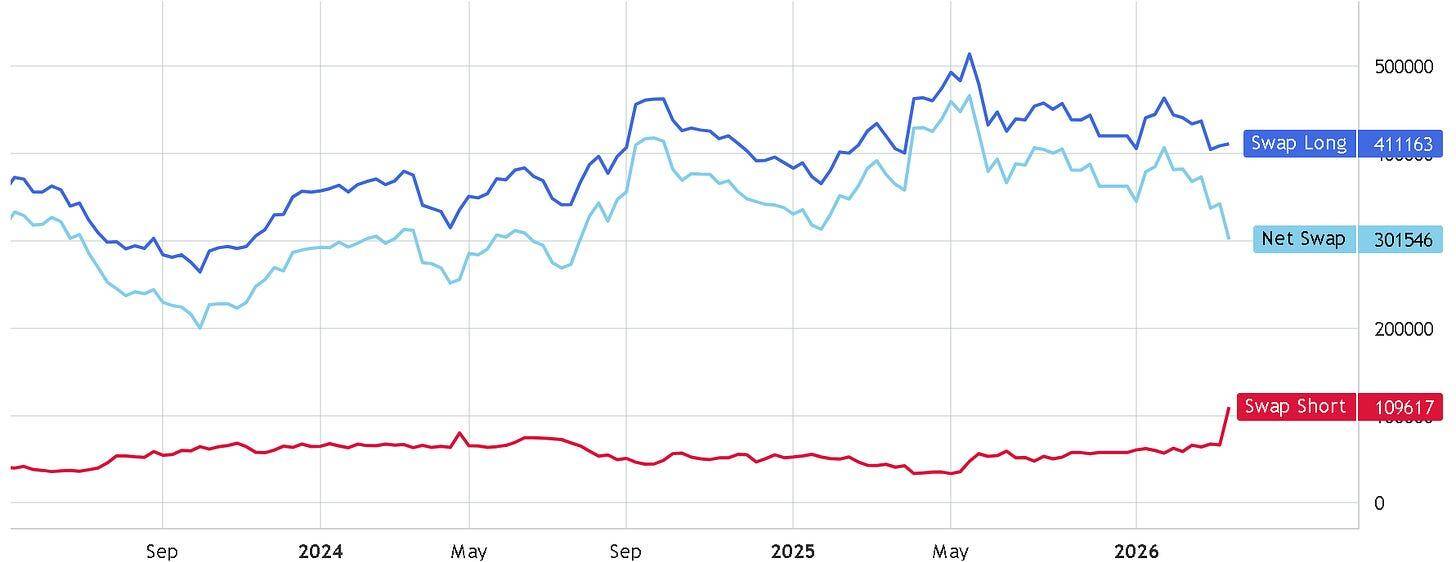
Commitment Of Traders Report
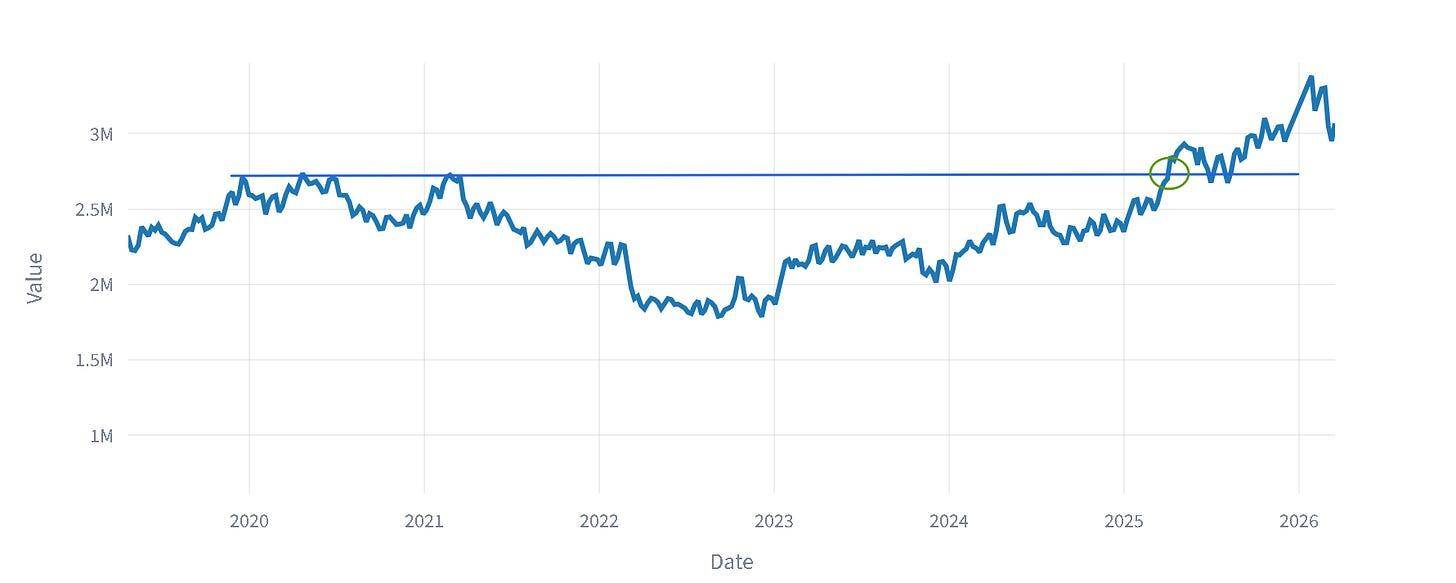
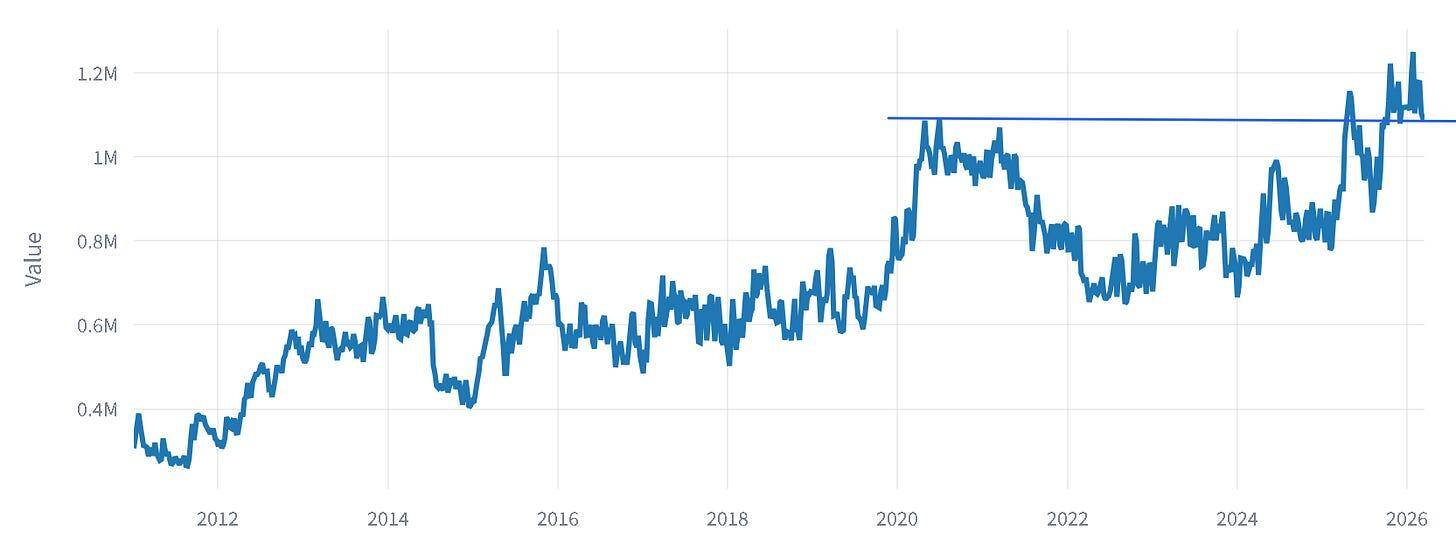
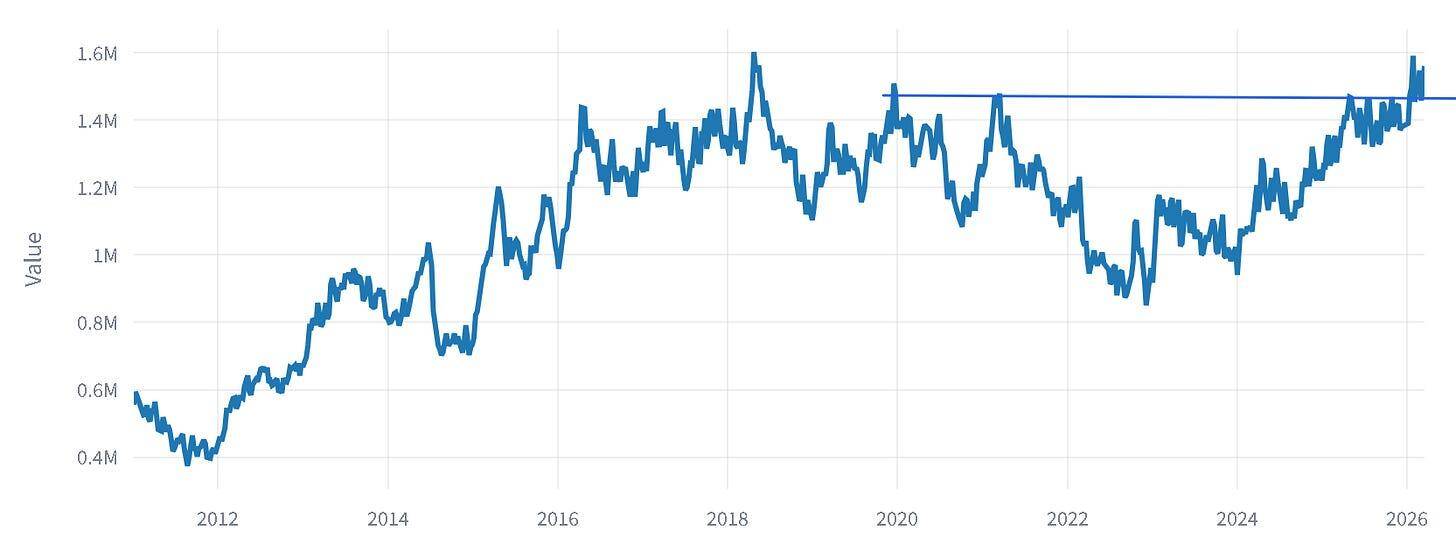
In summary: Brent open interest broke out to new highs last March in the heating up to the 12 day war. Since then, open interest has found a new higher level to level above. The 2018 and 2020 highs. MOGA- Make oil great again.
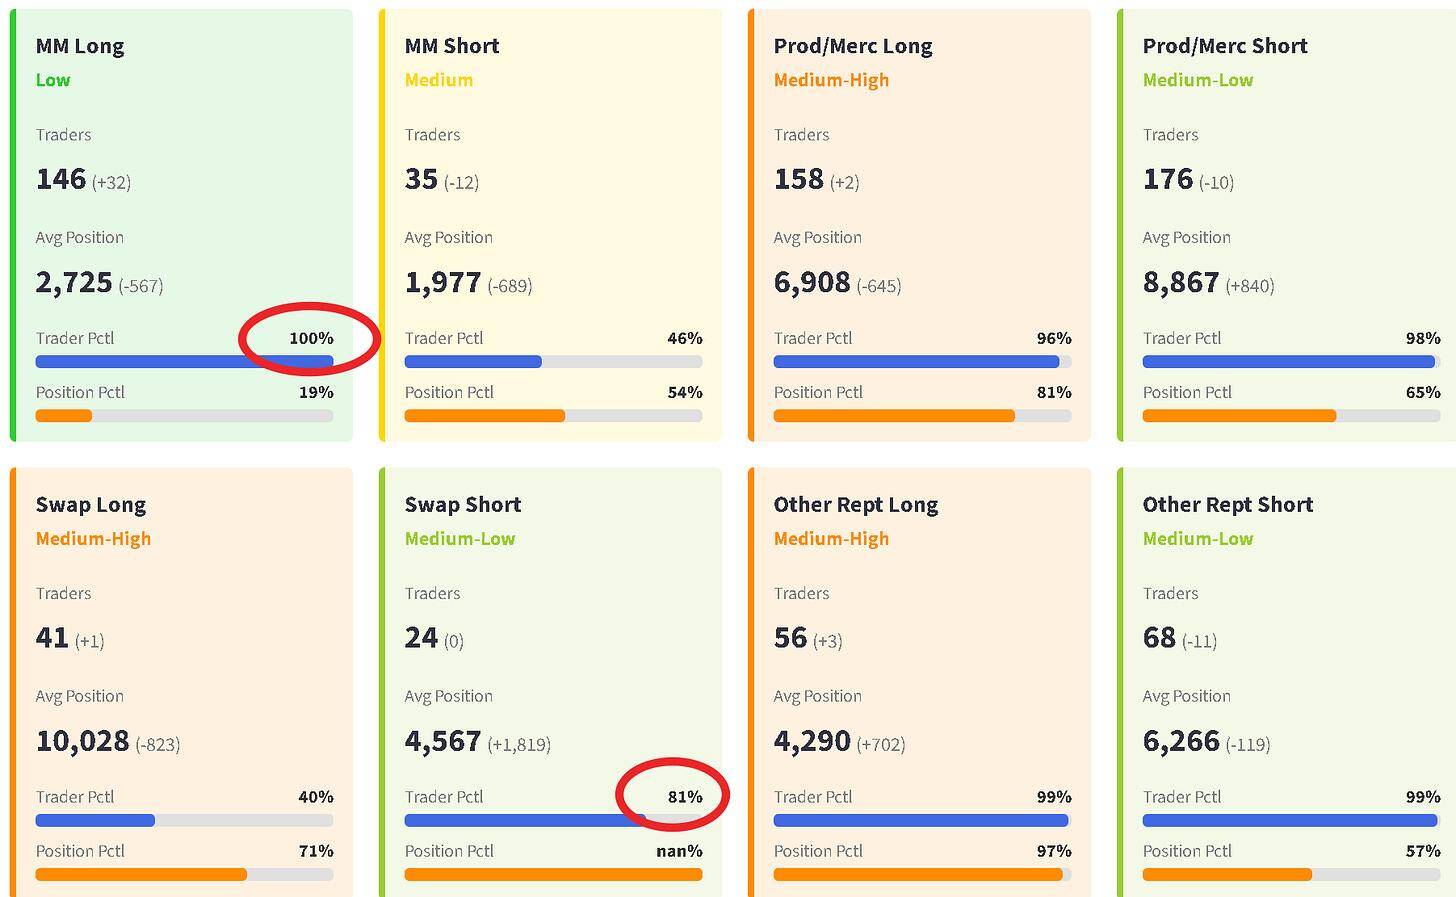
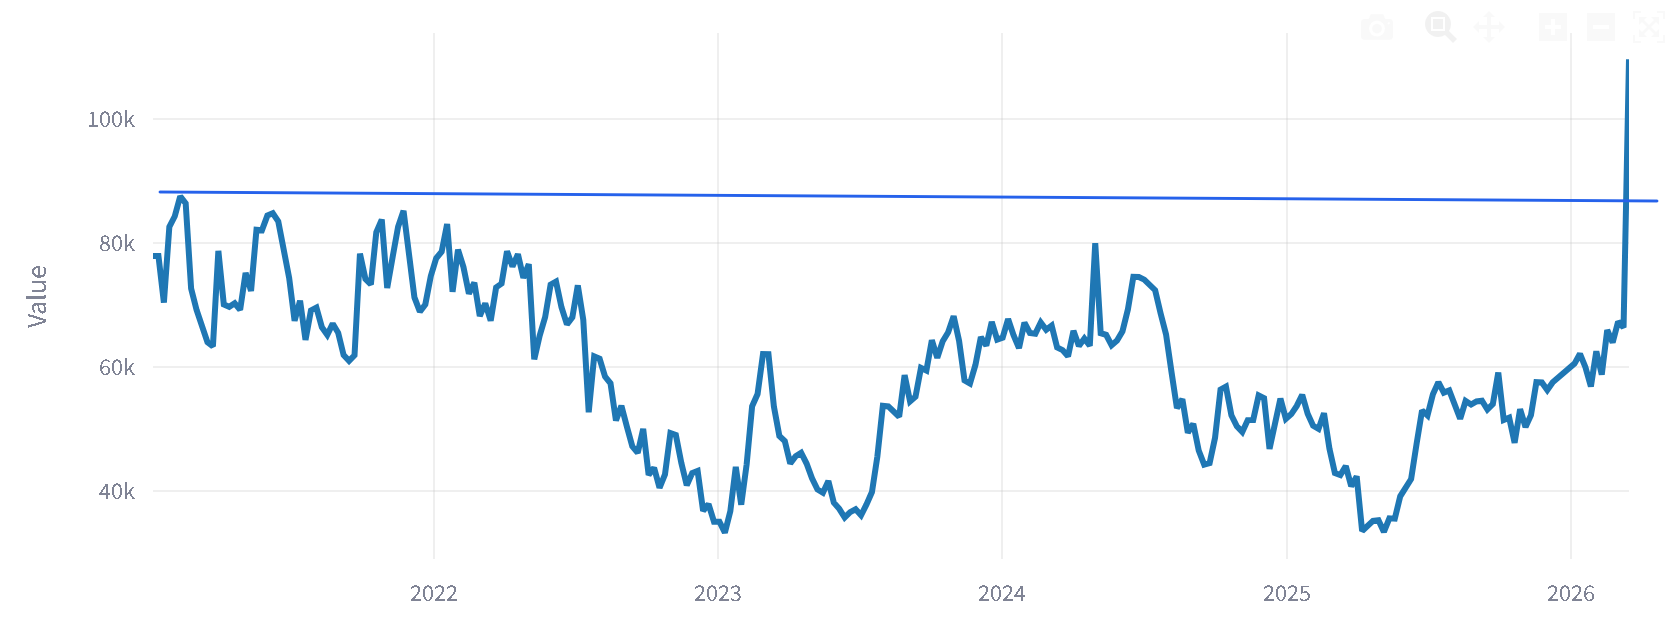
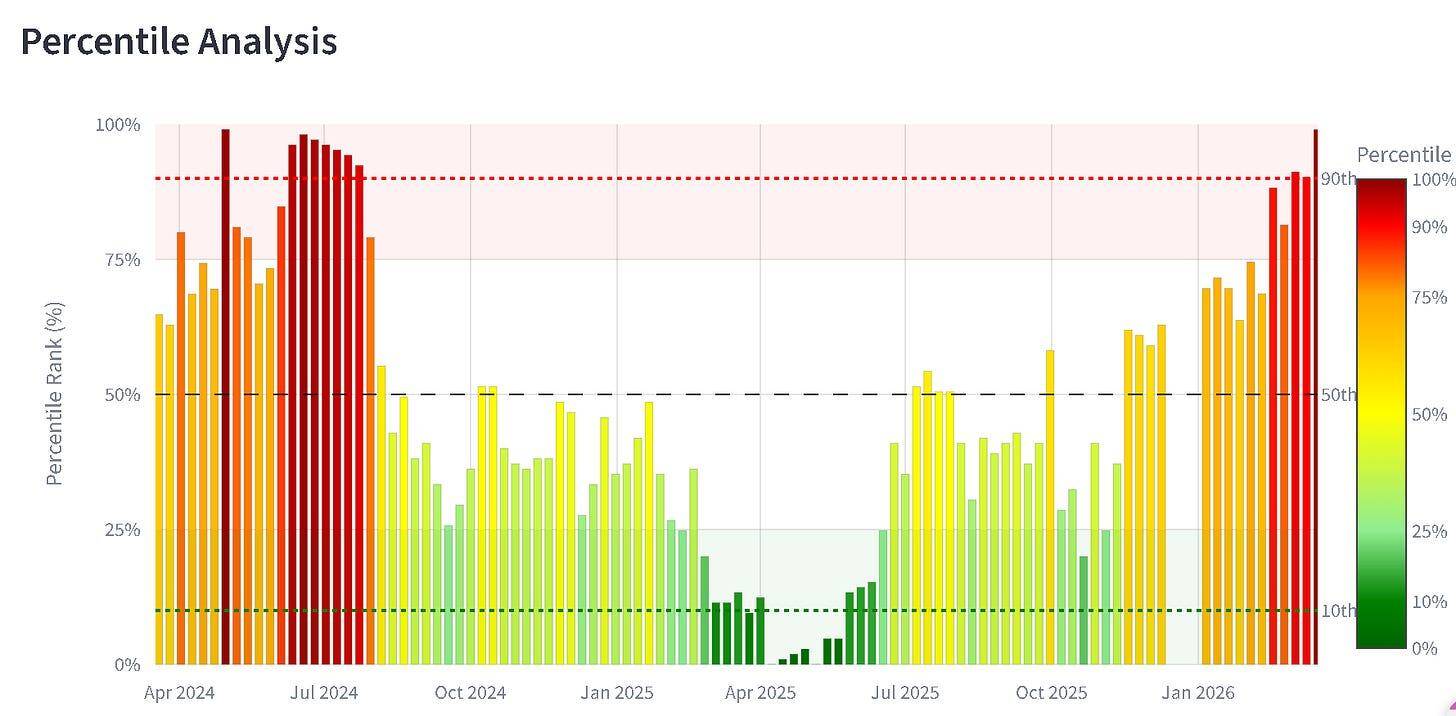
The headline here this week, however, is SWAP Shorts. Reminder-Swaps take the other side of the very largest participants in the oil market. So if they increase shorts, it indicates their clients are more long. Have a look below. WE ARE AT ALL TIME HIGHS IN THIS COHORT! HIGHEST EVER!
This is now rapidly providing the landscape for me to look for short plays. I would like to see one more upside catalyst that fails to attract more hot buying. But this is now VERY MUCH in play!
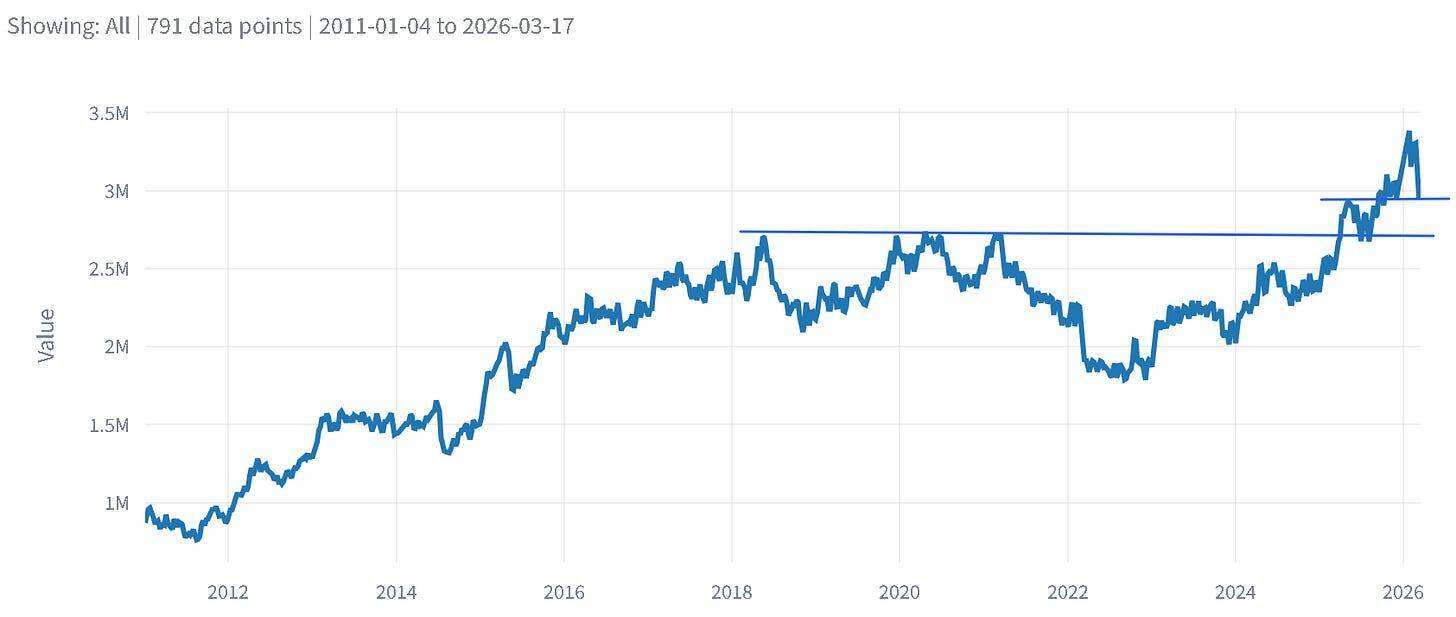
- BRENT Open interest Total 3,068,646. Change +116,944. +3.96%
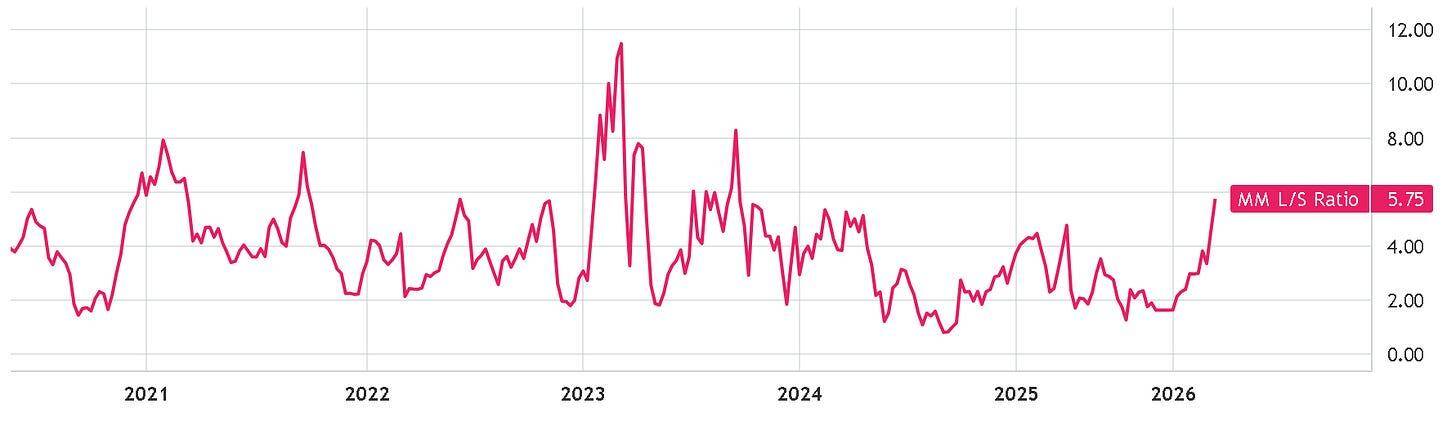
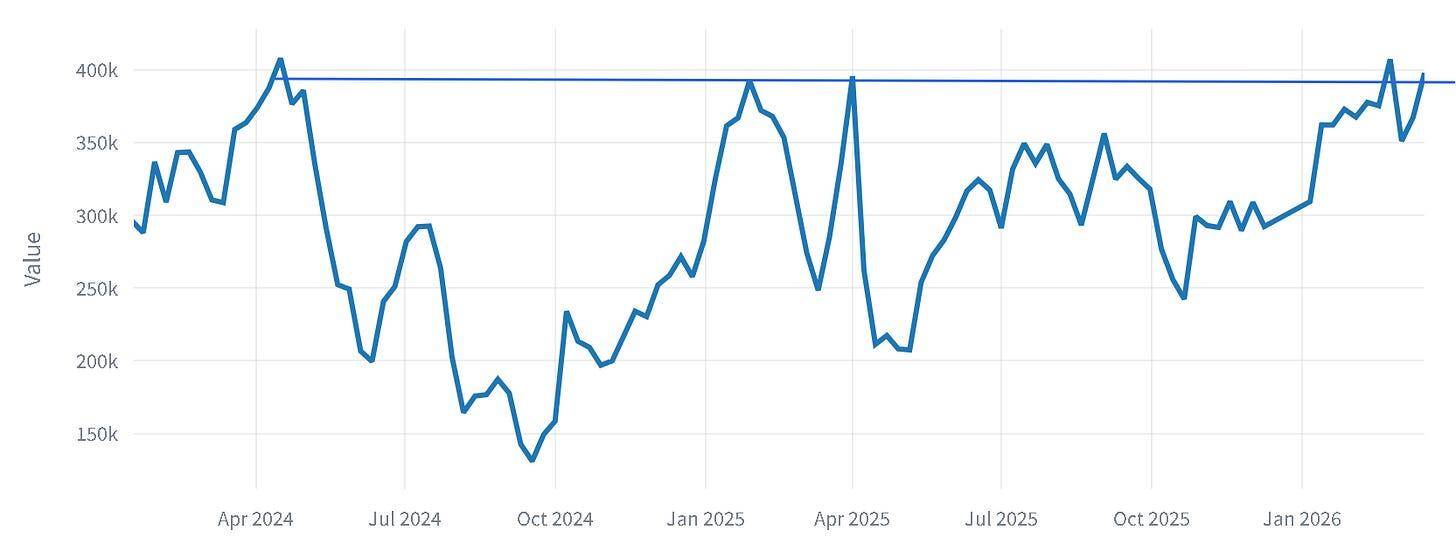
- BRENT Money Managers Long Total 397,911 Change +30,582. +8.33%
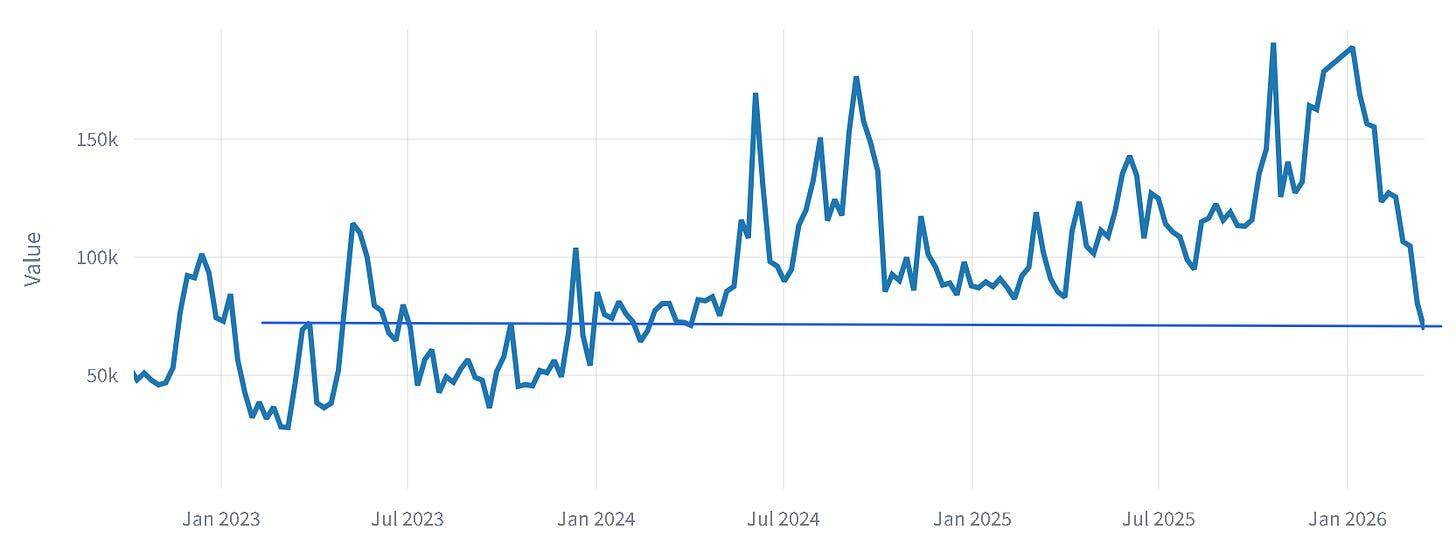
- BRENT Money Managers Short Total 69,207 Change-11,154. -13.88%
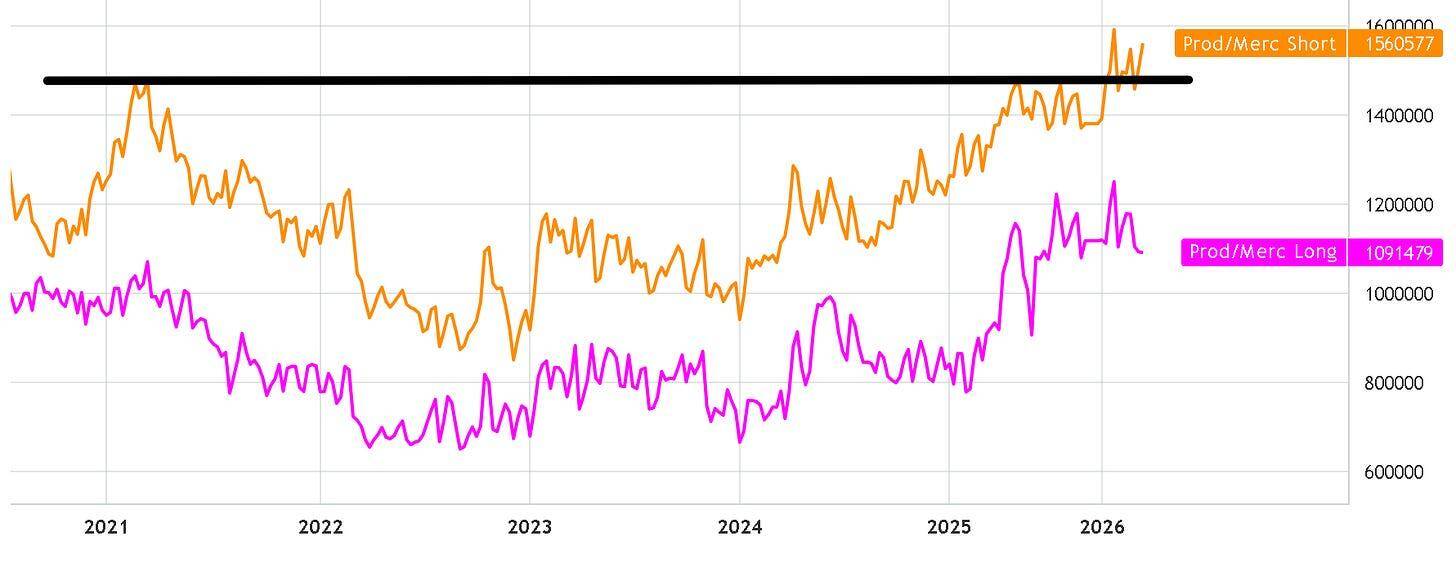
- BRENT Producer/Merchant Long Total 1,091,479 Change -814. -0.07%
- BRENT Producer/Merchant Short Total 1,560,577 +56,577. +3.76%
- BRENT Swap dealers Long Total 411,163. Change+2,207. +0.54%
- BRENT Swap dealers Short Total 109,617 Change +43,226. +65.11%
Market Regime
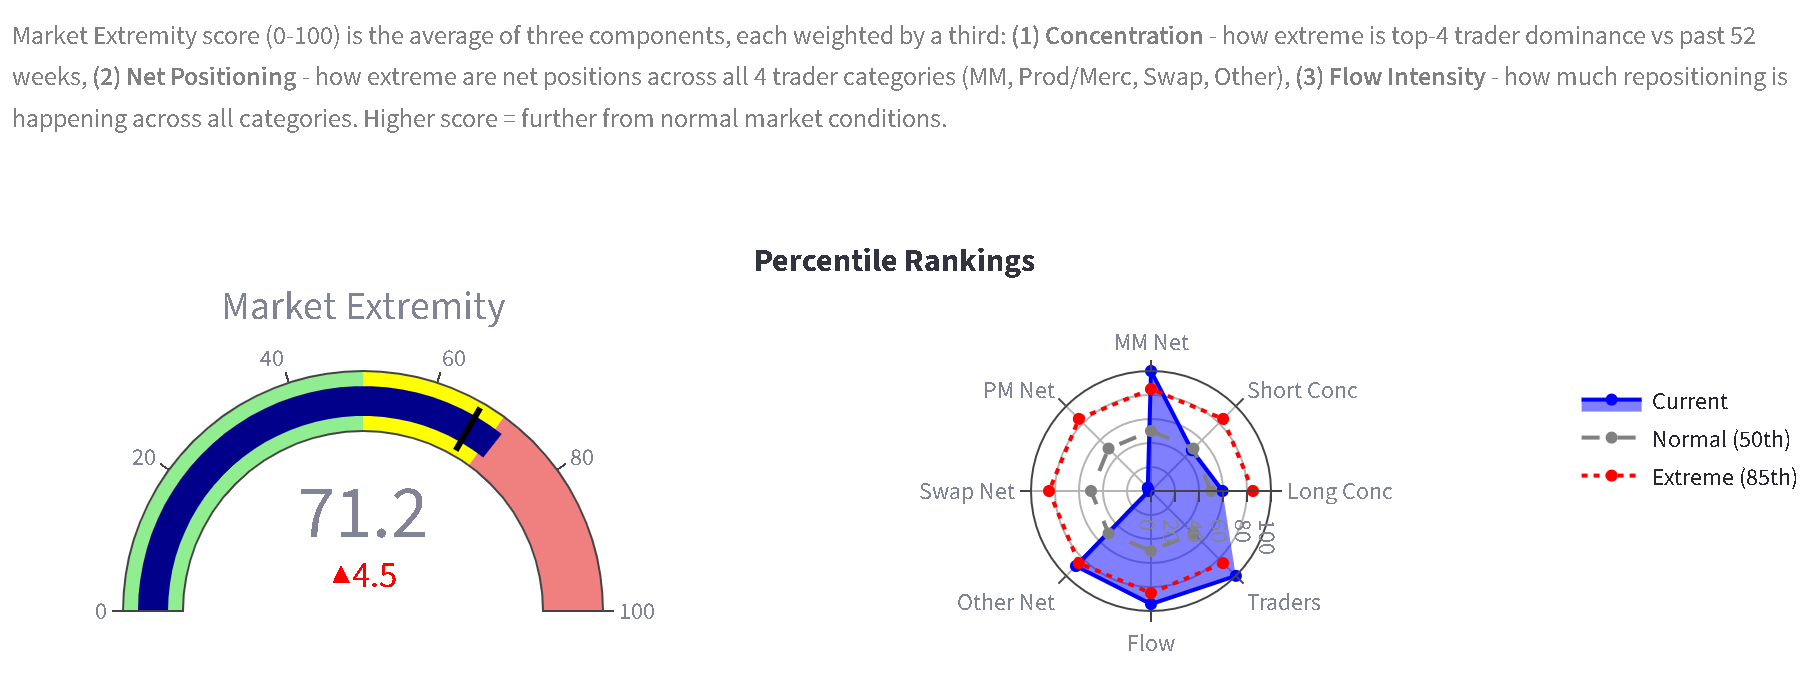
Market Concentration
Money Managers
Producer/Merchant
What’s The Next Move?
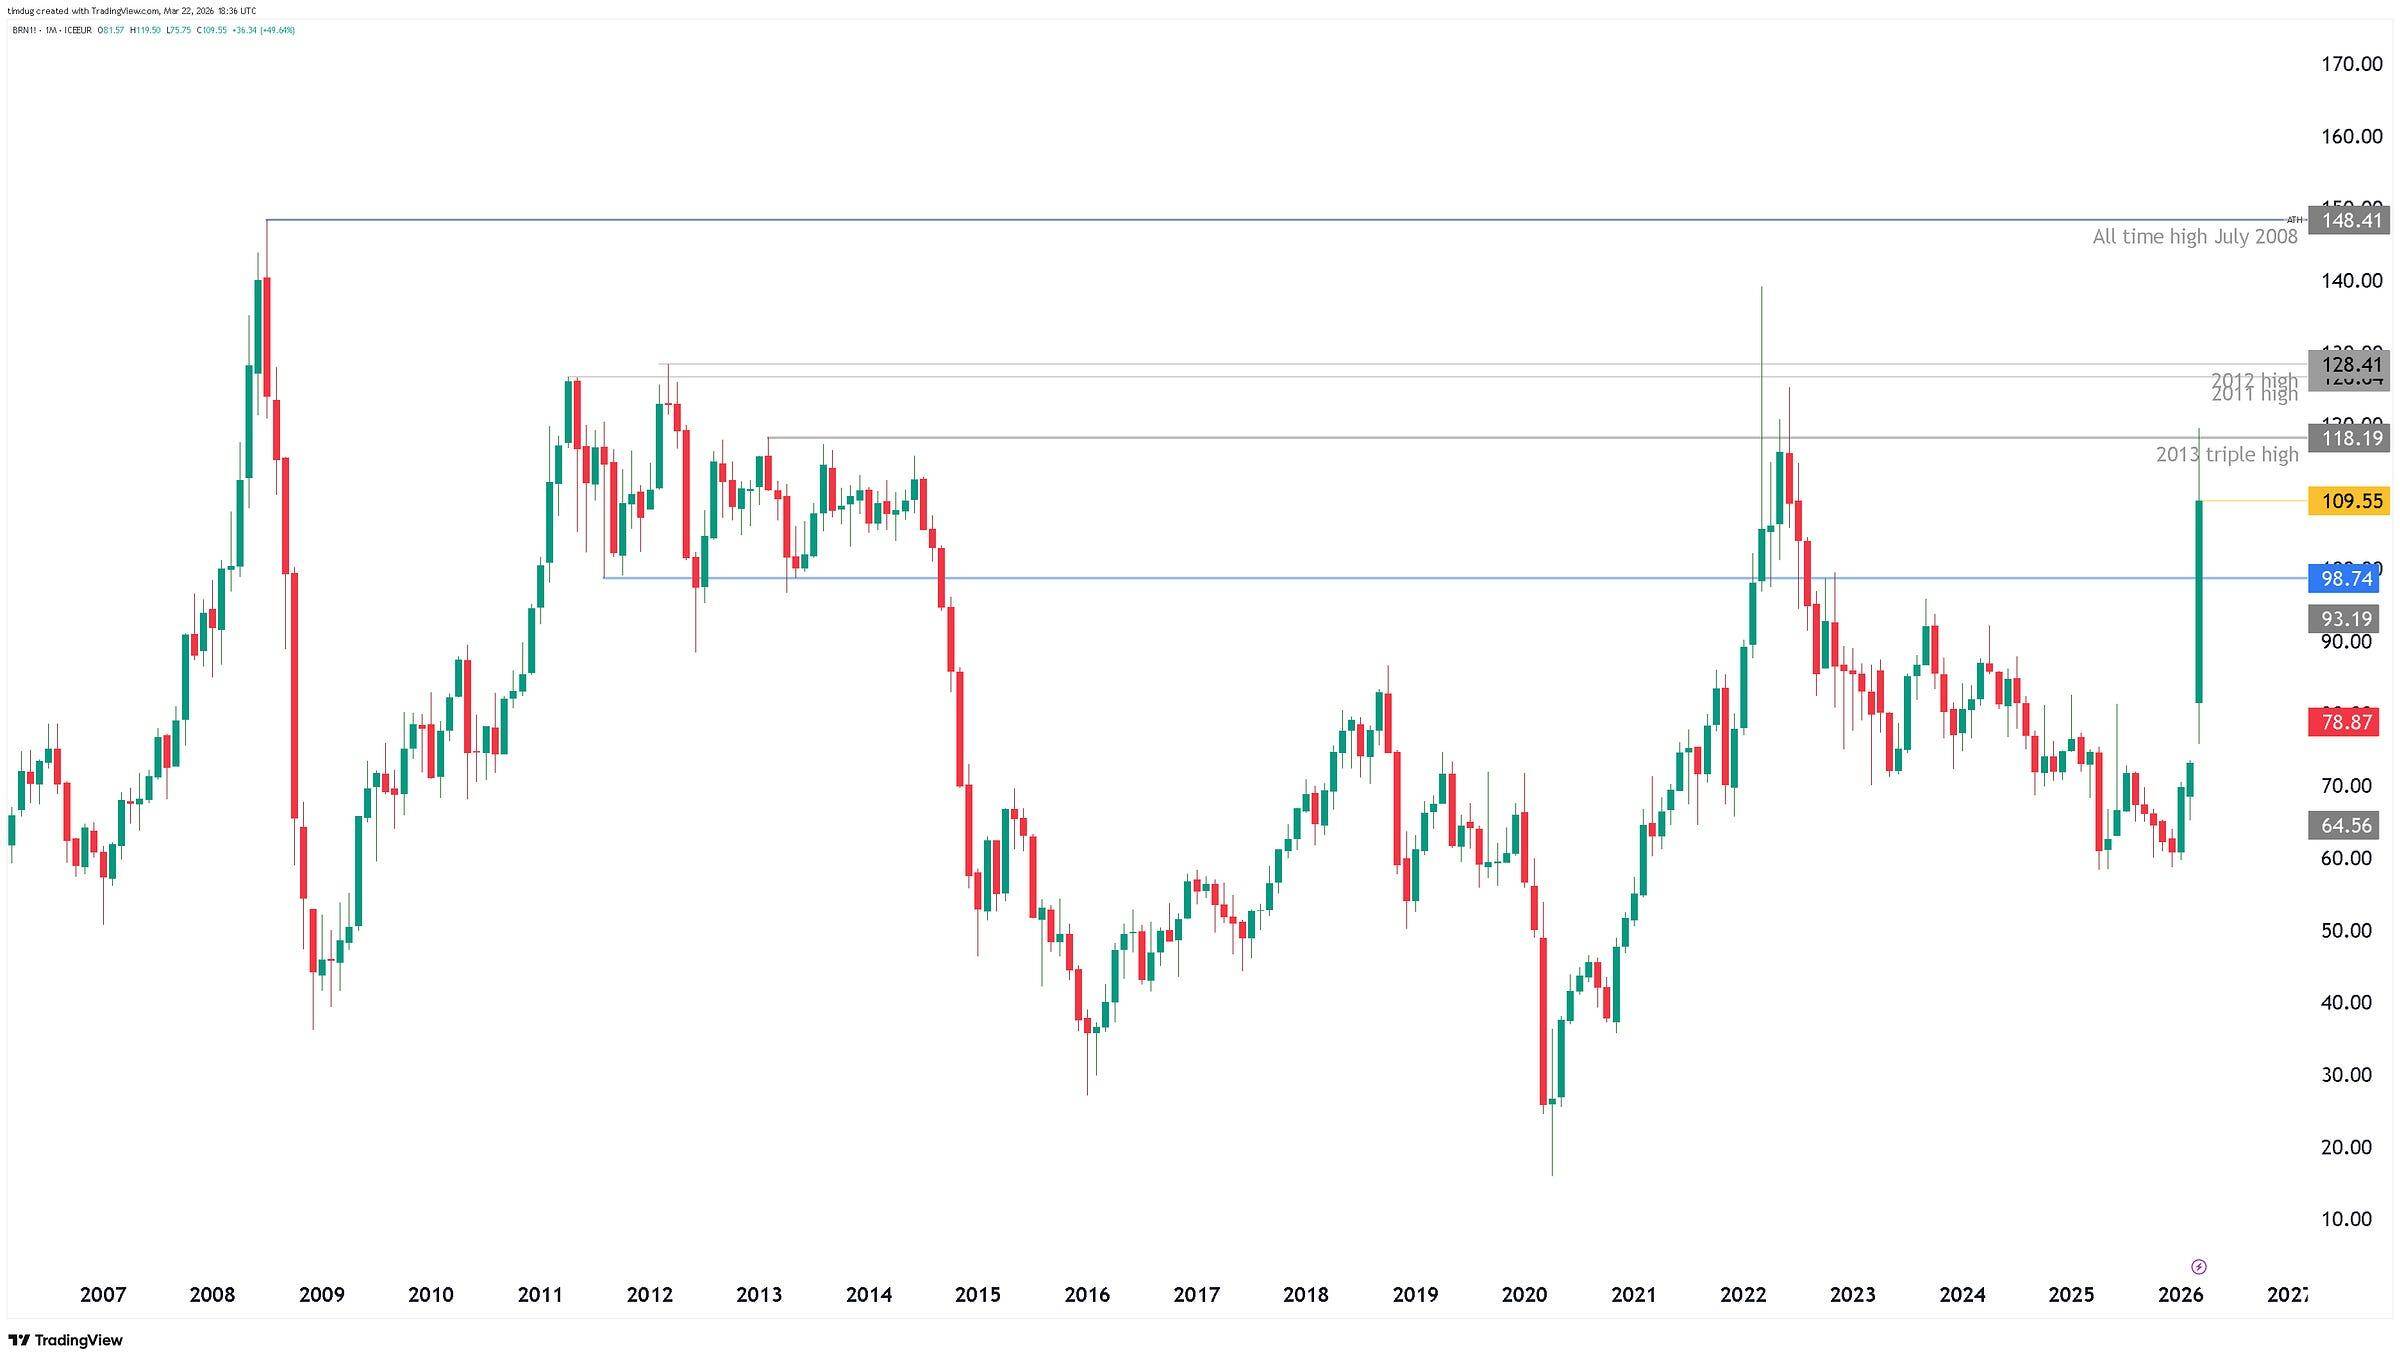
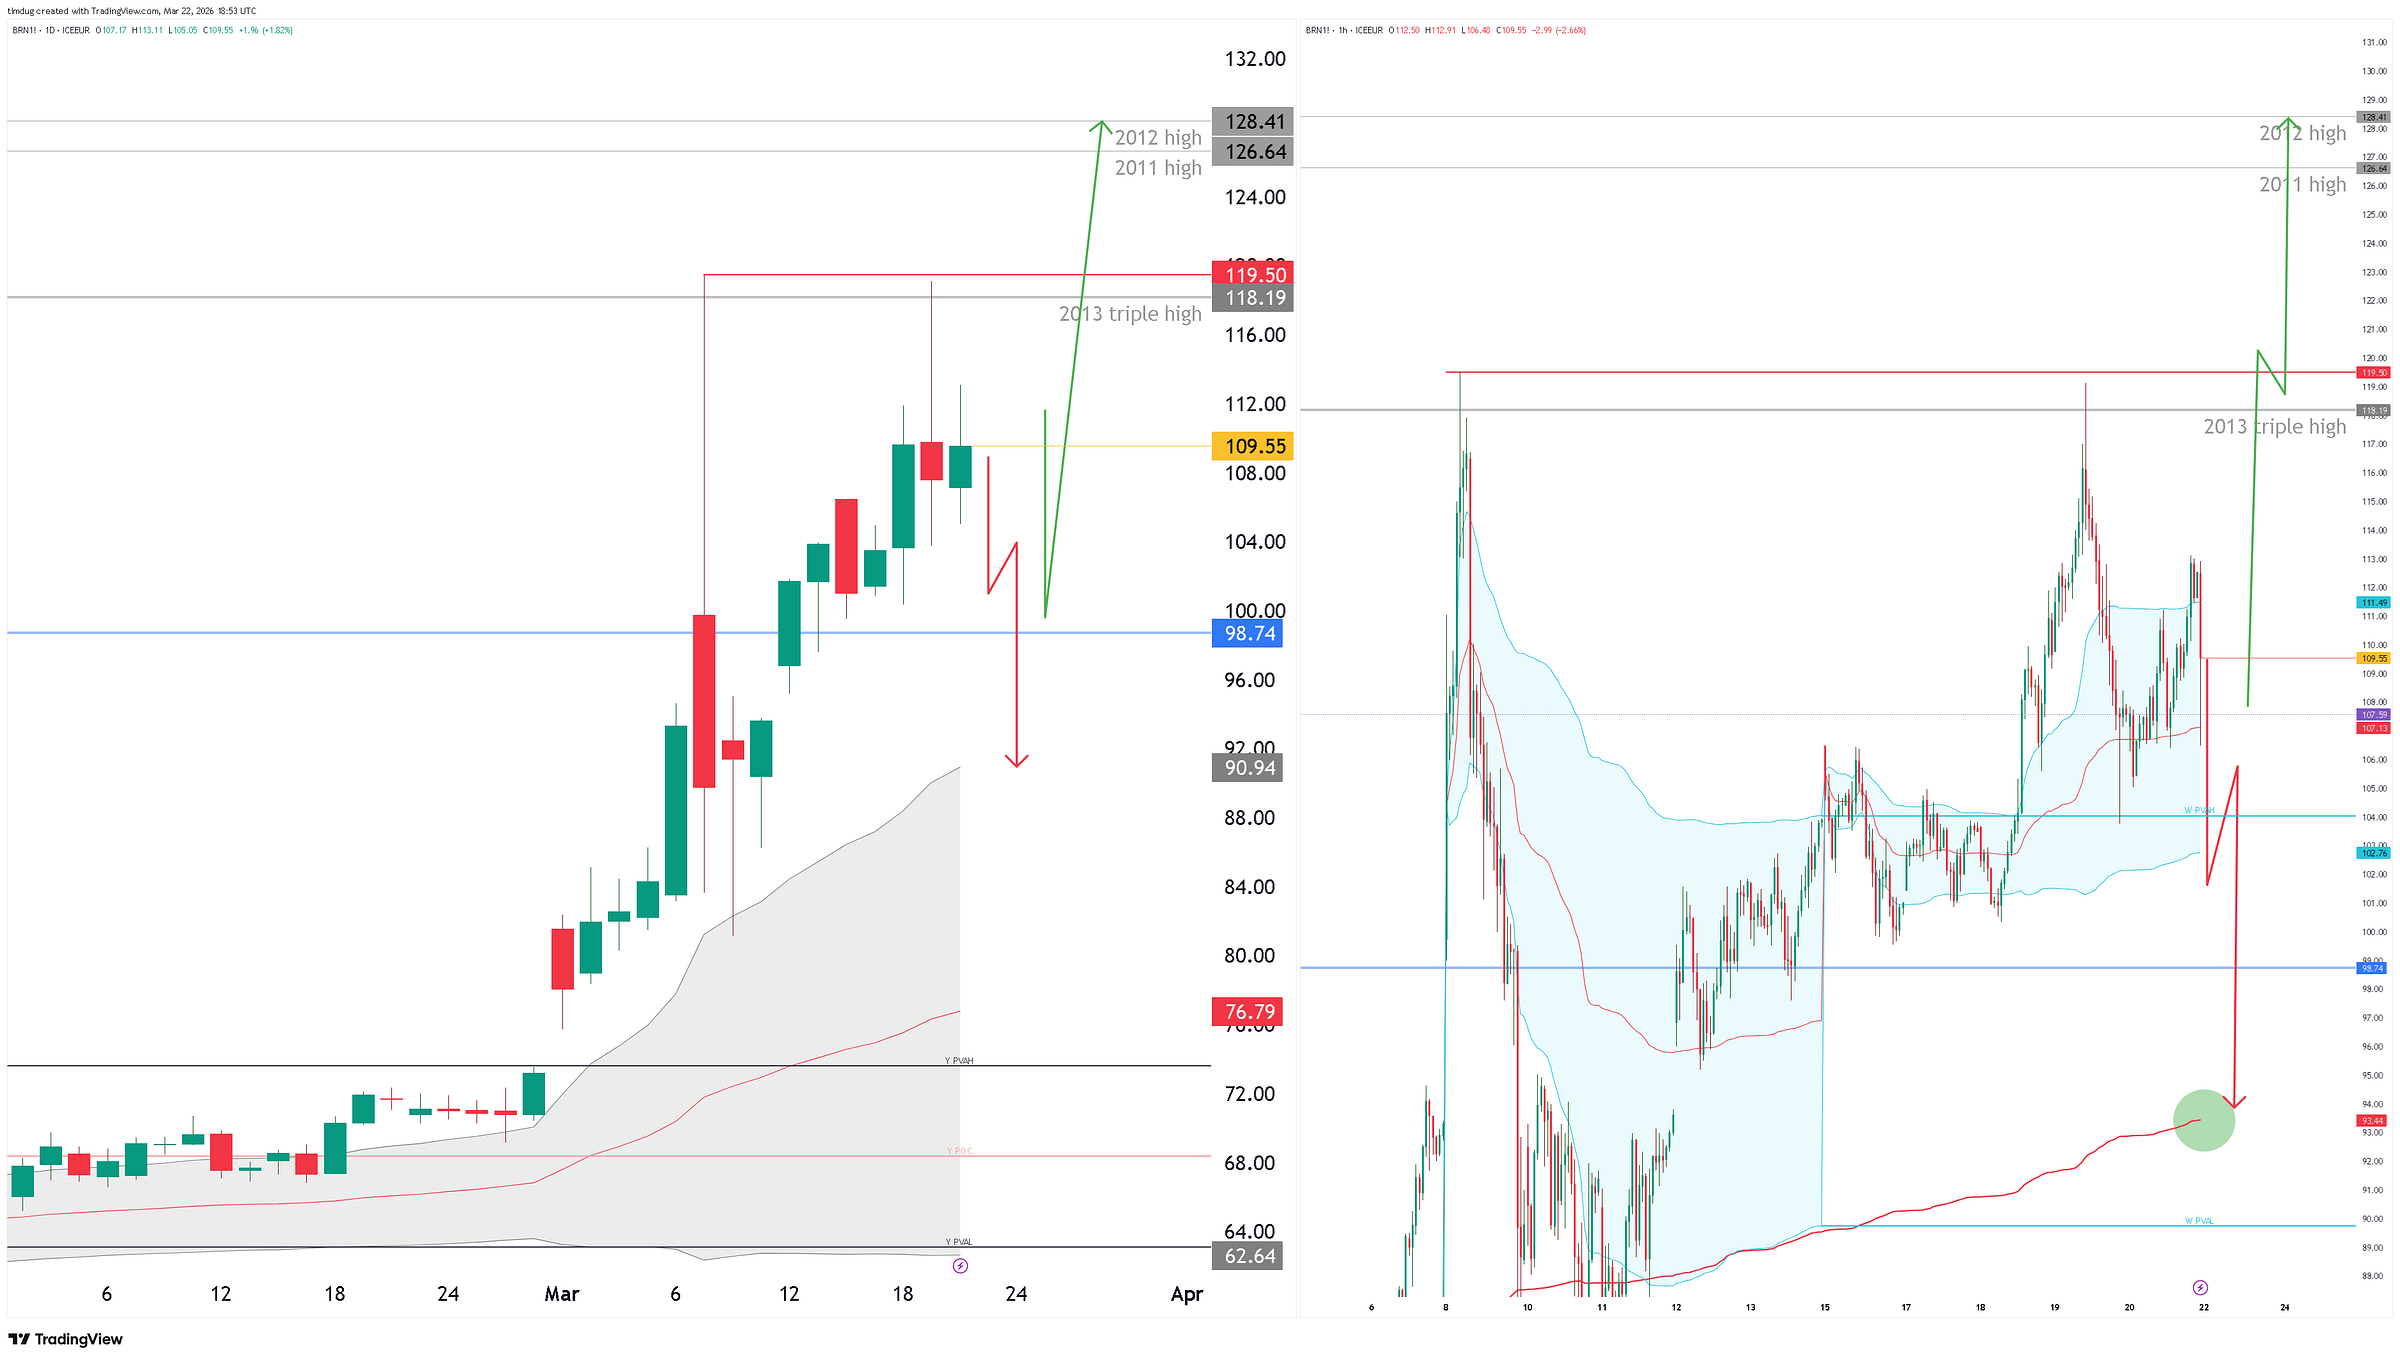
Okay, so as a primer here, this is crazy price action that can be turned on a dime. We are operating 95% now on oil in the intraday 5% on call spreads. No running positions in front month oil. Swing positions in Ags ETFs and NG exposed companies.
So long story short, this is an order flow scalpers delight for front month oil trading. Unfortunately, this involves us using a fully different set of tools- order flow, volume profile and price action on the ladder/dom. Other use footprint. It’s not my bag so much.
But below are some of the key levels to look out for and the general directional move we will monitor for. Long above, short below type stuff.
In conclusion:
This is not a typical geopolitical premium—it is a structural supply shock constrained by infrastructure, not capacity, and the market is still pricing for resolution rather than persistence. If the disruption endures, crude will need to reprice materially higher, but with positioning already extended, that move is likely to be uneven, sharp, and driven by episodic squeezes rather than a steady trend.