


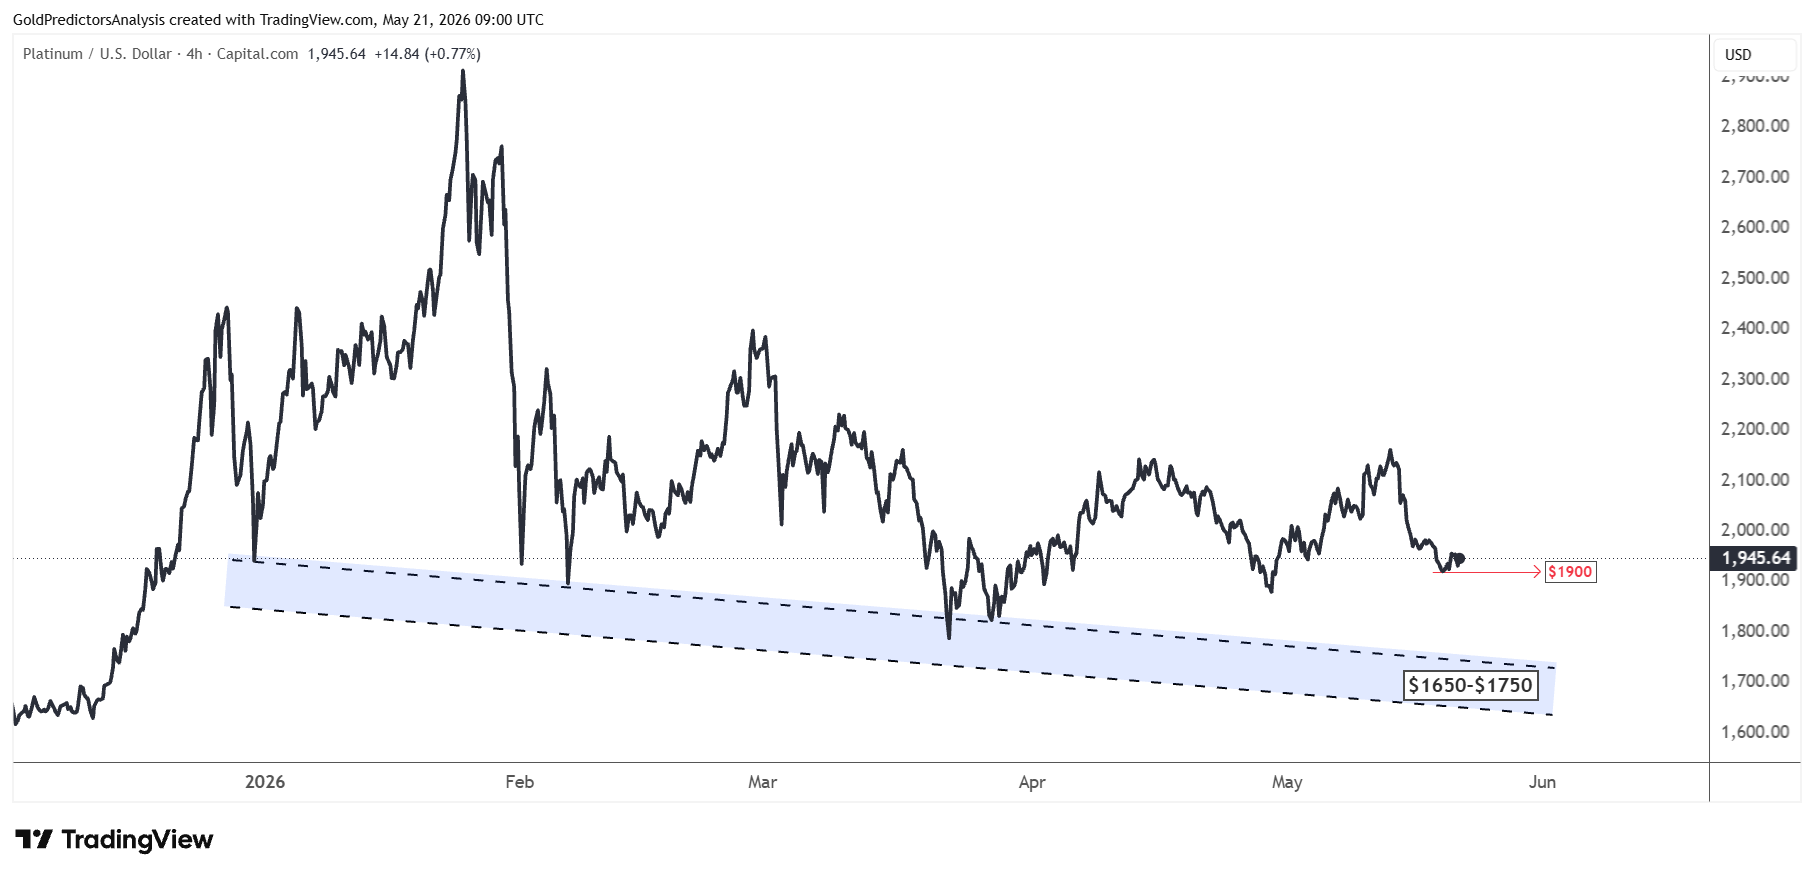
Platinum (XPL) prices dropped from the $2,160 resistance in May and are now approaching the first key support near $1,900. In my view, this correction produces a consolidation pattern between $1,700 and $1,900 before the next significant move. This article presents the fundamental drivers, technical setup, related market signals and key levels to find the next move in the platinum market.
Fundamental Drivers
The macro picture for platinum remains mixed. The market continues to be tight on paper, but not all market signals are supportive. Platinum is set to experience more deficit for the coming year. WPIC estimates that 297,000 ounces will be short for this year. That would make it the fourth consecutive year of deficit. This leaves the longer-term supply picture supportive for platinum.
The inventory picture is also bullish and makes the bull case stronger. The above ground stocks are forecast to drop to 1.747 million ounces this year. That would take the stock to use ratio down to 22%. The available stocks would be less than 3 months’ worth of demand. This is important because if inventories are low, the market could be sensitive to any disruption in supply or surge in demand. It also demonstrates that there is no substantial buffer in the market.
The short term outlook is not that attractive. WPIC data revealed that platinum stocks stood at 268,000 ounces in the first quarter of 2026. This was the first quarterly surplus in six quarters. It was also a dramatic reversal from the 658,000 ounce deficit reported a year ago at this time. This means that tightness is easing for now. It also provides an understanding of how supply shortages might prove insufficient to drive platinum prices higher.
The main issue is the demand. Demand for platinum will drop 9% this year to 7.674 million ounces, according to WPIC. Investment demand is a major contributor, and this is projected to decline by more than double from last year. The investment side of the market is being dampened by ETF outflows and declining exchange-traded registered stocks. This will minimize the risk of a significant self-driven rally in platinum.
Technical Drivers
Long Term Platinum Price Structure
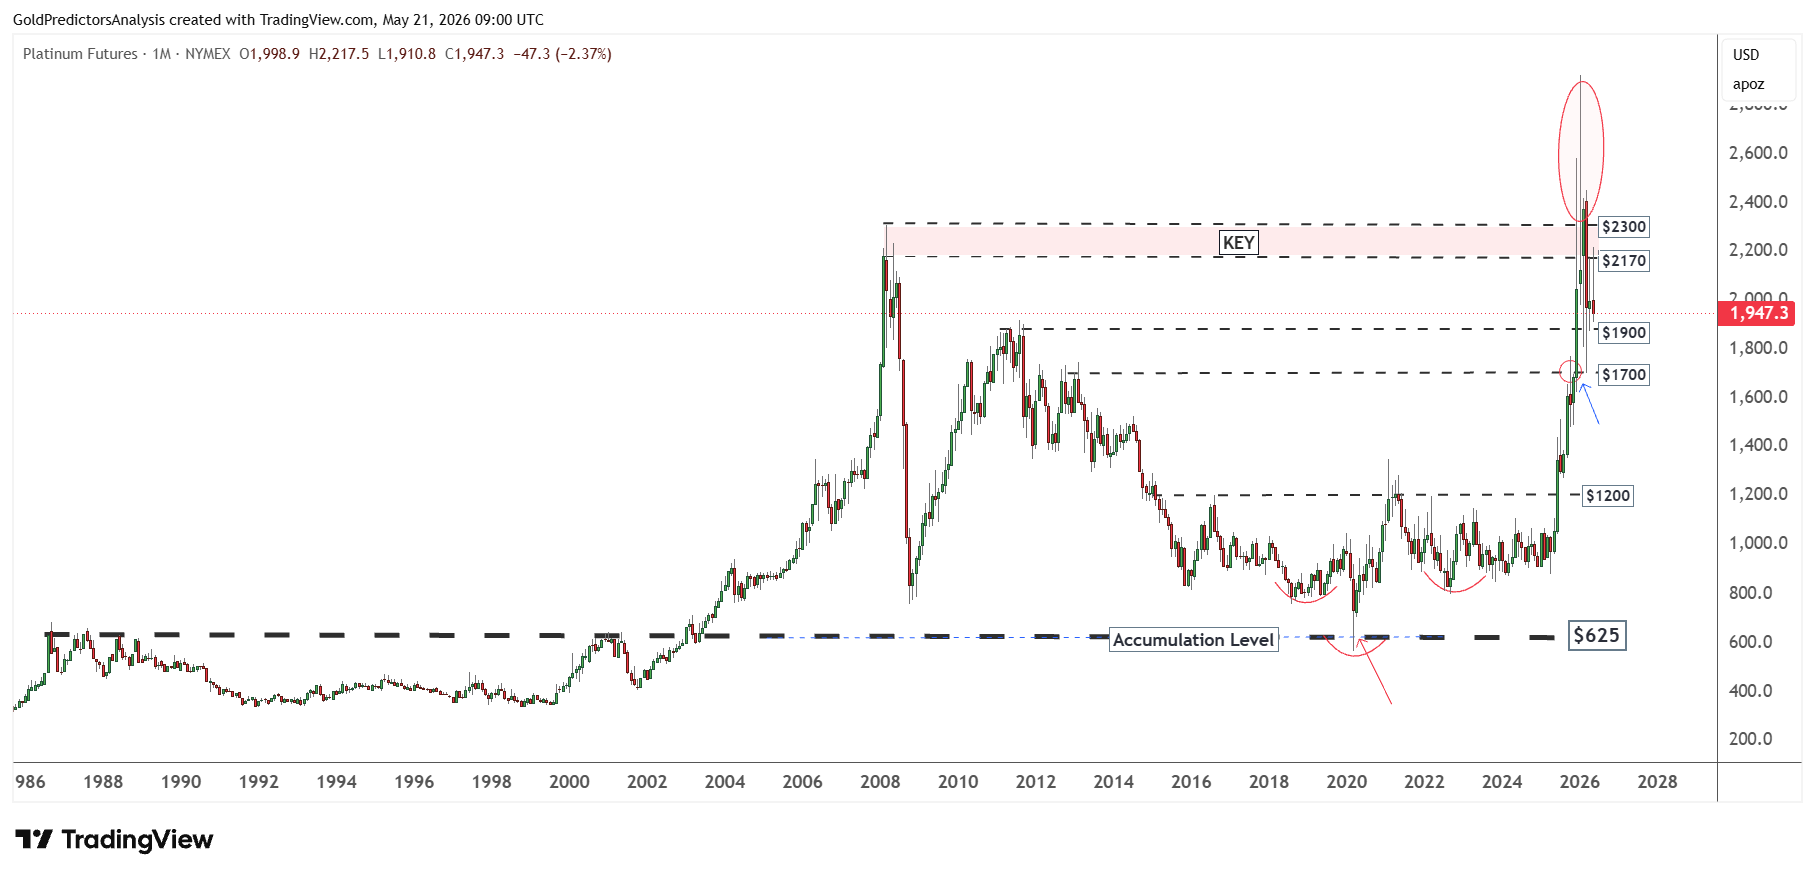
From technical perspective, the platinum price remains in correction mode after marking record highs in January 2026 at $2,925. My $2,300 target for 2026 was exceeded and reached earlier than expected. But the price remains below this target and is consolidating to find the next bottom.
The formation of an inverted head and shoulders pattern in 2020, with the head at $562 in March 2020 and the shoulders at $755 and $822, suggests a base. The neckline of this inverted head and shoulders pattern at $1,200 was broken in June 2025. This breakout initiated strong surge that reached a record high in January 2026.
The chart highlights $2,170 and $2,300 as the key resistance area where platinum prices are trying to push lower toward the support zone of $1,700. As discussed previously, the $1,700 to $1,900 area remains the key support zone. If the bottom forms around this level, prices will likely continue higher.
Short Term Platinum Price Structure
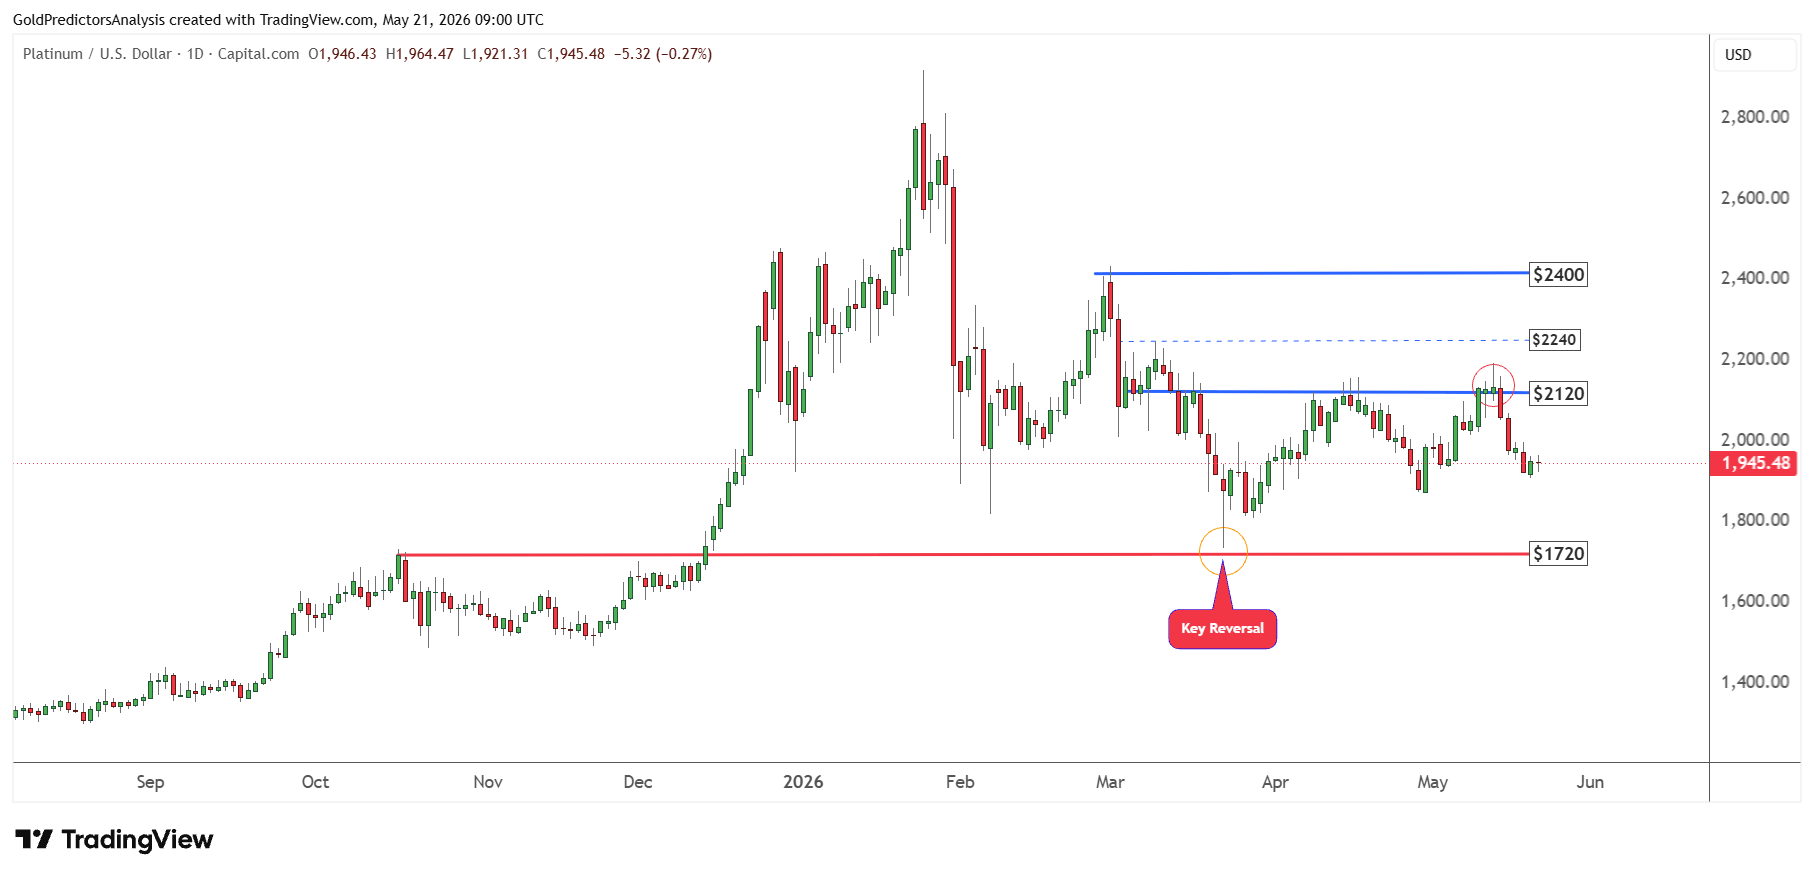
The short-term price structure for platinum remains in consolidation with a positive bias. Prices failed to break above $2,200 on 13 May 2026 and triggered a drop.
It is found that $1,720 remains the key support zone in the platinum market. As long as this support holds, the next move might develop higher. But platinum prices must break above $2,400 to initiate the next major move.
The key reversal candle on 23 March 2026 indicates that the platinum prices remain well above the support zone and are consolidating to stabilize the market. Once these consolidations are over, platinum prices are likely to rally again.
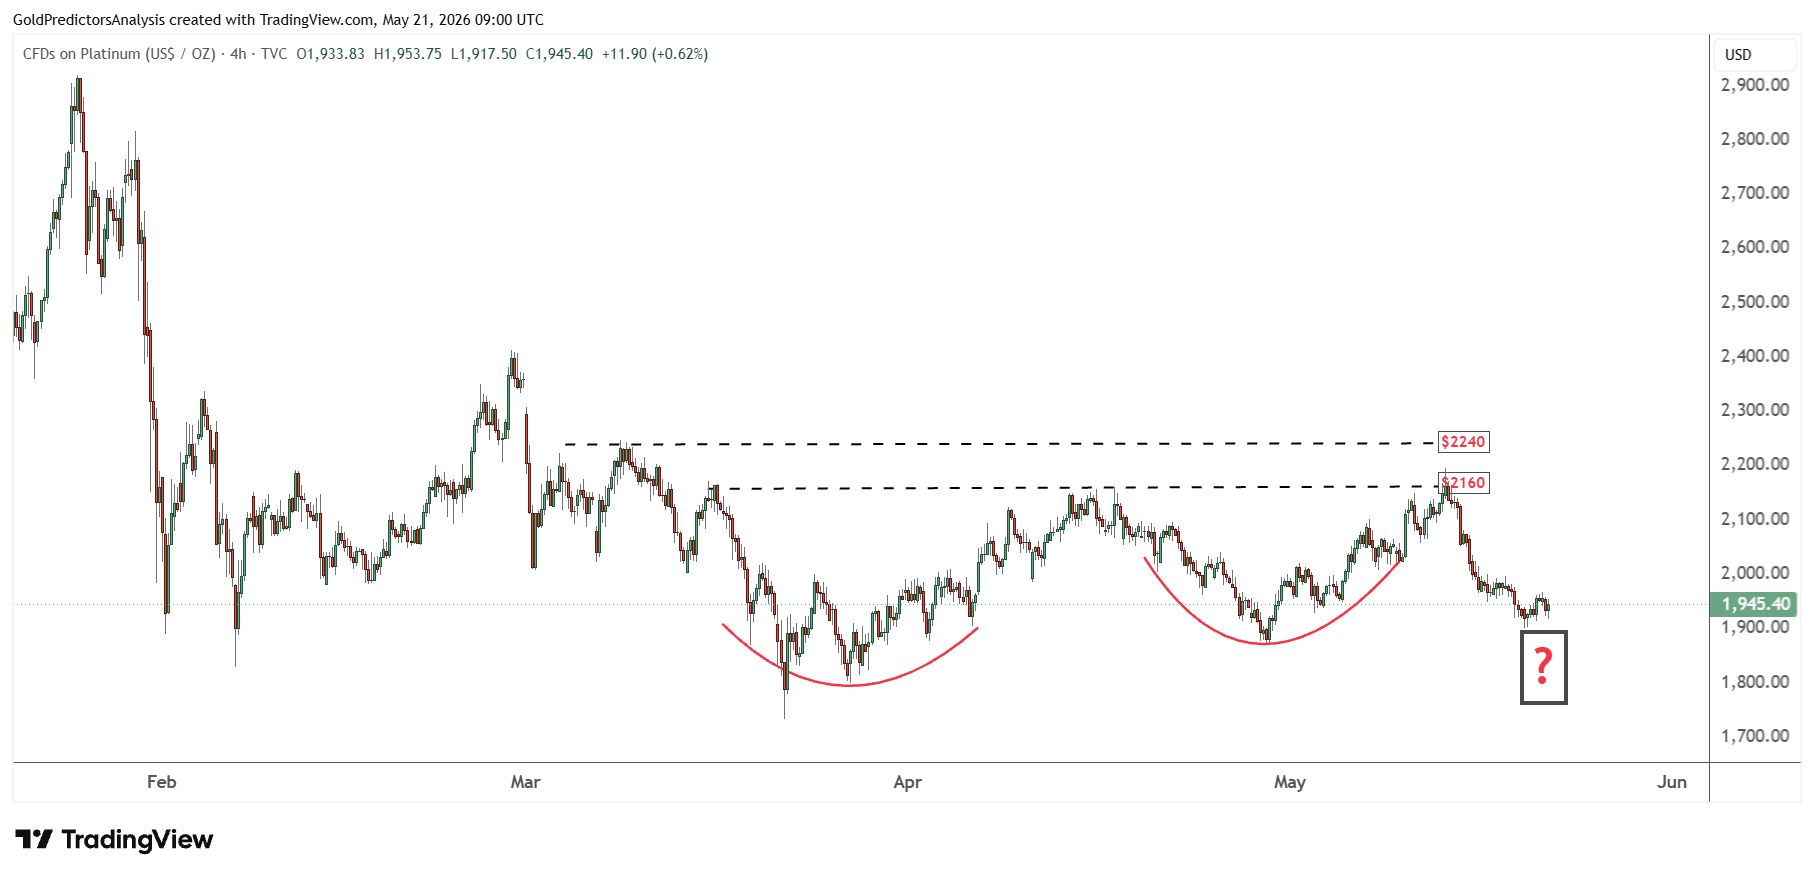
These consolidations have formed a bottom above $1,700, as seen in the daily chart below. But now, the failure at the $2,160 and $2,240 region indicates that the next move in platinum prices will likely depend on a breakout below $1,700 or a recovery above $2,160.
If platinum prices remain above $1,900 and break $2,160, they will probably move higher. This is because it will construct strong bullish price action by forming a triple bottom pattern above $1,700.
But a failure to hold $1,700 will likely result in a deeper correction in the platinum market.
The Next Buying Opportunity
Based on the above discussion, it is found that the drop from the $2,160 level in May 2026 has taken the prices to first support of $1,900. There are two support zones highlighted in the platinum market: the first is $1,900 and the second is $1,700.
If the $1,900 level is broken, then prices will likely accelerate toward the $1,650 to $1,750 support zone and offer a strong buy signal around this level. But a break below $1,650 will likely initiate a deeper correction toward the $1,200 to $1,300 area.
On the other hand, a break above $2,240 and $2,400 will likely confirm that the bottom is in and initiate a stronger move higher.
Related Markets Confirm Platinum’s Corrective Pressure
Platinum-to-Gold Ratio Still Struggles Below 0.50
Platinum prices are also under pressure due to the strong correction in the gold (XAU) and silver (XAG) markets following the record highs. The chart below shows that the platinum to gold ratio has remained in a descending channel since 2008.
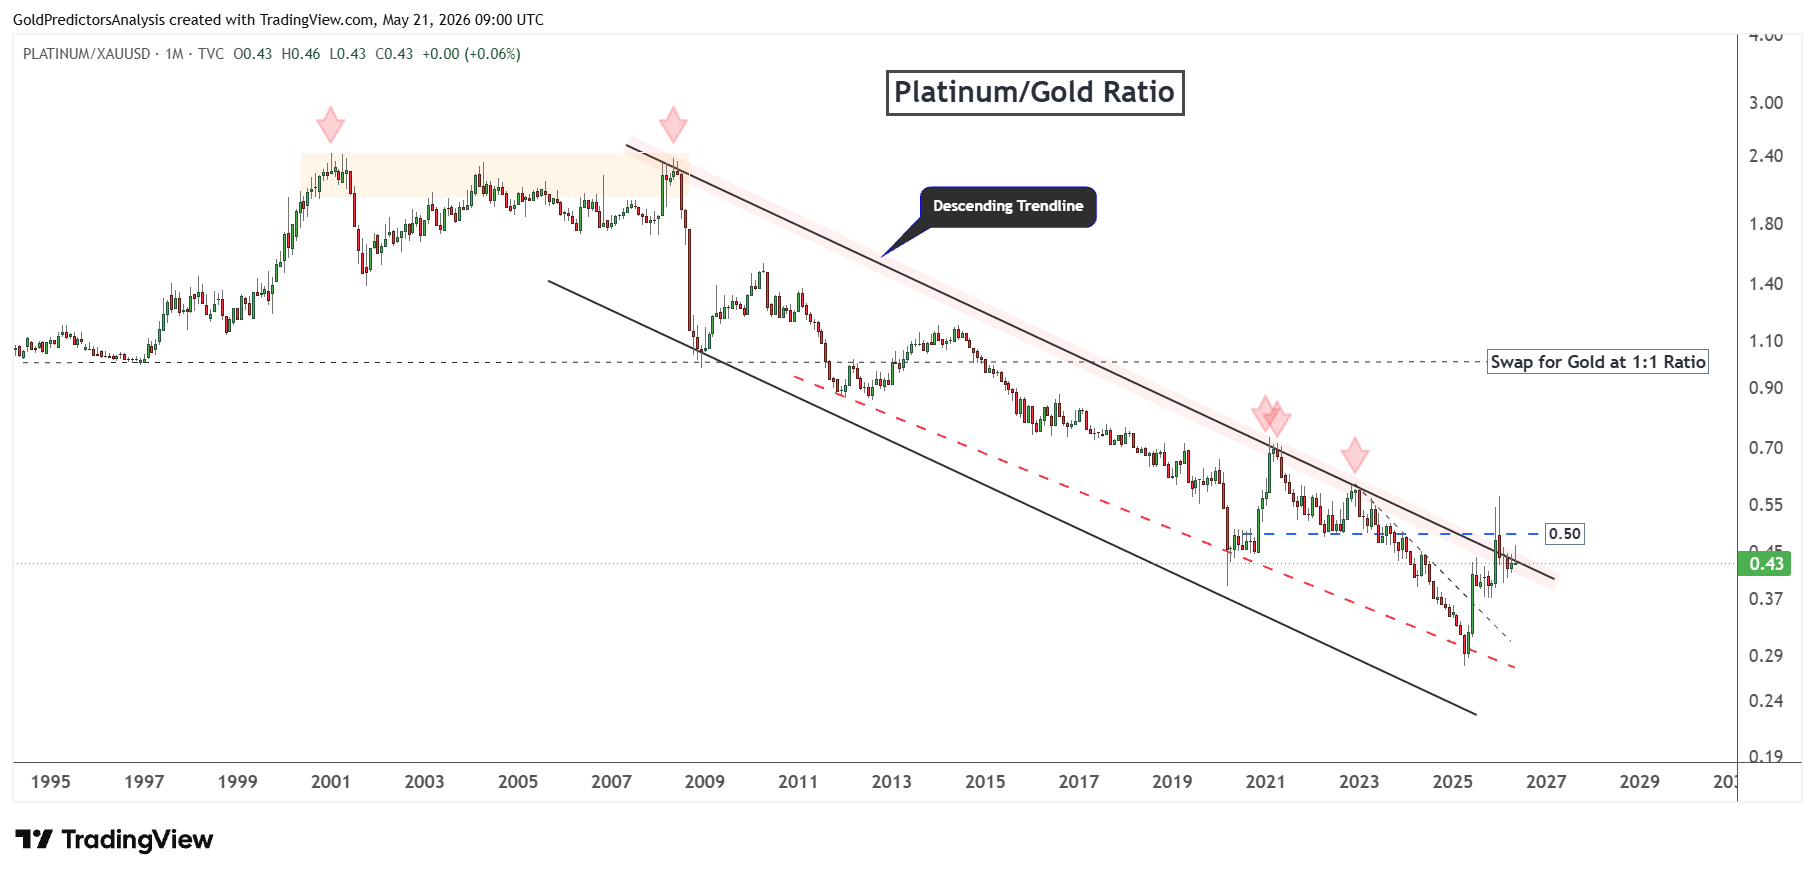
But the ratio attempted to break higher in January 2026 when platinum prices surged above $2,300. This surge in platinum prices took the ratio above 0.50 but it failed to break this channel.
As long as the ratio remains below 0.50, gold prices will likely outperform platinum. A strong recovery above 0.50 in the ratio will suggest a stronger move toward 0.70 and 1.00. This breakout will likely spark stronger move in the platinum market and highlight platinum’s relative strength compared to gold.
Gold-to-Platinum Ratio Shows Gold Leadership
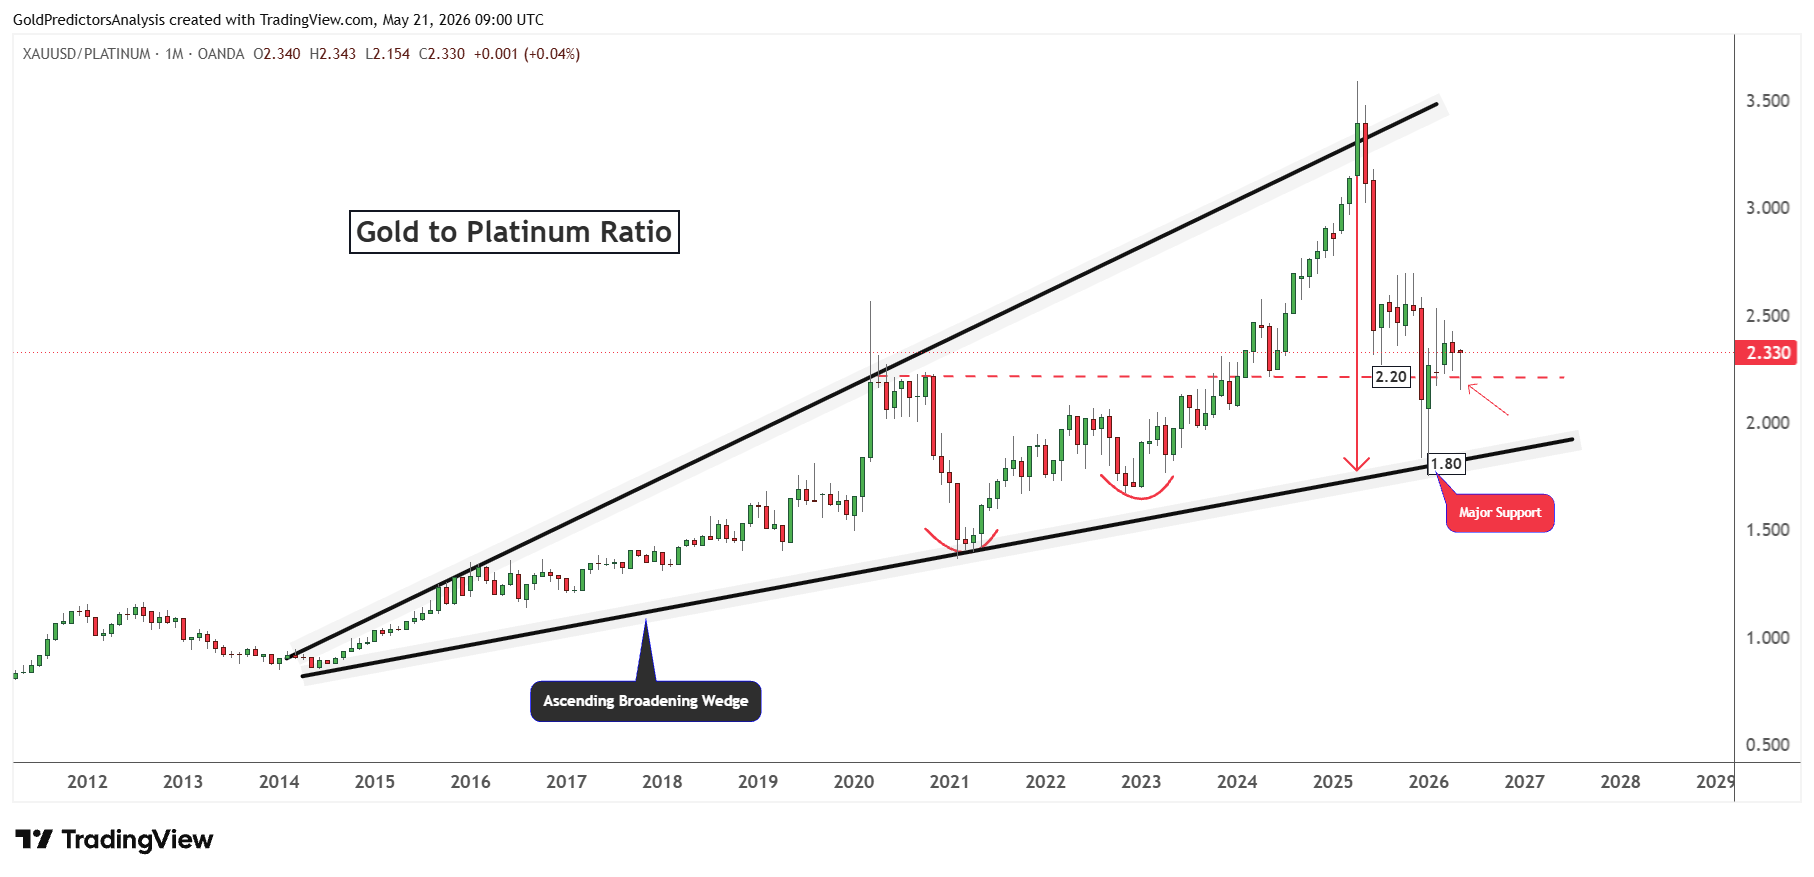
The same phenomenon is also observed in the gold to platinum ratio, which has found strong support at 1.80. This support indicates that the gold prices are preparing for the next rally.
Now, the ratio remains above the 2.20 level which indicates that the ratio will likely continue higher. This strength will likely keep the gold prices higher during the next cycle.
Strong Dollar Keeps Pressure on Platinum
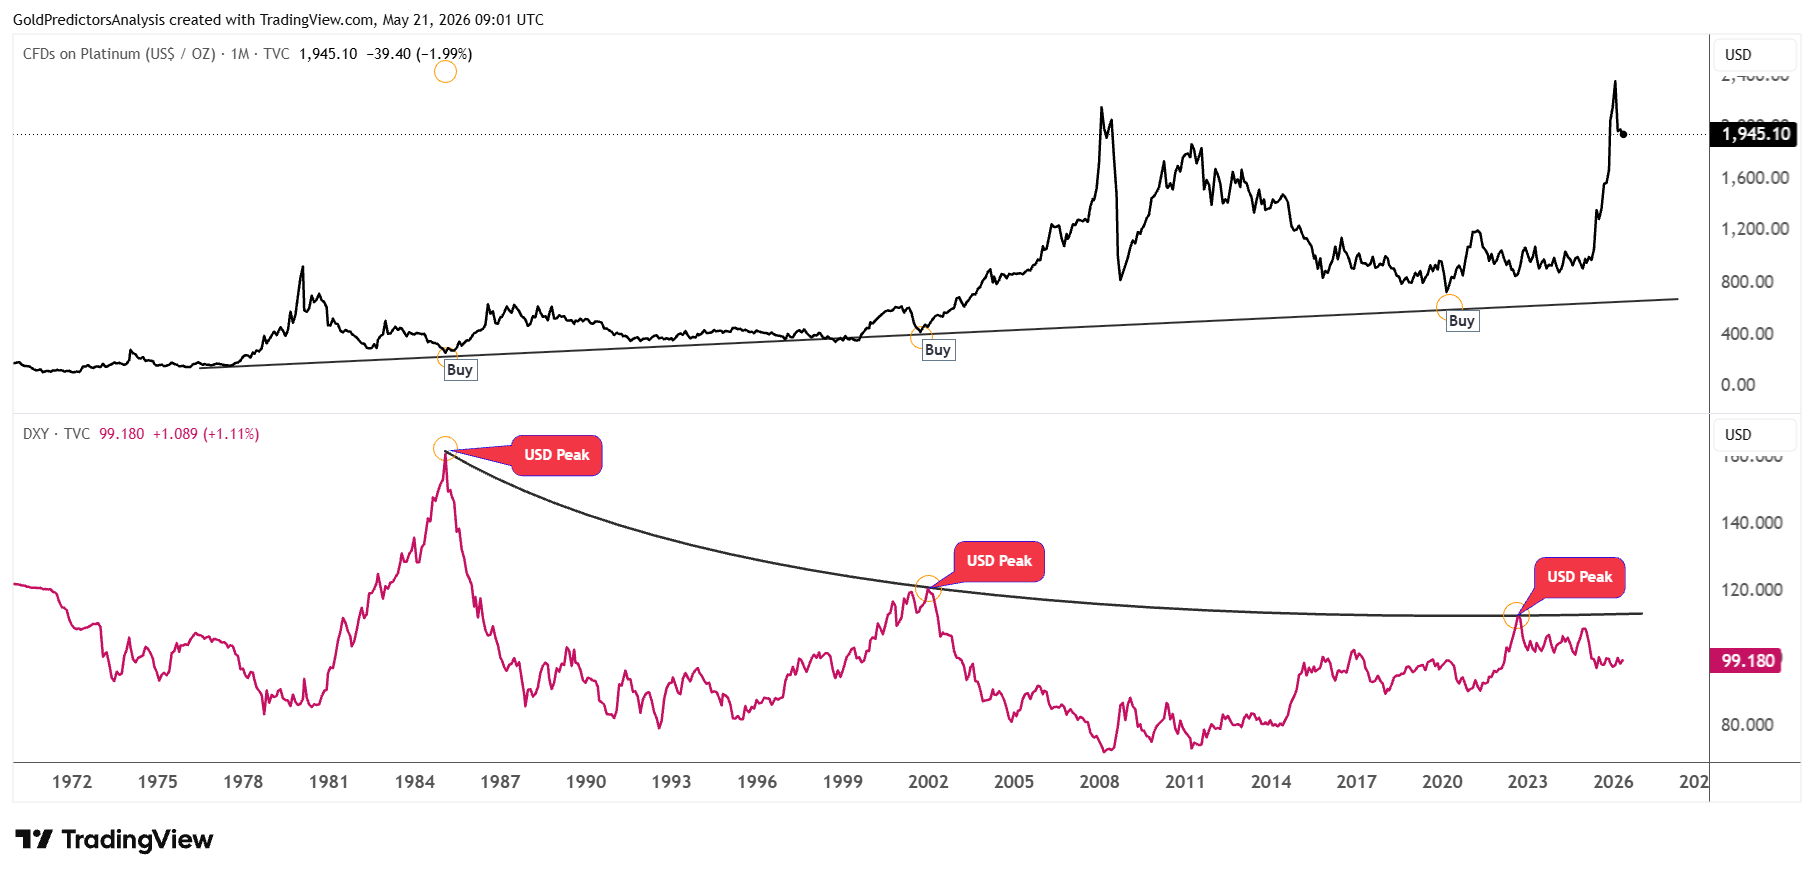
Another strong reason for the platinum correction in May 2026 is the strength in the U.S. dollar. The U.S. dollar index shows strength due to high oil prices, which are pushing inflation expectations higher. Higher inflation expectations have raised interest rate expectations, which have pushed the U.S. Dollar Index above the 99 level.
This strength is keeping platinum prices lower below $2,100. The chart below shows that the U.S. Dollar Index and platinum prices are inversely correlated. Therefore, the resumption of the next rally in the platinum market also depends on the resolution of US-Iran tensions, which is driving the oil prices higher.
Risk Factors
The biggest risk for platinum is a break below the $1,700 support level. This level has provided solid foundation for the market throughout this period of corrections. Prices would need to fail this area for the correction to extend to the $1,200-$1,300 area. This would take the edge off the bull trend and further delay the next big rally. Also, a stronger U.S. Dollar Index continues to be a risk, as higher oil prices and inflation expectations keep interest rates higher. That pressure can help to keep platinum prices below $2,200.
Another significant risk is the demand weakness. Platinum demand is forecast to decline 9% this year and will be weighed down by investment demand as ETF outflows and fewer exchange registered stocks dampen demand. This means that platinum could struggle to rally despite the supply shortage. A drop in the platinum to gold ratio also indicates that gold is performing better in precious metals market.
Final Thoughts
Platinum is in a corrective phase but the big picture is still a constructive one with prices above the $1,700 support level. There is still a shortage in the market and the above-ground stocks are also low. The long-term bull view is supported. But lack of demand, ETF outflows and a stronger U.S. dollar are limiting growth in the short term. If the recovery price action breaks out above $2,240 and $2,400, it will signal that the correction phase is over and indicate further upside.
The base case is that platinum will continue to consolidate until it makes a good bottom in the $1,700-$1,900 range. If the support zone remains intact, then there is a possibility that prices will make another attempt to reach the previous highs. However, if the price breaks below $1,650, this would diminish the bullish outlook and raise the odds for a further pullback to $1,200-$1,300. Investors may consider buying platinum on a pullback to the $1650-$1750 zone.
If you’d like to know more about what drives gold and silver prices, please visit our educational area.