


Platinum (XPL) prices remain under bearish pressure as high oil prices have increased the risk of inflation ahead of the Fed decision this week. The surge in oil prices last week has kept the possibility of rate hike in December and the strong US dollar adds pressure to platinum prices. The break below $1,530 has increased the risk of a continued drop towards the support zones. The rebound in the US dollar from the key support area further strengthens the bearish view on platinum. I think that the guidance by the Fed about the December decision and the reaction in the US dollar after the meeting will likely determine the next move in platinum.
High Oil Prices and Risk of Fed Hike Weigh on Platinum
Platinum prices remained under pressure on Tuesday after failure to break above the $1,700 area on Wednesday last week. The price dropped by 0.93% on Monday and continues to show bearish pressure before the Fed decision this week.
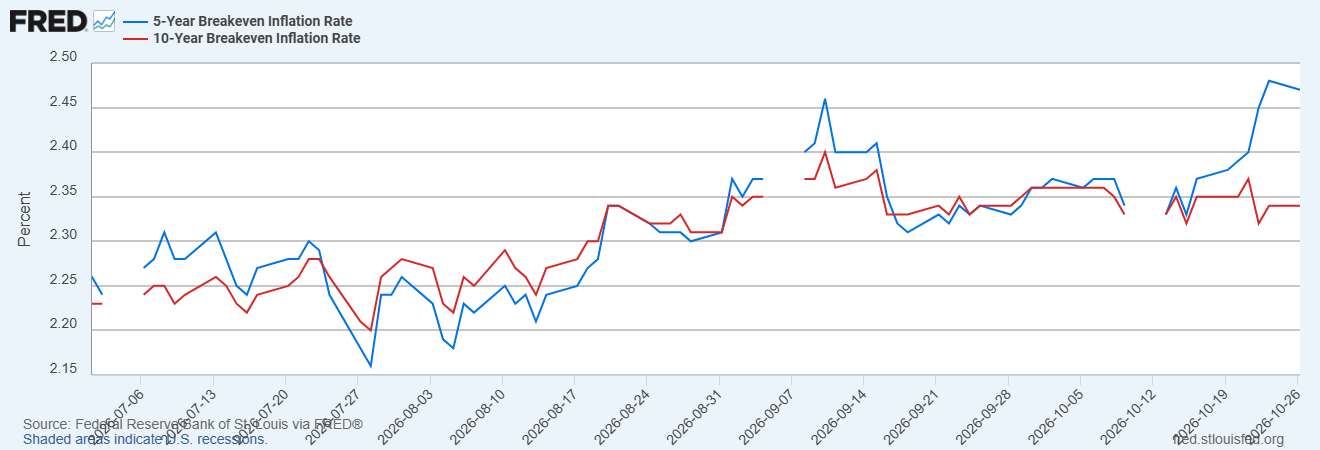
The market expects the Fed to leave rates unchanged in October. However, oil prices have surged in October which further increases the expectations of rate hike in December. The chart below shows that the five-year breakeven inflation rate has surged to 2.47% in October 2026 while the 10-year breakeven inflation also remains high near 2.34%.
The high cost of borrowing can also put pressure on industrial spending. Therefore, the guidance by the Fed for December will likely have a greater influence on the next move for platinum.
Now, oil prices dropped on Tuesday due to talks about peace in the Middle East. These talks may reduce tensions in the Middle East. Brent oil trades near $115 a barrel while WTI oil consolidates around $101. The correction in oil prices gives some relief to platinum prices. But the continued attacks on Saudi Arabia further fuel tensions in the Middle East that may ignite another rally in oil.
The 10-year US Treasury yield currently consolidates around the 5% area. But the US dollar index has rebounded from the key support level of 101.45. The consolidation in 10-year US Treasury yields at the support of 5% increases the possibility of rebound, as the recent correction developed from extreme overbought conditions.
The US dollar index has already created a rebound from the support. This further increases the pressure on platinum prices in the short term.
A Break Below $1,500 Increases Pressure on Platinum
The monthly chart for platinum shows that price remains under extreme pressure in October. The price has broken the $1,530 region and lost over 12% in October. The breakout from $1,530 has opened the door for further drops towards the $1,200 to $1,350 area. This area is considered major support in the platinum market in the long term.
If the price continues to drop towards $1,200 to $1,350 and then recovers back above $1,530, it will likely confirm bottom. This bottom formation may open the way for $1,900. But a break below $1,200 will damage trend in the long term and push prices near $1,000.
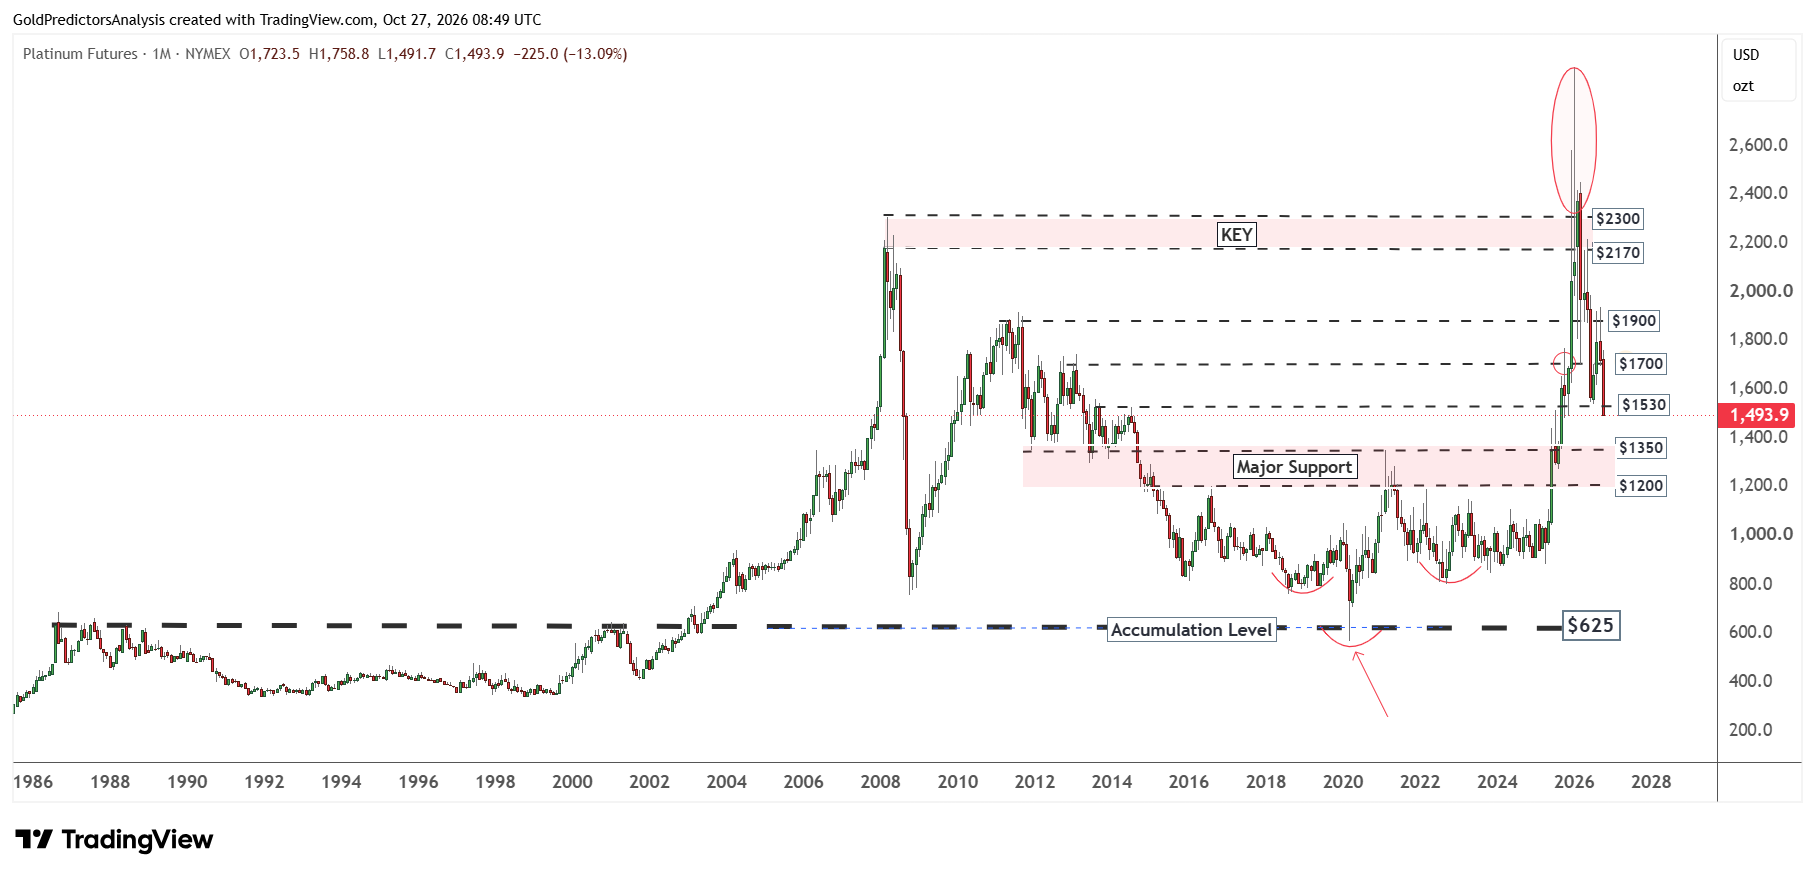
The platinum price must break above $1,900 to open the way for upside towards the $2,170 to $2,300 region. This region is considered the key zone for further upside in platinum.
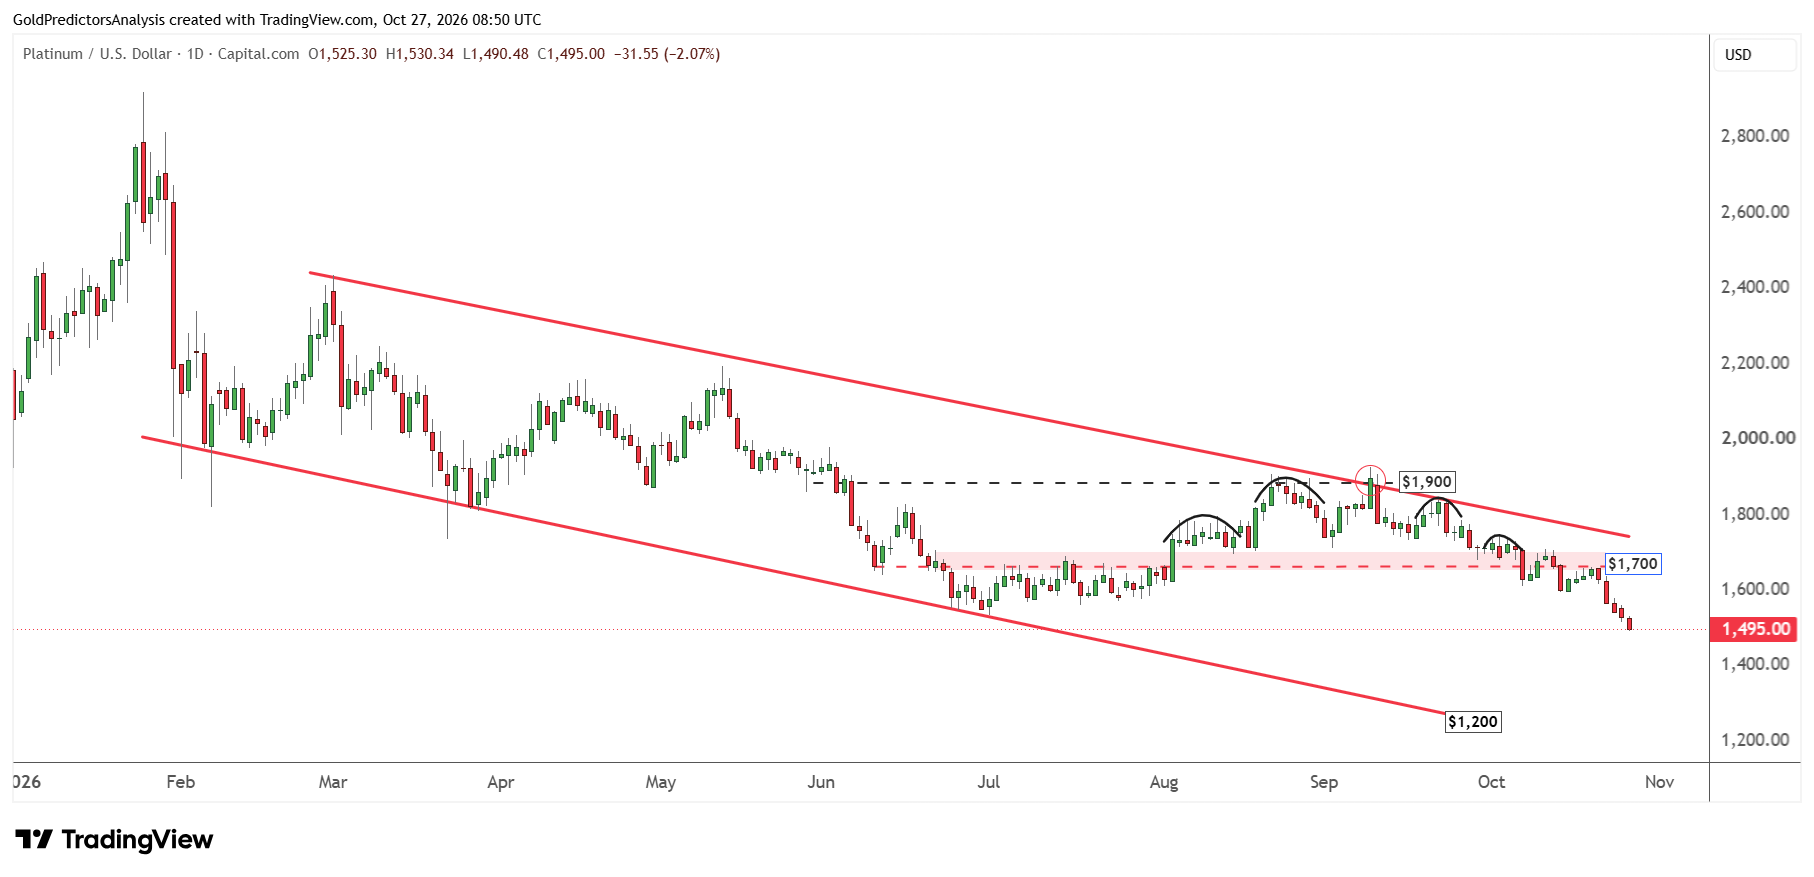
The strong bearish pressure in platinum is also observed on the daily chart. The price formed head and shoulders pattern in August and September. Then, the price has broken below the $1,700 region after forming this pattern within the descending channel. A break below the $1,530 level suggests that the price may continue to drop to $1,350.
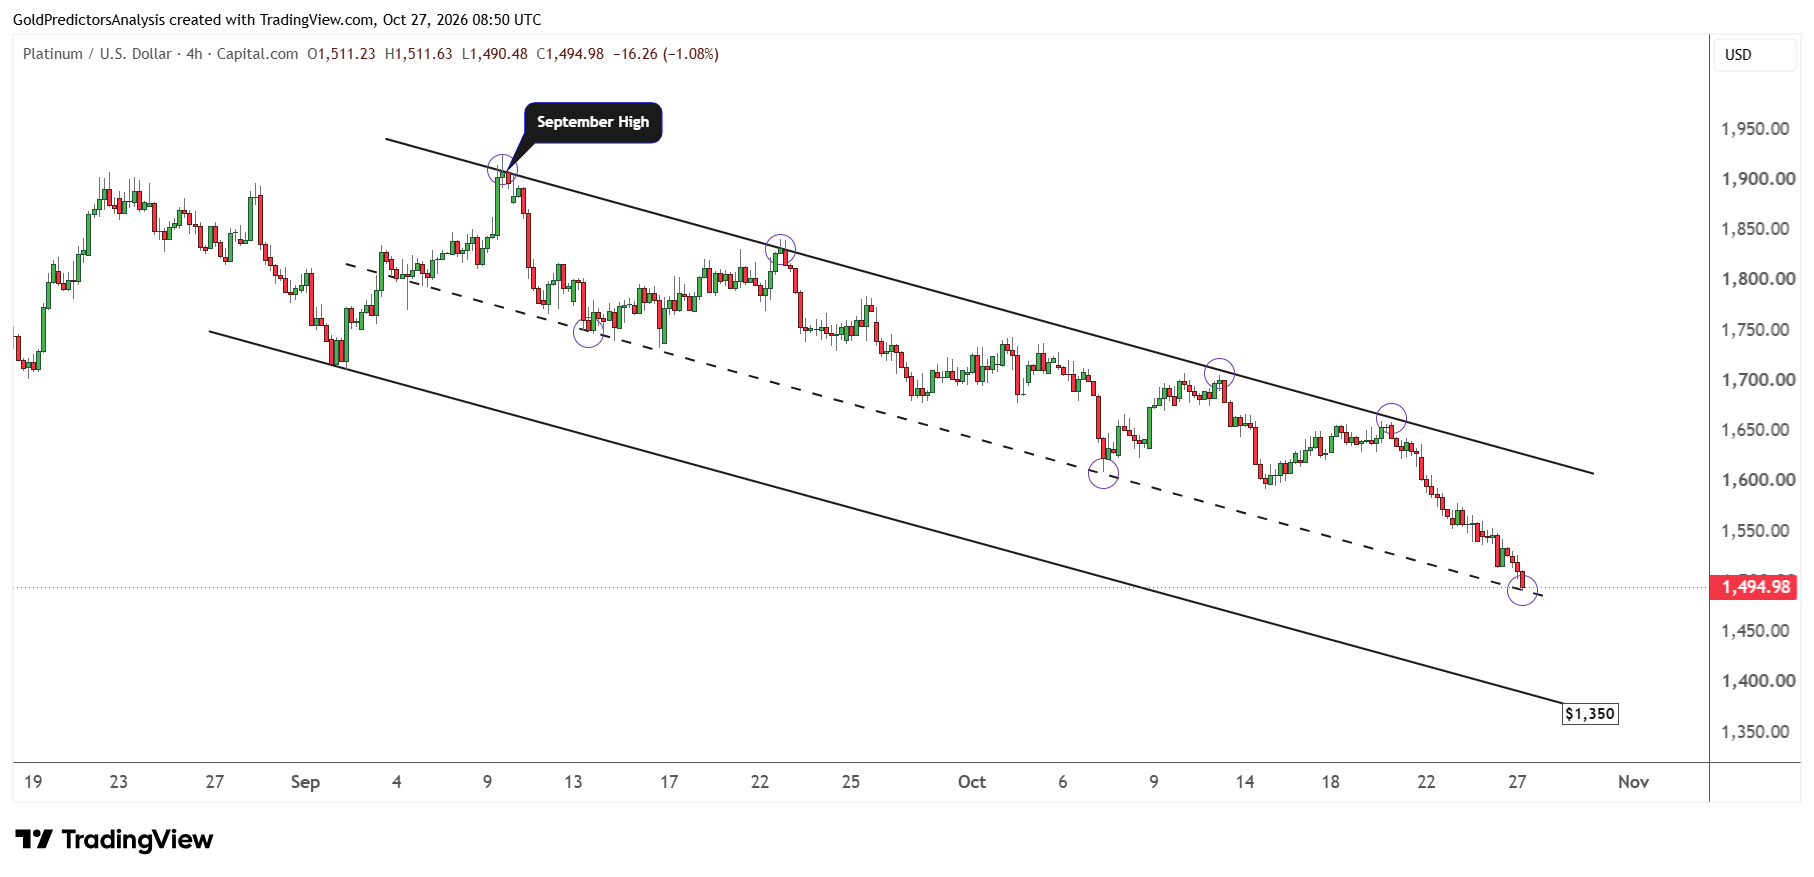
The 4-hour chart for platinum also shows that the immediate trend remains strongly bearish as the price trades within the descending channel. The price is now challenging the midline of this channel near $1,500, but the momentum remains negative. A continued drop below this level will increase the risk of drop to $1,350. This level is defined by the support of descending channel.
Ratio Charts Show Relative Weakness for Platinum
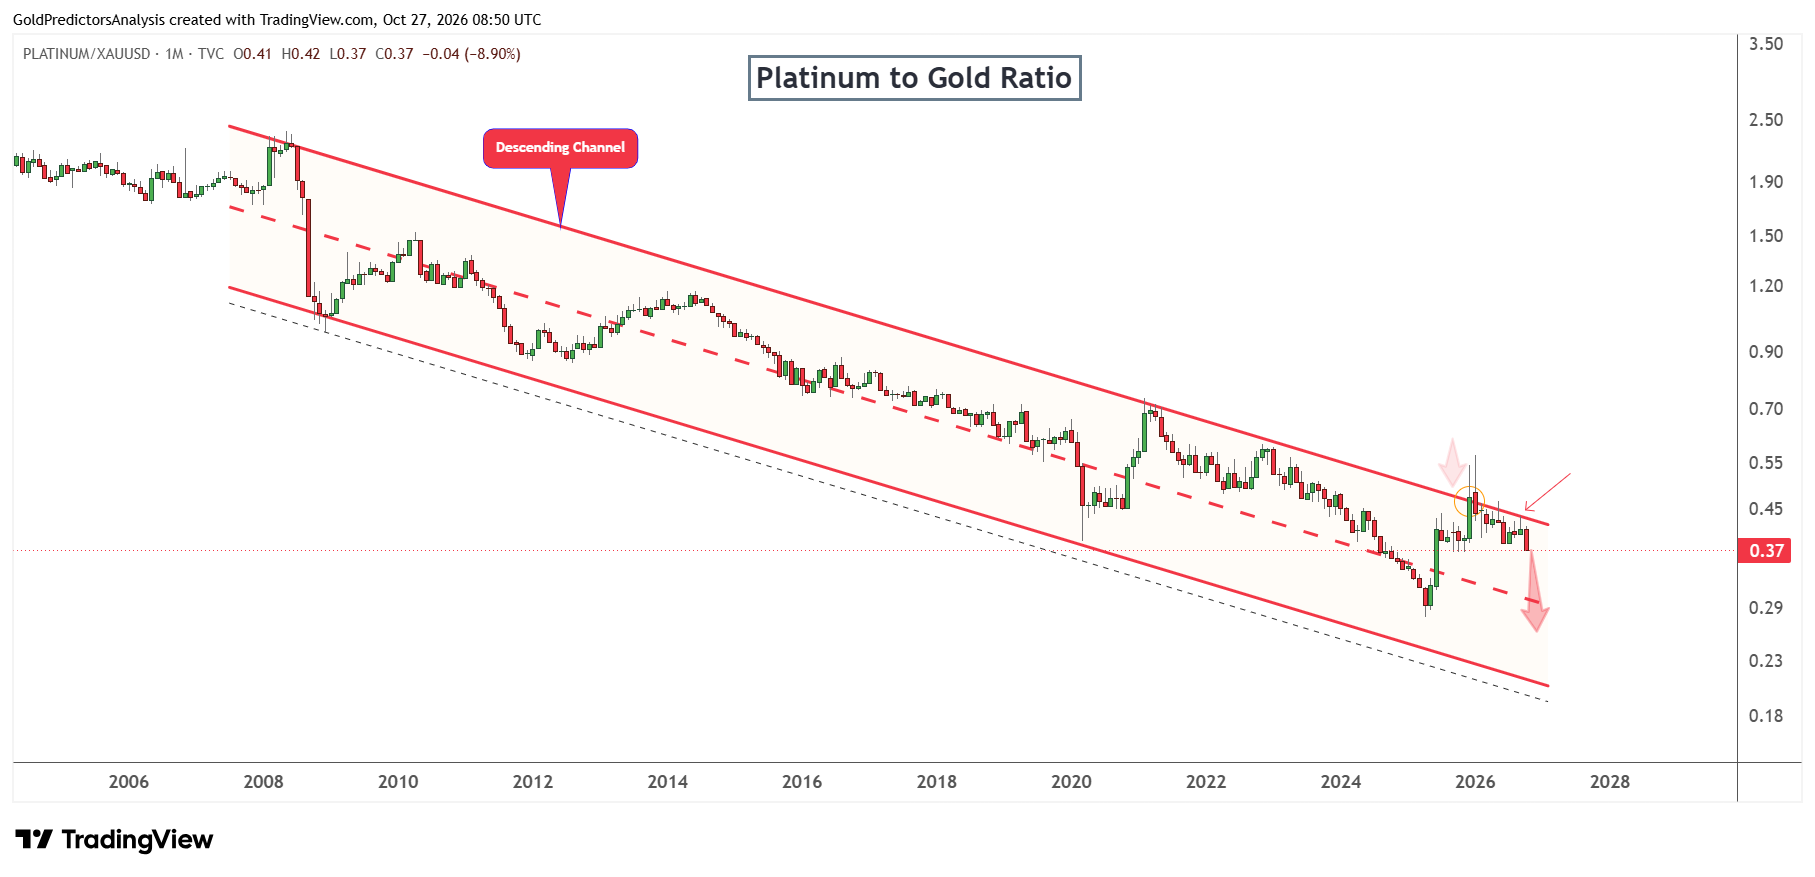
The weakness in the platinum market is further observed using the ratio of platinum to gold (XAU). The chart below shows that the platinum-to-gold ratio has dropped after forming strong resistance at the descending channel. The ratio marked a high in January 2026 at 0.57. Then it dropped to mark negative candle below the resistance of the descending channel.
This bearish pattern and the consolidation during the past nine months suggest that the ratio may continue to drop further. The drop in the ratio from the strong resistance of the descending channel suggests that platinum prices may continue to underperform the gold market.
The weakness in platinum is further confirmed by the gold to platinum ratio. This shows the opposite effect to that seen on the platinum to gold ratio. The chart shows that the ratio produced a low at 1.75 in January 2026 at the support of ascending broadening wedge.
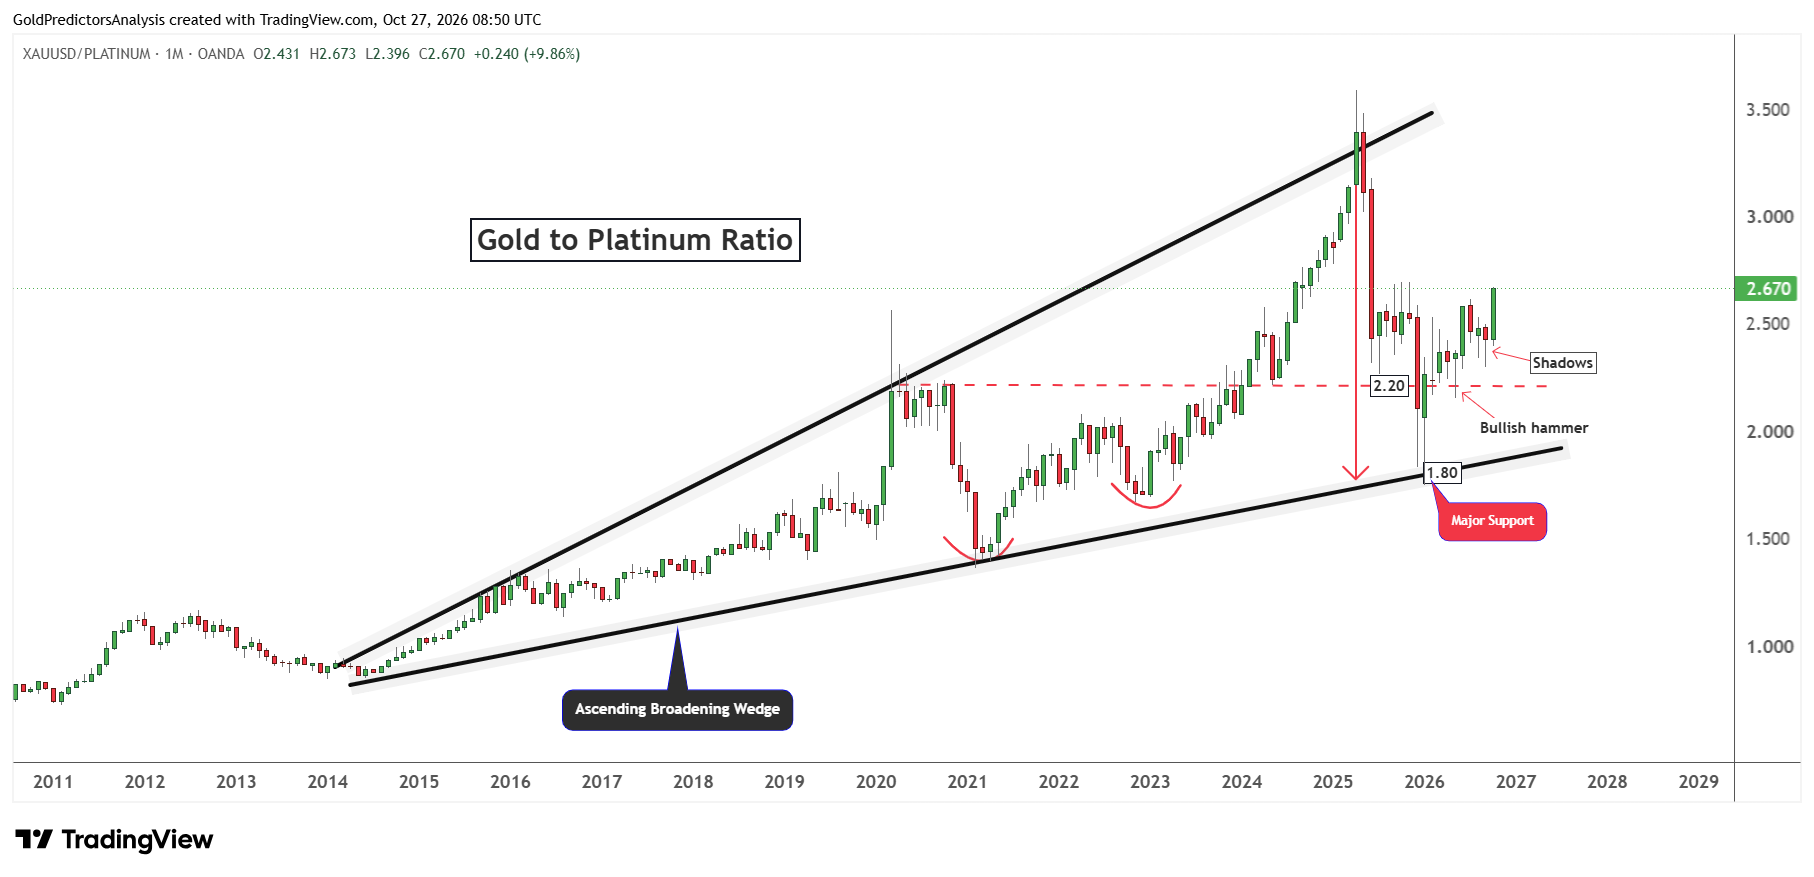
This low was formed when the platinum-to-gold ratio formed high at the resistance area. The formation of a bullish hammer candle in January 2026 and then in May 2026 near the key support levels of 1.80 and 2.20 suggests further upside in the ratio. Now, it is attempting to break above the 2.69 level, which suggests further upside. This positive momentum within the ascending broadening wedge pattern suggests that platinum prices may continue to underperform the gold market.
What to Watch Next
Platinum prices remain under bearish pressure and look to drop towards the long-term support zone of $1,200 to $1,350. The weakness in platinum prices is further confirmed by the platinum-to-gold ratio, which has dropped nearly 9% in October so far. This weakness is further confirmed by the gold-to-platinum ratio, which has produced strong positive reversal candles within the ascending broadening wedge pattern.
The continued drop in the platinum-to-gold and continued strength in the gold-to-platinum suggest that platinum may continue to underperform the gold market and remain under bearish pressure in the short term. This weakness is further confirmed by the recent escalation in the Middle East that has triggered a surge in oil prices. Any new attacks on Saudis may keep oil prices elevated which may increase expectations of further tightening by the Fed. This may keep the platinum prices under pressure in the short term until there are any clues about the cooling of inflation pressure.
The key events for this week are the Fed decision, core PCE price index and Q3 GDP data. The market is watching for signals from the Fed about interest rates. The strong inflation data may push the US dollar and Treasury yields higher and increase pressure on platinum prices. On the other hand, the soft inflation data may create rebound in platinum in the short term. But the continued strength in oil prices still remains a risk.
Read more: Oil Above $110 Pressures Platinum