


Silver (XAGUSD) has continued its rally despite stronger U.S. Dollar and higher Treasury yields, which shows strong resilience in a difficult macro environment. I think that the combination of strong Chinese demand, sticky inflation and bullish patterns set the stage for silver to challenge $100. This article presents the key macro drivers, the technical structure of silver and the gold-to-silver ratio signals that support the next phase of rally.
Strong Physical Demand Keeps Silver Bulls in Control
Silver is on a winning streak in a challenging macro backdrop. The U.S. Dollar is recovering and U.S. Treasury yields are rising after the better-than-expected U.S. inflation data. This environment indicates negative impact on silver. But silver is surging higher despite these weaknesses. This surge is driven by strong physical demand in Asia. This demand has helped to reduce the effects of rising yields and stronger dollar. It also reveals that the silver rally now is not just a speculative one.
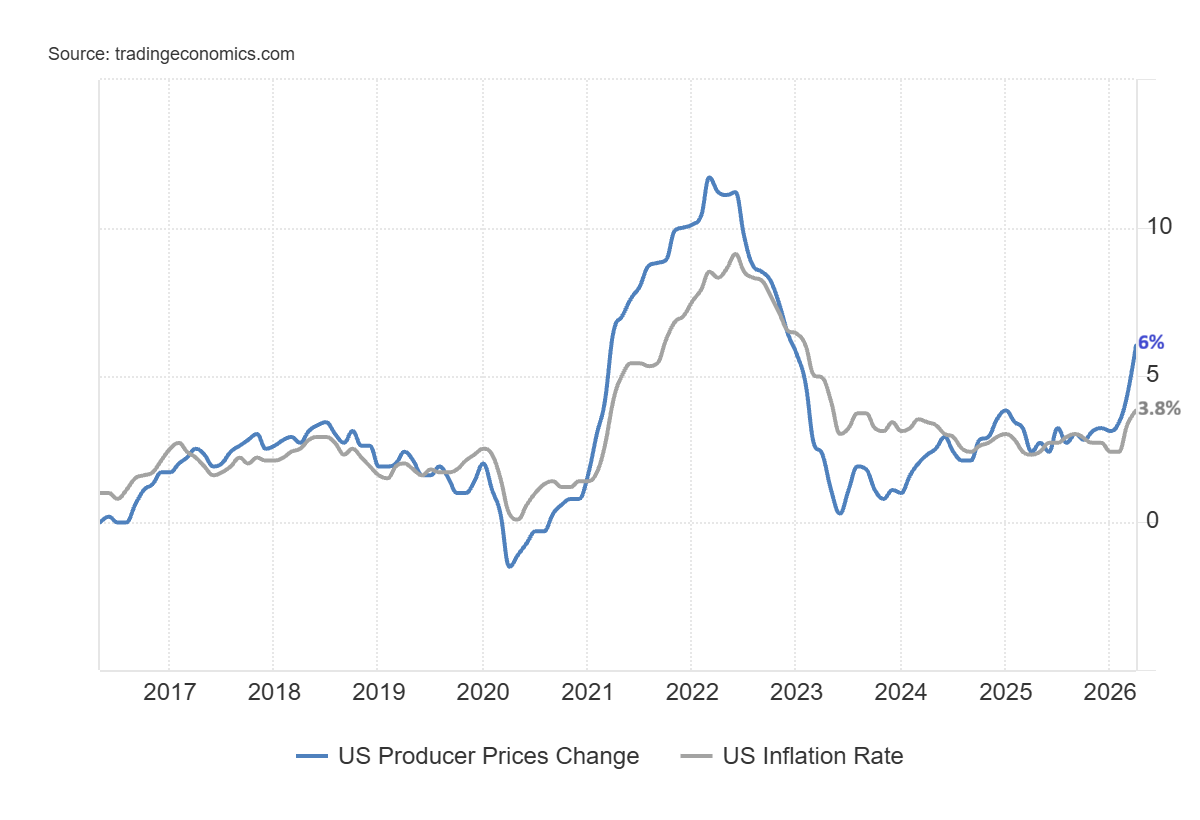
The U.S. inflation report has impacted the US interest rate outlook. The chart below shows that the inflation rate increased to 3.8% in April while the producer price inflation increased to 6%.
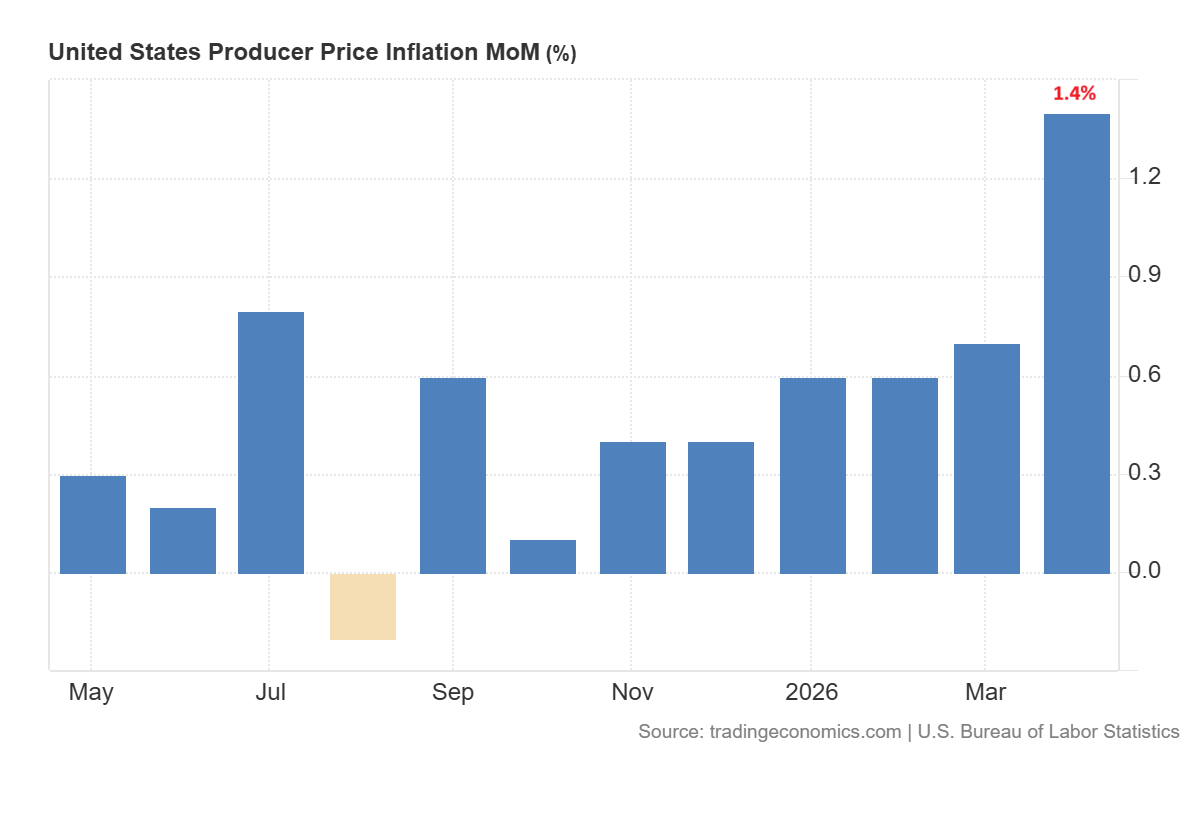
The producer prices in US surged to 1.4% in April which was the biggest increase since March 2022.
This data drives up the urgency for the Federal Reserve to remain disciplined in policy stance for longer period. If the rate increases, the demand for precious metals will decrease. But the strength in silver suggests that investors are not concerned about the rate headwind as they are considering supply risk, inflation protection and industrial demand.
The geopolitical tensions are providing a further boost. The risk stems from energy supply concerns in the Middle East. Oil price volatility can escalate due to the Middle East disruptions and put upward pressure on inflation.
Silver Price Forecast
Every new Silver analysis as it publishes, today's technical signal and key levels, live price — on one page.
See all Silver forecastsChina Demand Emerges as Silver’s Main Bullish Catalyst
The driving force of silver’s strength continues to be China. Market support has been provided by Chinese traders, retail buyers and solar manufacturers. The big traders on the Shanghai Futures Exchange have continued to buy silver in recent weeks, according to TD Securities. Local demand for premiums has also remained high.
This strength is also supported by the open import arbitrage. If Chinese prices continue to hold above international prices, traders will have an incentive to export silver to China. This has contributed to the importation of metals from the world markets into Asia. It also provides an understanding of the reasons why silver has continued to march higher despite the dollar and Treasury yields turning against precious metals.
The silver imports into China increased dramatically in March. The retail investors purchased small silver bars as an alternative to gold which was more expensive. Solar manufacturers also preemptively sparked demand in Q1 ahead of the phasing out of export tax rebates on April 1. This gave the market a shot in the arm and helped keep bullish sentiment alive in silver.
But this demand growth could not be sustained. A bit of the March buying was due to temporary factors particularly front-loading around solar. The solar industry in China is under further pressure as the Chinese government aims to curb overcapacity in the industry. Demand for industrial silver may come under pressure if production starts to slow. High prices can also make some manufacturers consider cheaper materials.
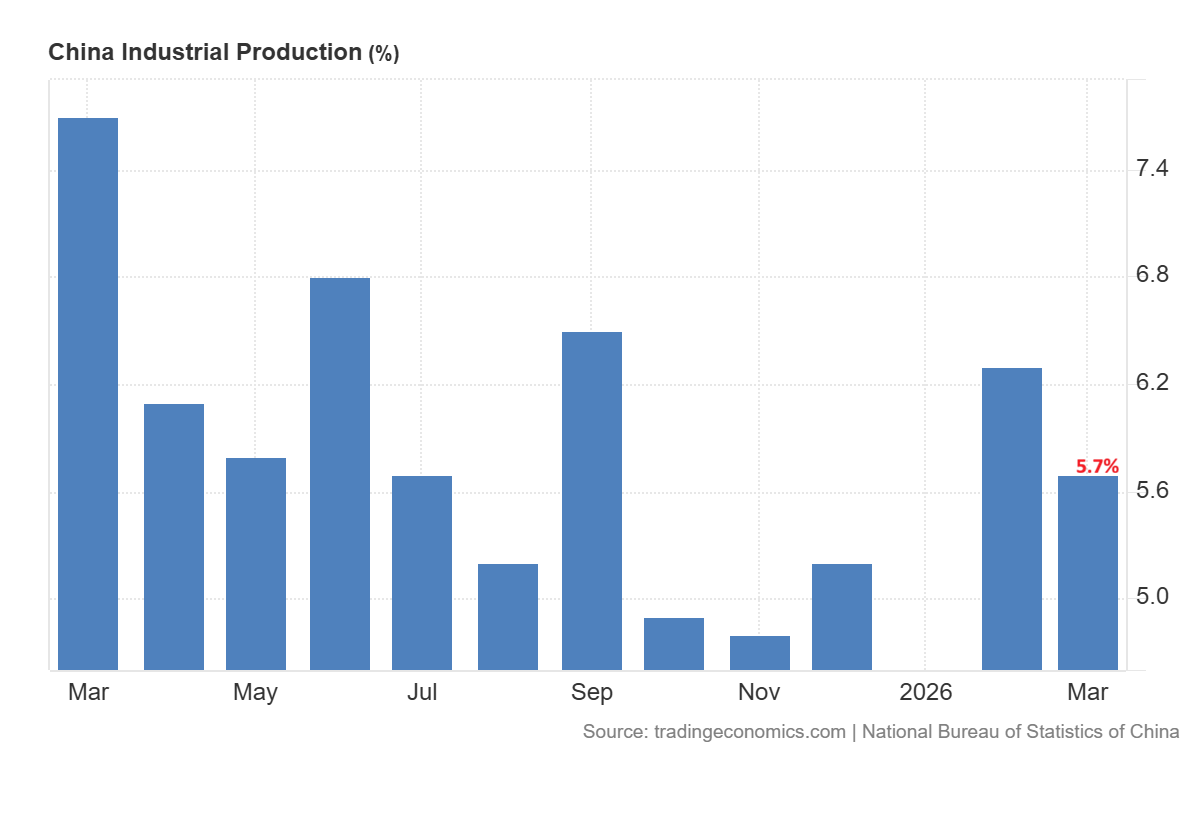
The industrial production in China was strong at 5.7% in March but slightly lower than the previous month.
Silver Technical Analysis Signals Breakout Above $100
Long-Term Picture
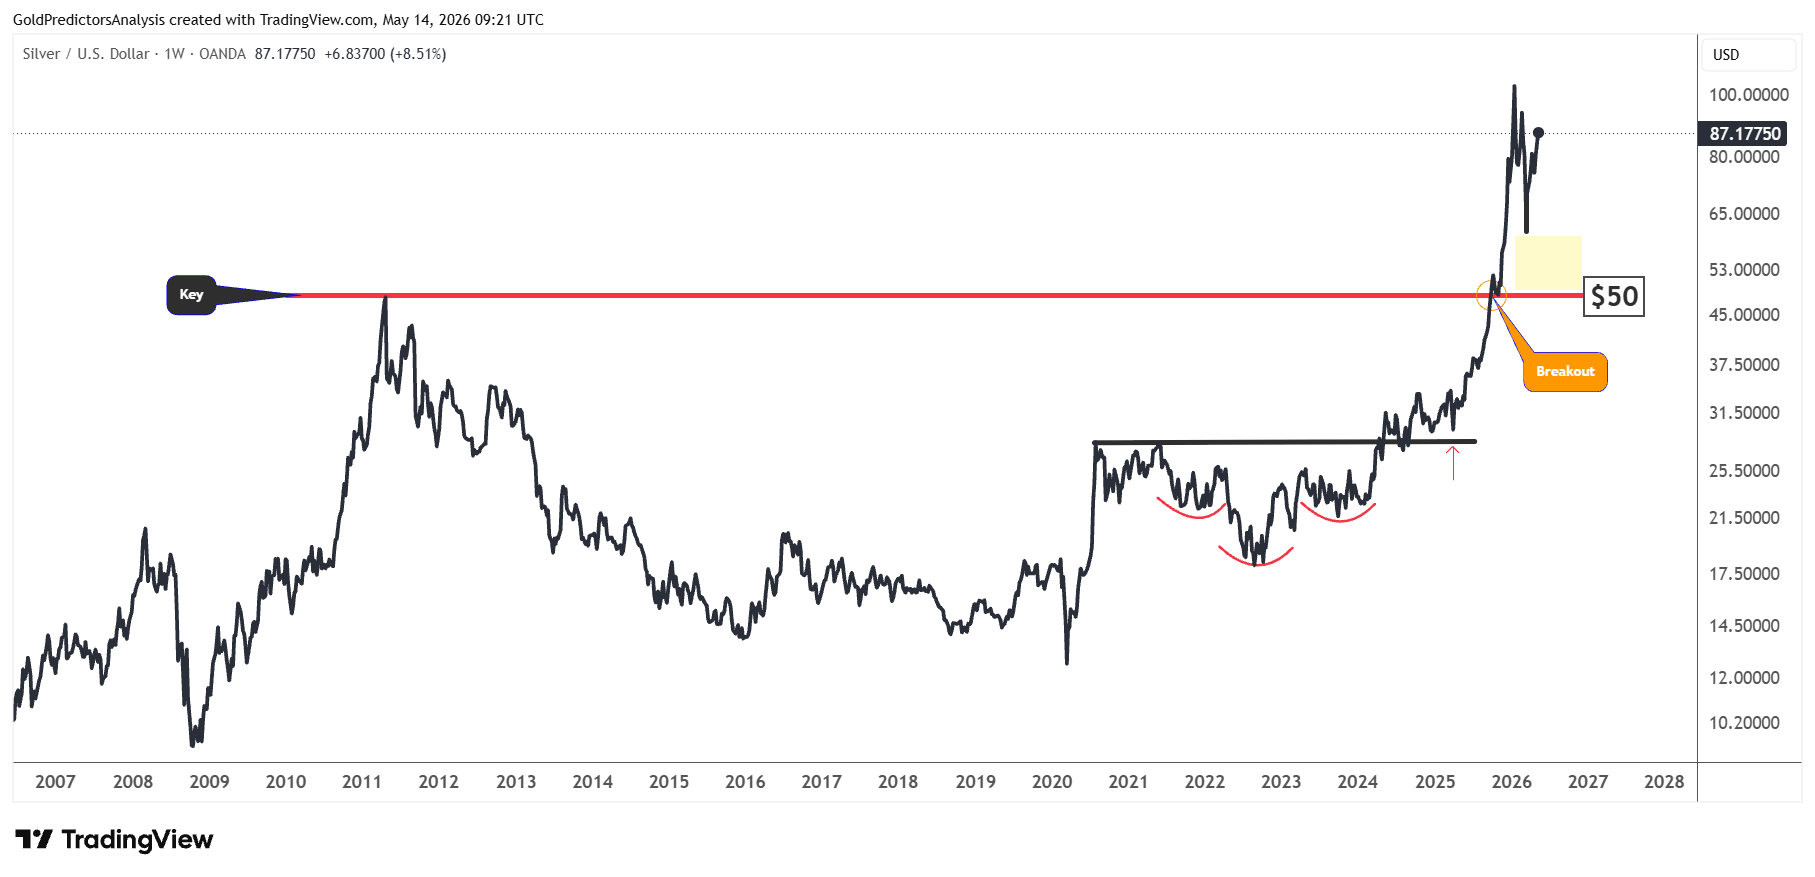
The long-term price structure for spot silver remains strongly bullish, as seen in the weekly chart below. The price has broken above the $50 area after forming a strong inverted head and shoulders pattern from 2021 to 2025.
This breakout from the neckline of the inverted head-and-shoulders patterns also broke the long-term resistance at $50. After hitting $120, the price retraced back towards the breakout region, which lies between $50 and $60. The price is now rebounding higher again.
The retracement towards the $50 to $60 zone, followed by a rebound, indicates that the silver market has produced an exceptional buy signal at long-term support. This signal will be confirmed when silver prices break $100. The price is now heading towards the $100 area in the short term.
Short-Term Picture
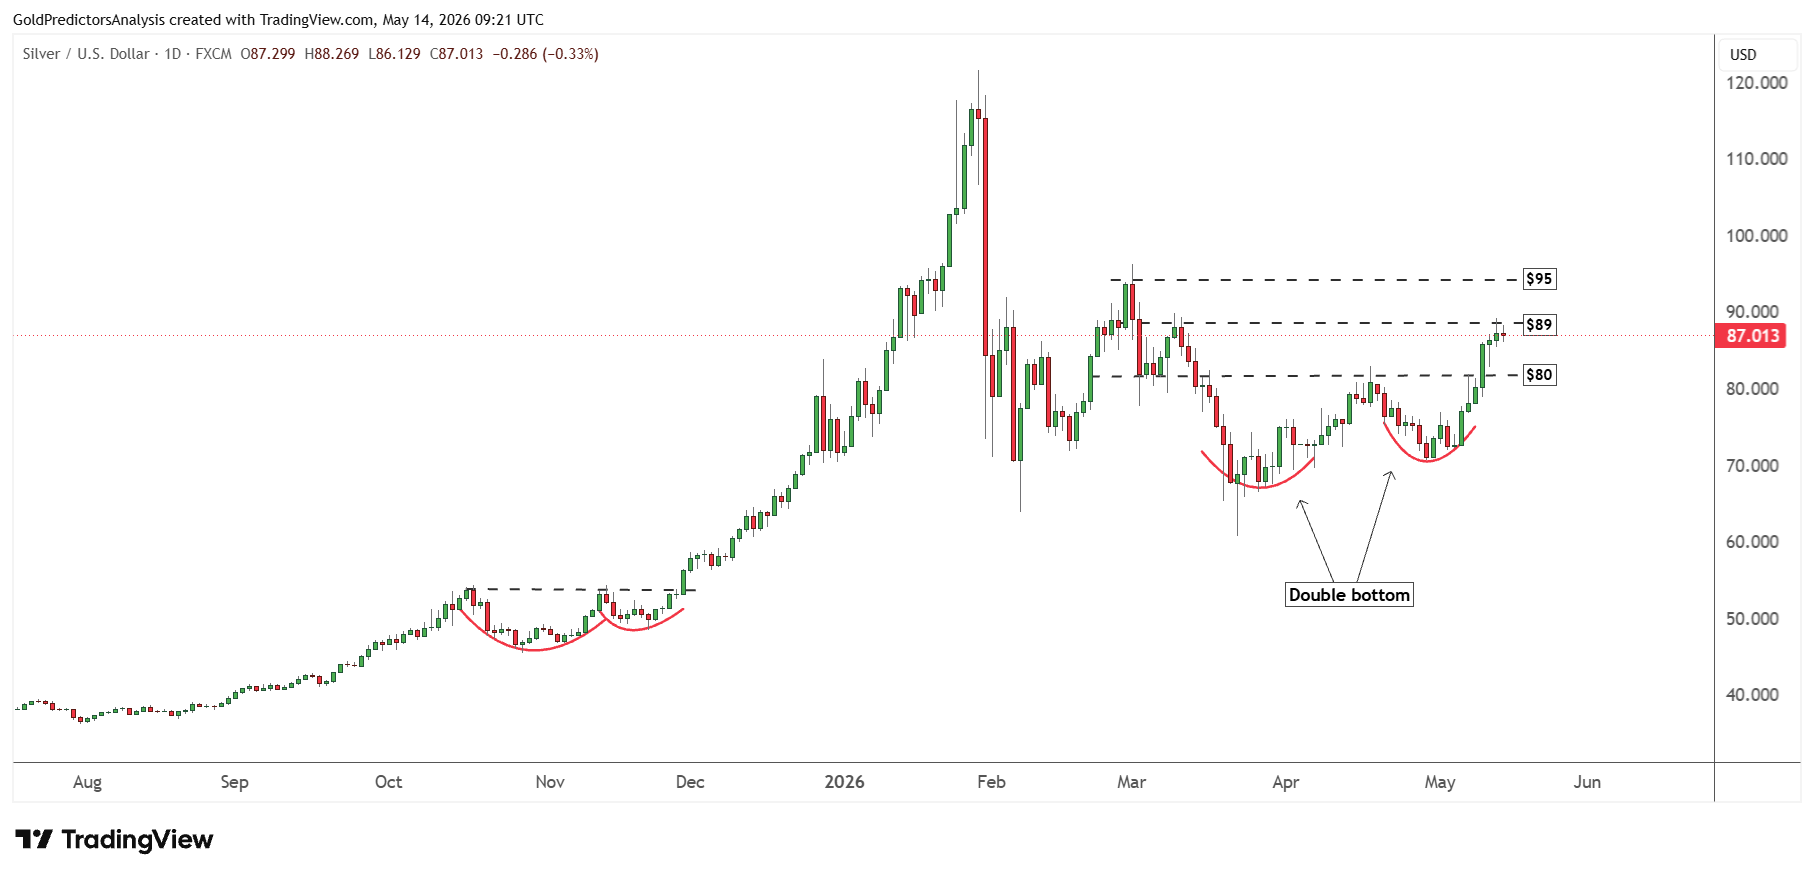
Based on the short-term price structure, it looks like the silver price is preparing to break $100, as it has formed a double bottom pattern by marking lows on 23 March and 29 April at $60.81 and $70.69, respectively. The neckline of this double bottom pattern was broken at $80. Now the price has hit the $89 area as immediate resistance.
Any correction towards $80 will likely be considered a buying opportunity to take prices towards the $95 region. A break above $95 to $100 will likely push the silver market towards $120.
It is observed that these kinds of bullish formations usually spark rally as the market remains in a bull phase.
The formation of the cup and handle pattern (bottom pattern) from October 2025 to November 2025 also led to a strong surge. This surge marked a high in January 2026 at $120.
Therefore, the consolidation in Q1 2026 has again produced bottom patterns which will likely push prices higher in 2026.
Silver Leads Gold as Ratio Breaks Lower
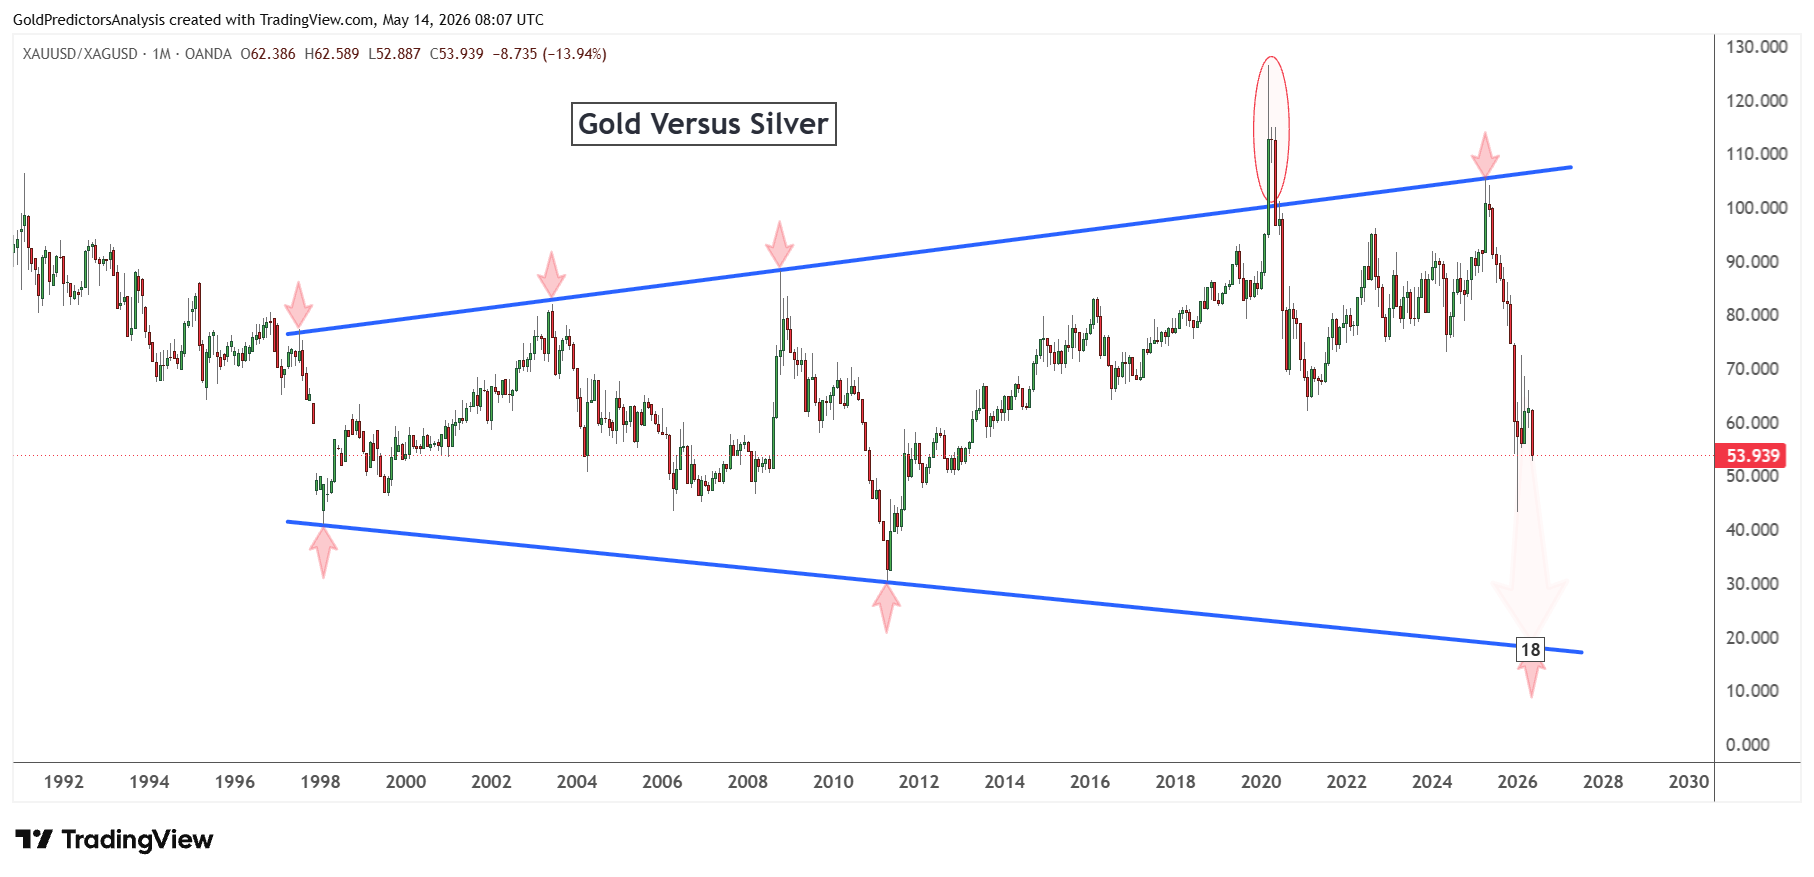
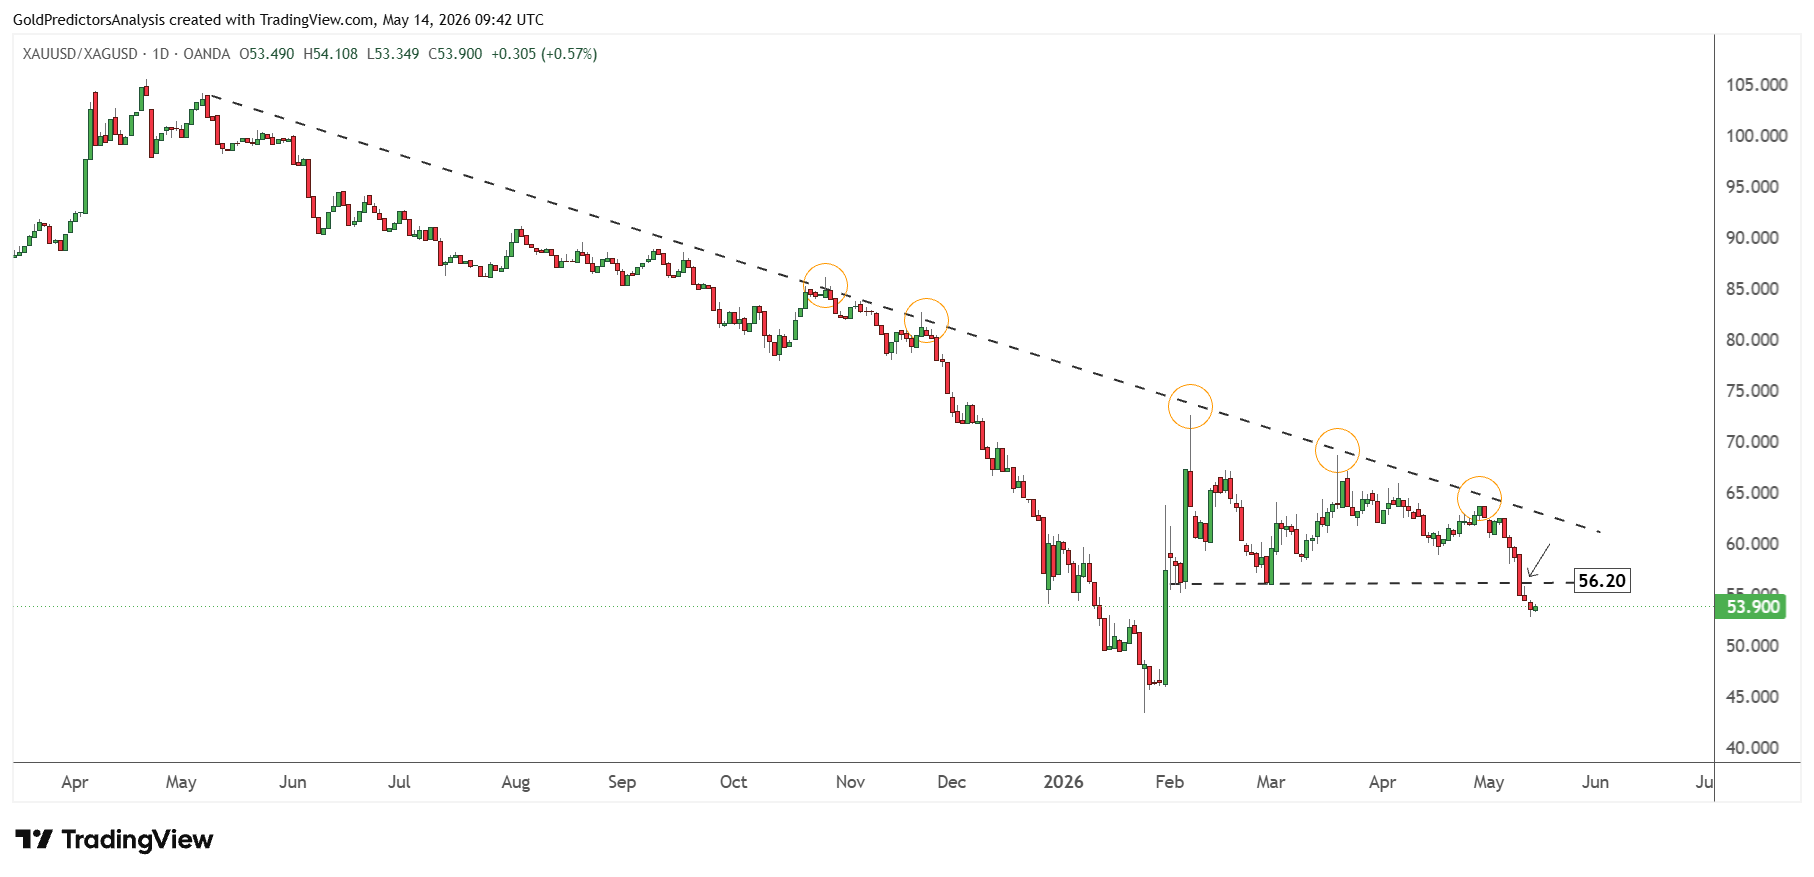
The most important reason why silver is leading the gold (XAU) market is that the gold-to-silver ratio has come under extreme pressure after hitting long-term resistance in April 2025. This was the time when the real bull cycle of the precious metals sector began.
Now, the ratio is dropping to extremely low levels which indicates that silver prices will likely lead the next rally in the precious metals sector. This indicates that if gold breaks $5,600, then silver will be much higher above $200.
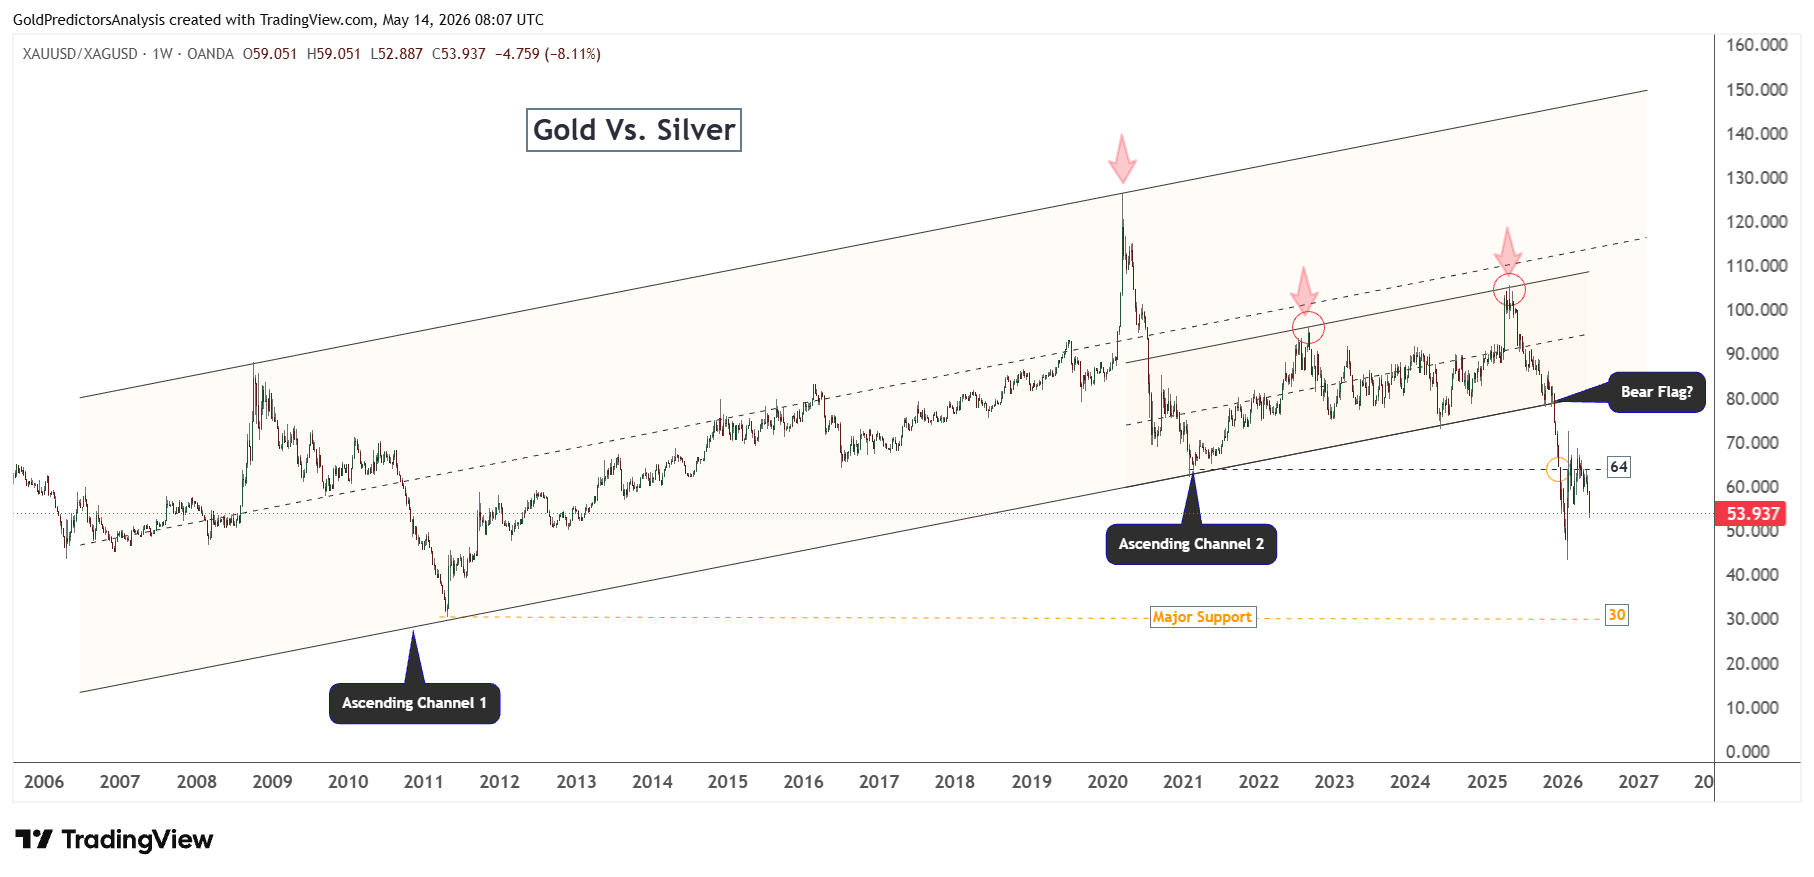
This strong bearish price action is also evident on the weekly chart, which rebounded higher in February and March but failed to break above 64 due to the significant resistance as discussed previously. After hitting the 64 level, the ratio again continues to drop. This kind of negative price action indicates that the immediate support remains at the 30 level.
If the ratio continues to trade towards the 30 area and the silver market continues to lead the gold market, then silver prices will likely break $120 soon.
The strong negative trend in the gold-to-silver ratio is also observed by the descending trend line drawn from the April 2025 highs. Each time the ratio hit the trend line, it continued a strong drop. Now, the ratio has broken 56.20 after hitting the descending trend line. This breakout suggests that the silver has resumed the positive momentum.
Final Words
The strong bullish technical profile, high inflationary pressure and strong physical demand support the silver price. The metal has gained ground on solid demand from China despite the strength in U.S. Dollar and Treasury yields. This indicates that the current rally is not driven by short term speculations. Asian demand, solar-sector buying and retail interest continue to provide a strong base for the market. The macro picture is also supportive, as the tensions in the Middle East keep the inflation risk alive.
The technical analysis also suggests more upside ahead. The price is moving towards $100 after the strong rebound from the long term support. A break above $96 to $100 will provide bulls a much stronger case to take the prices to $120. The sharp drop in the gold-to-silver ratio from the pivotal zone also suggests that silver is poised to outperform gold during the next precious metals bull rally. Investors may continue to buy silver on any correction to $70-$80 to target the $100 and $120 in the short term. Based on the recent fundamental and technical developments, if the silver prices hold at $80, then the prices will likely break above $100 to reach $120.
If you’d like to know more about how to trade gold and silver, please visit our educational area.