


The S&P 500 has delivered extraordinary gains since 2009. But there is one chart that should have every U.S. equity investor furrowing their brow.
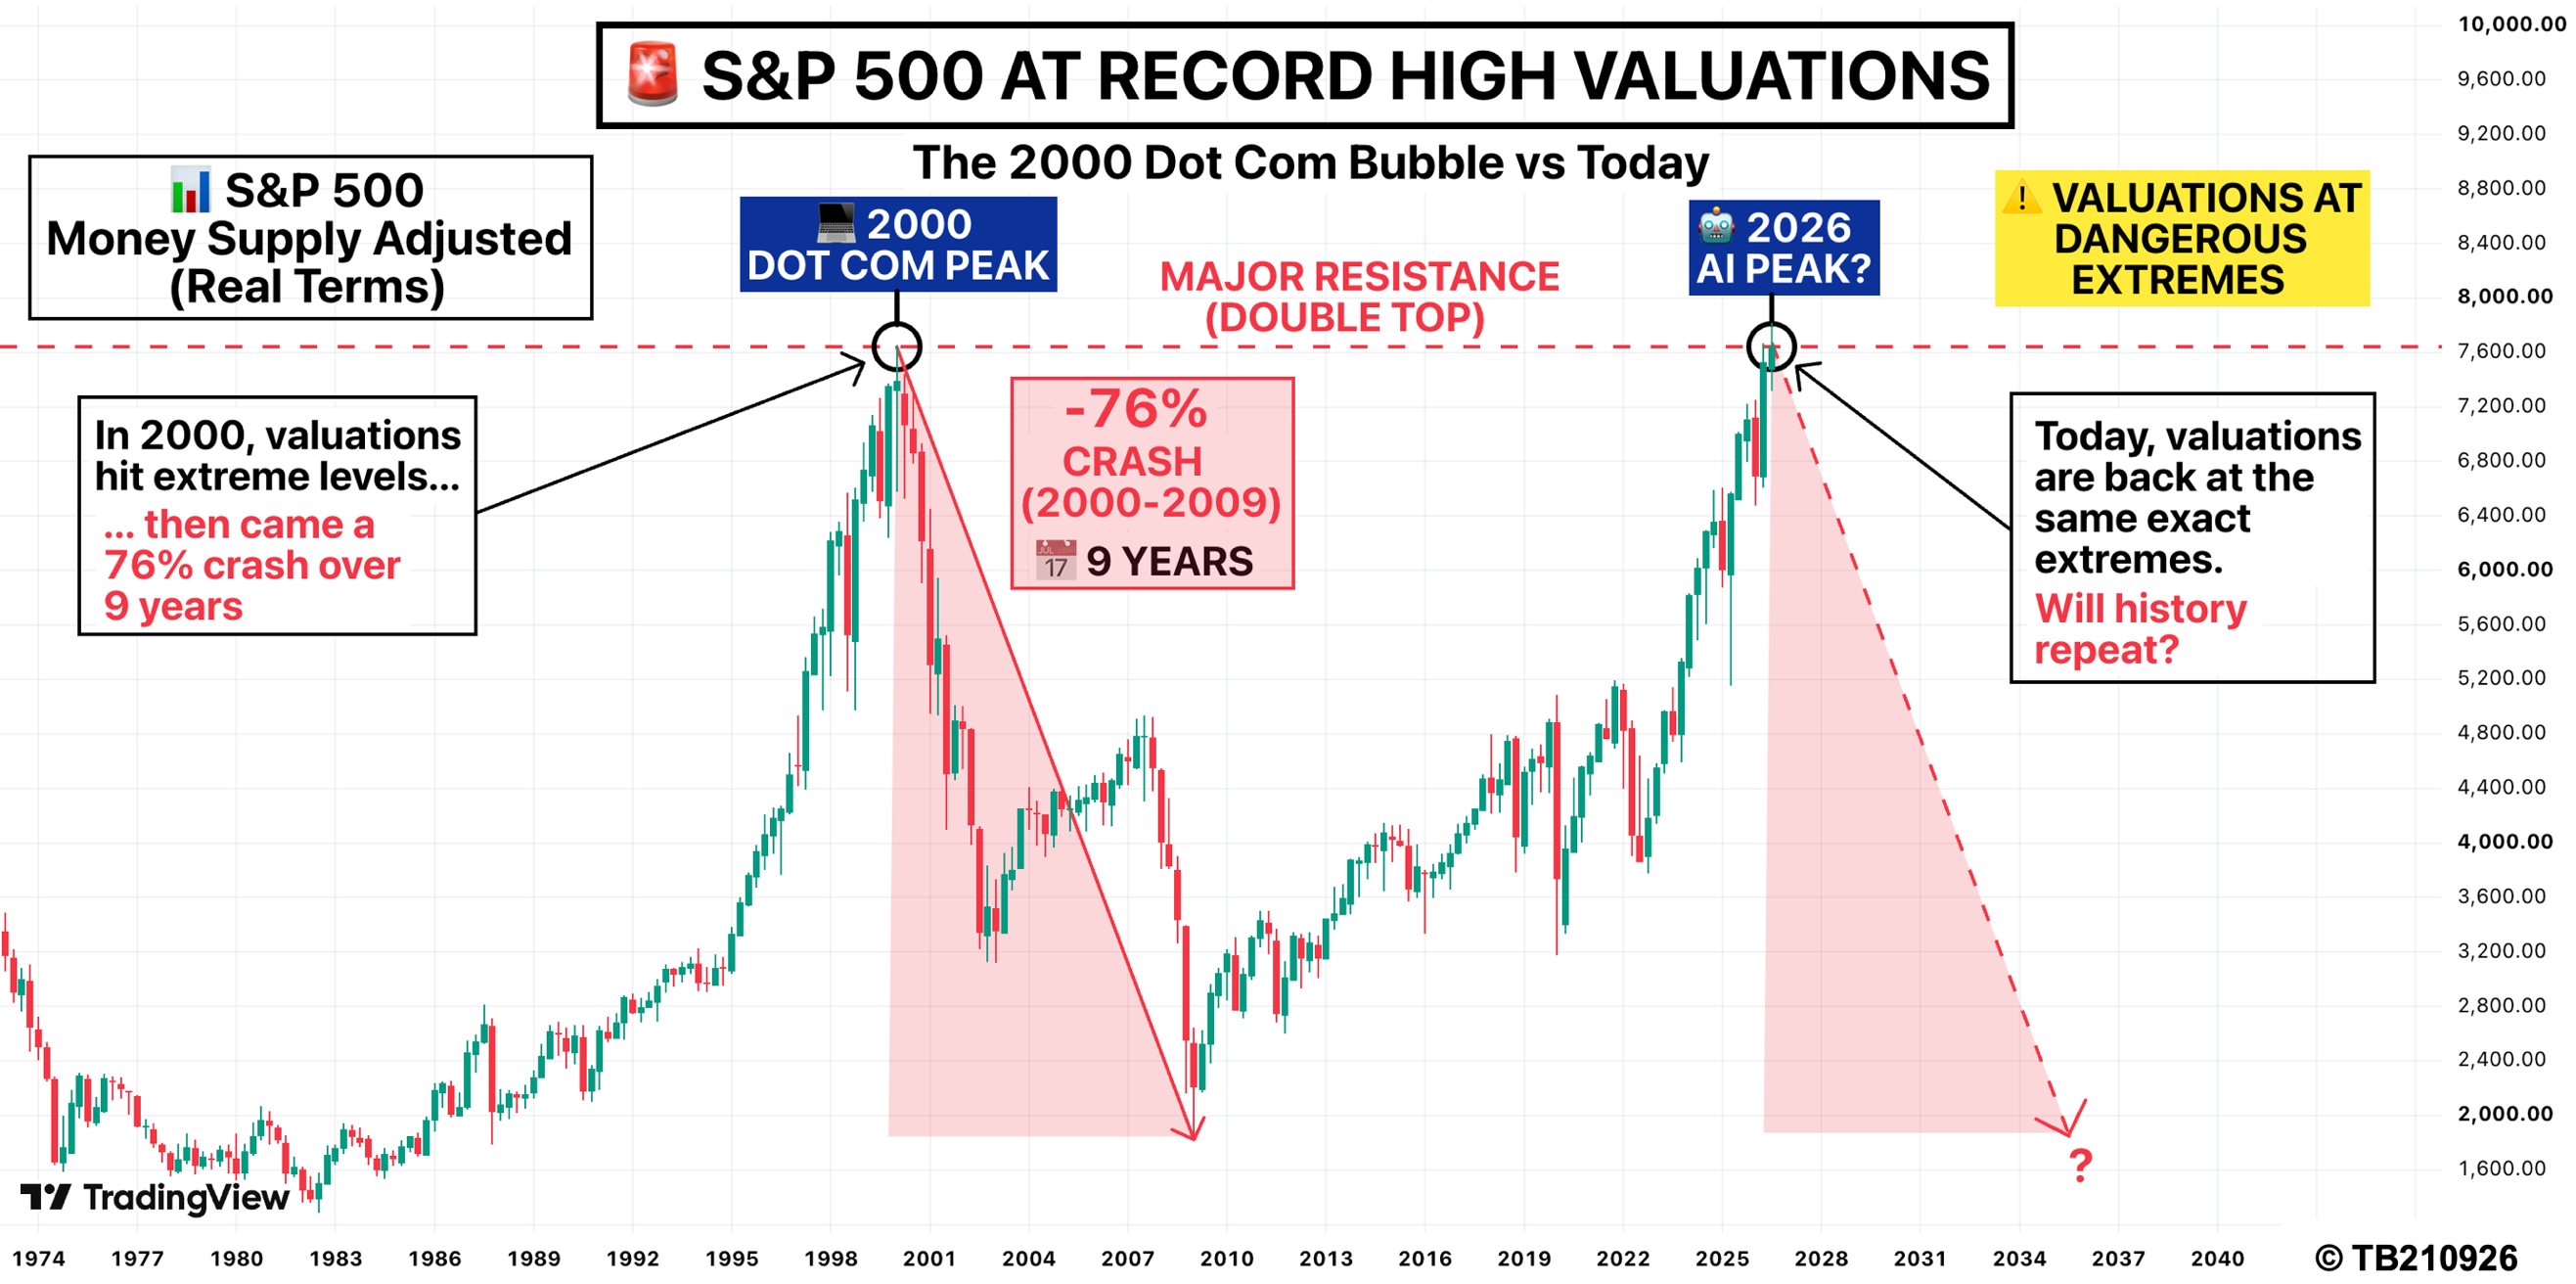
After adjusting the S&P 500 for the enormous expansion in the U.S. money supply, my analysis shows the index is now trading at the same valuation level as the peak of the 2000 Dot Com Bubble. Not materially higher. Not materially lower. The exact same.
This challenges one of the most common arguments used to justify today’s record valuations: “There is simply more money in the system today.” There is. But if the amount of money in the system has increased dramatically, shouldn’t we adjust asset prices for that liquidity? When we do, today’s market looks remarkably similar to 2000.
The Higher We Climb…
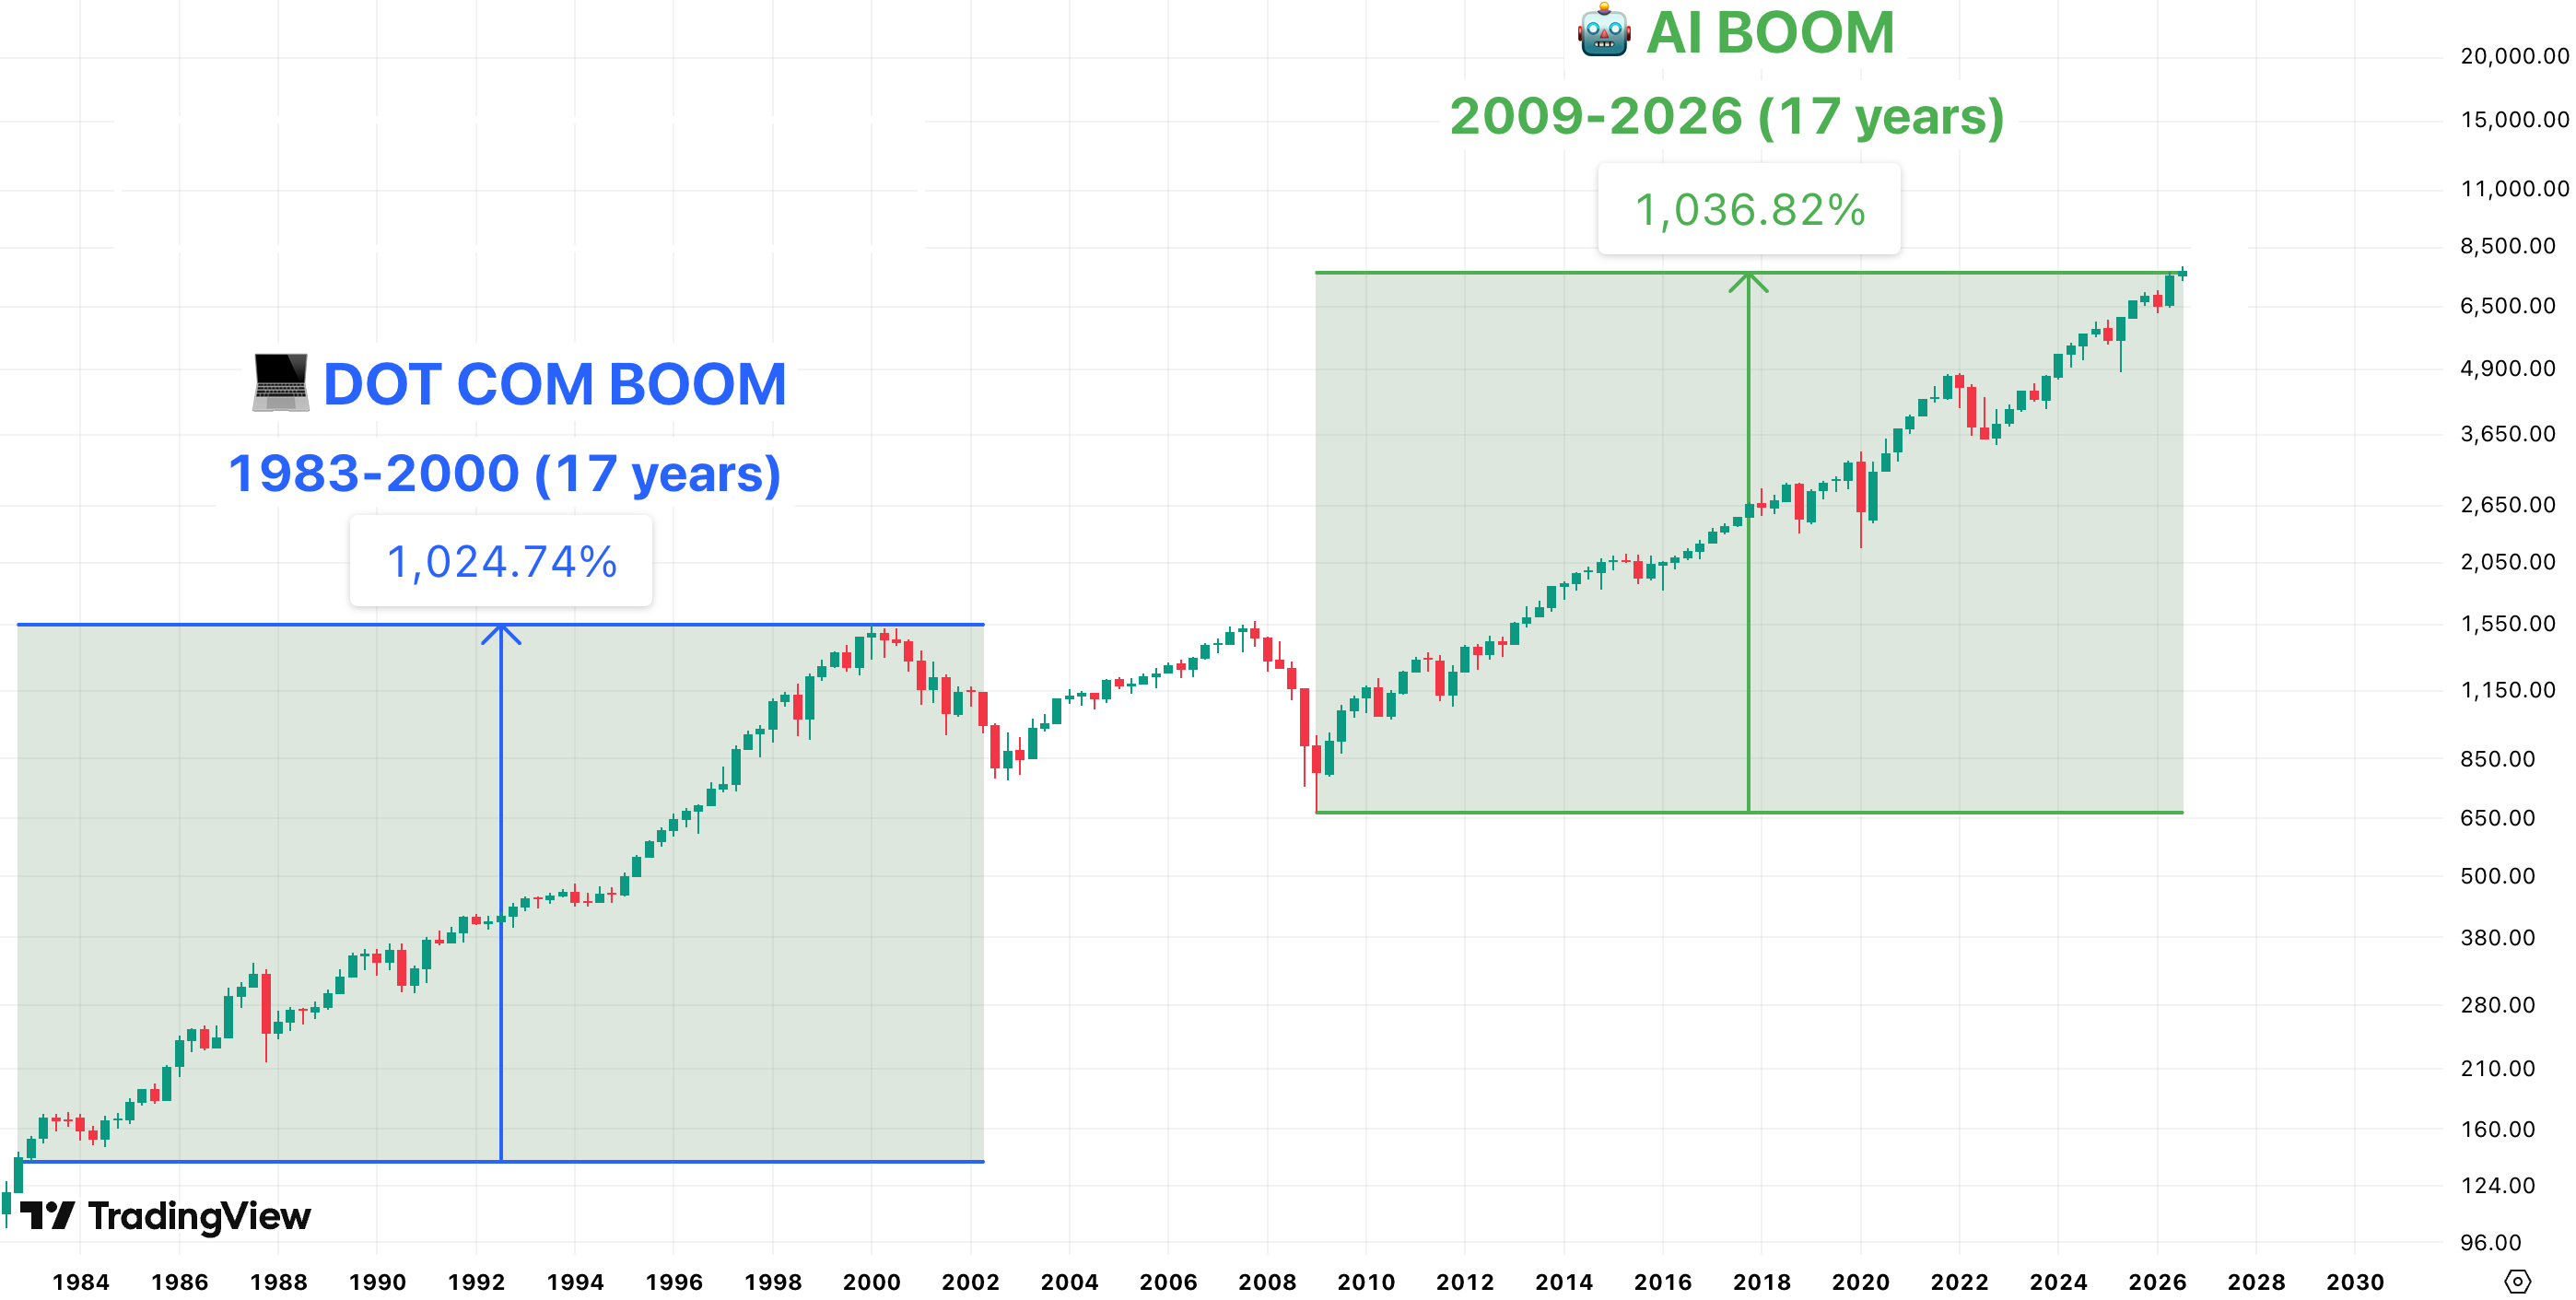
The scale of the S&P 500’s rise has been extraordinary. Over the past 17 years, the index has increased roughly 1,000%. That is strikingly similar to the magnitude of the advance during the 17 years leading into the 2000 Dot Com peak.
Of course, patterns never repeat perfectly. This economy is different. Corporate earnings are not a match. Interest rates vary from the years of the Dot Com cycle. And today’s technological innovators are more weightily endowed than many of the speculative companies that dominated the late-1990s bubble.
And there is another variable that has switched dramatically: The amount of money in the financial system.
S&P 500 Price Forecast
Every new S&P 500 analysis as it publishes, today's technical signal and key levels, live price — on one page.
See all S&P 500 forecastsDoes More Liquidity Justify Higher Valuations?
Rather than analysing the S&P 500 in isolation, I adjusted the index for U.S. M2 money supply.
M2 is a broad measure of money in the economy, incorporating currency, deposits and other highly liquid forms of capital. It therefore provides a powerful tool to examine how much the nominal value of financial assets has risen relative to the underlying monetary base available to support them.
The question is simple: Does today’s much bulkier money supply justify today’s much higher equity prices?
My analysis suggests the answer is not as reassuring as the bulls might hope. Once the S&P 500 is adjusted for M2, the market reaches a valuation level comparable with the peak of the 2000 Dot Com Bubble. In other words, the enormous expansion in liquidity does not mean today’s valuation extremes should simply be ignored. What we’re looking at merely changes the denominator. And that is an important distinction.
Three Independent Warning Signals
The liquidity-adjusted S&P 500 is not the only valuation measure flashing an intense reading. Three different measures are telling a broadly similar story.
S&P 500 / M2 Ratio: My analysis shows the ratio is at a joint historical high, matching the level reached around the 2000 Dot Com peak.
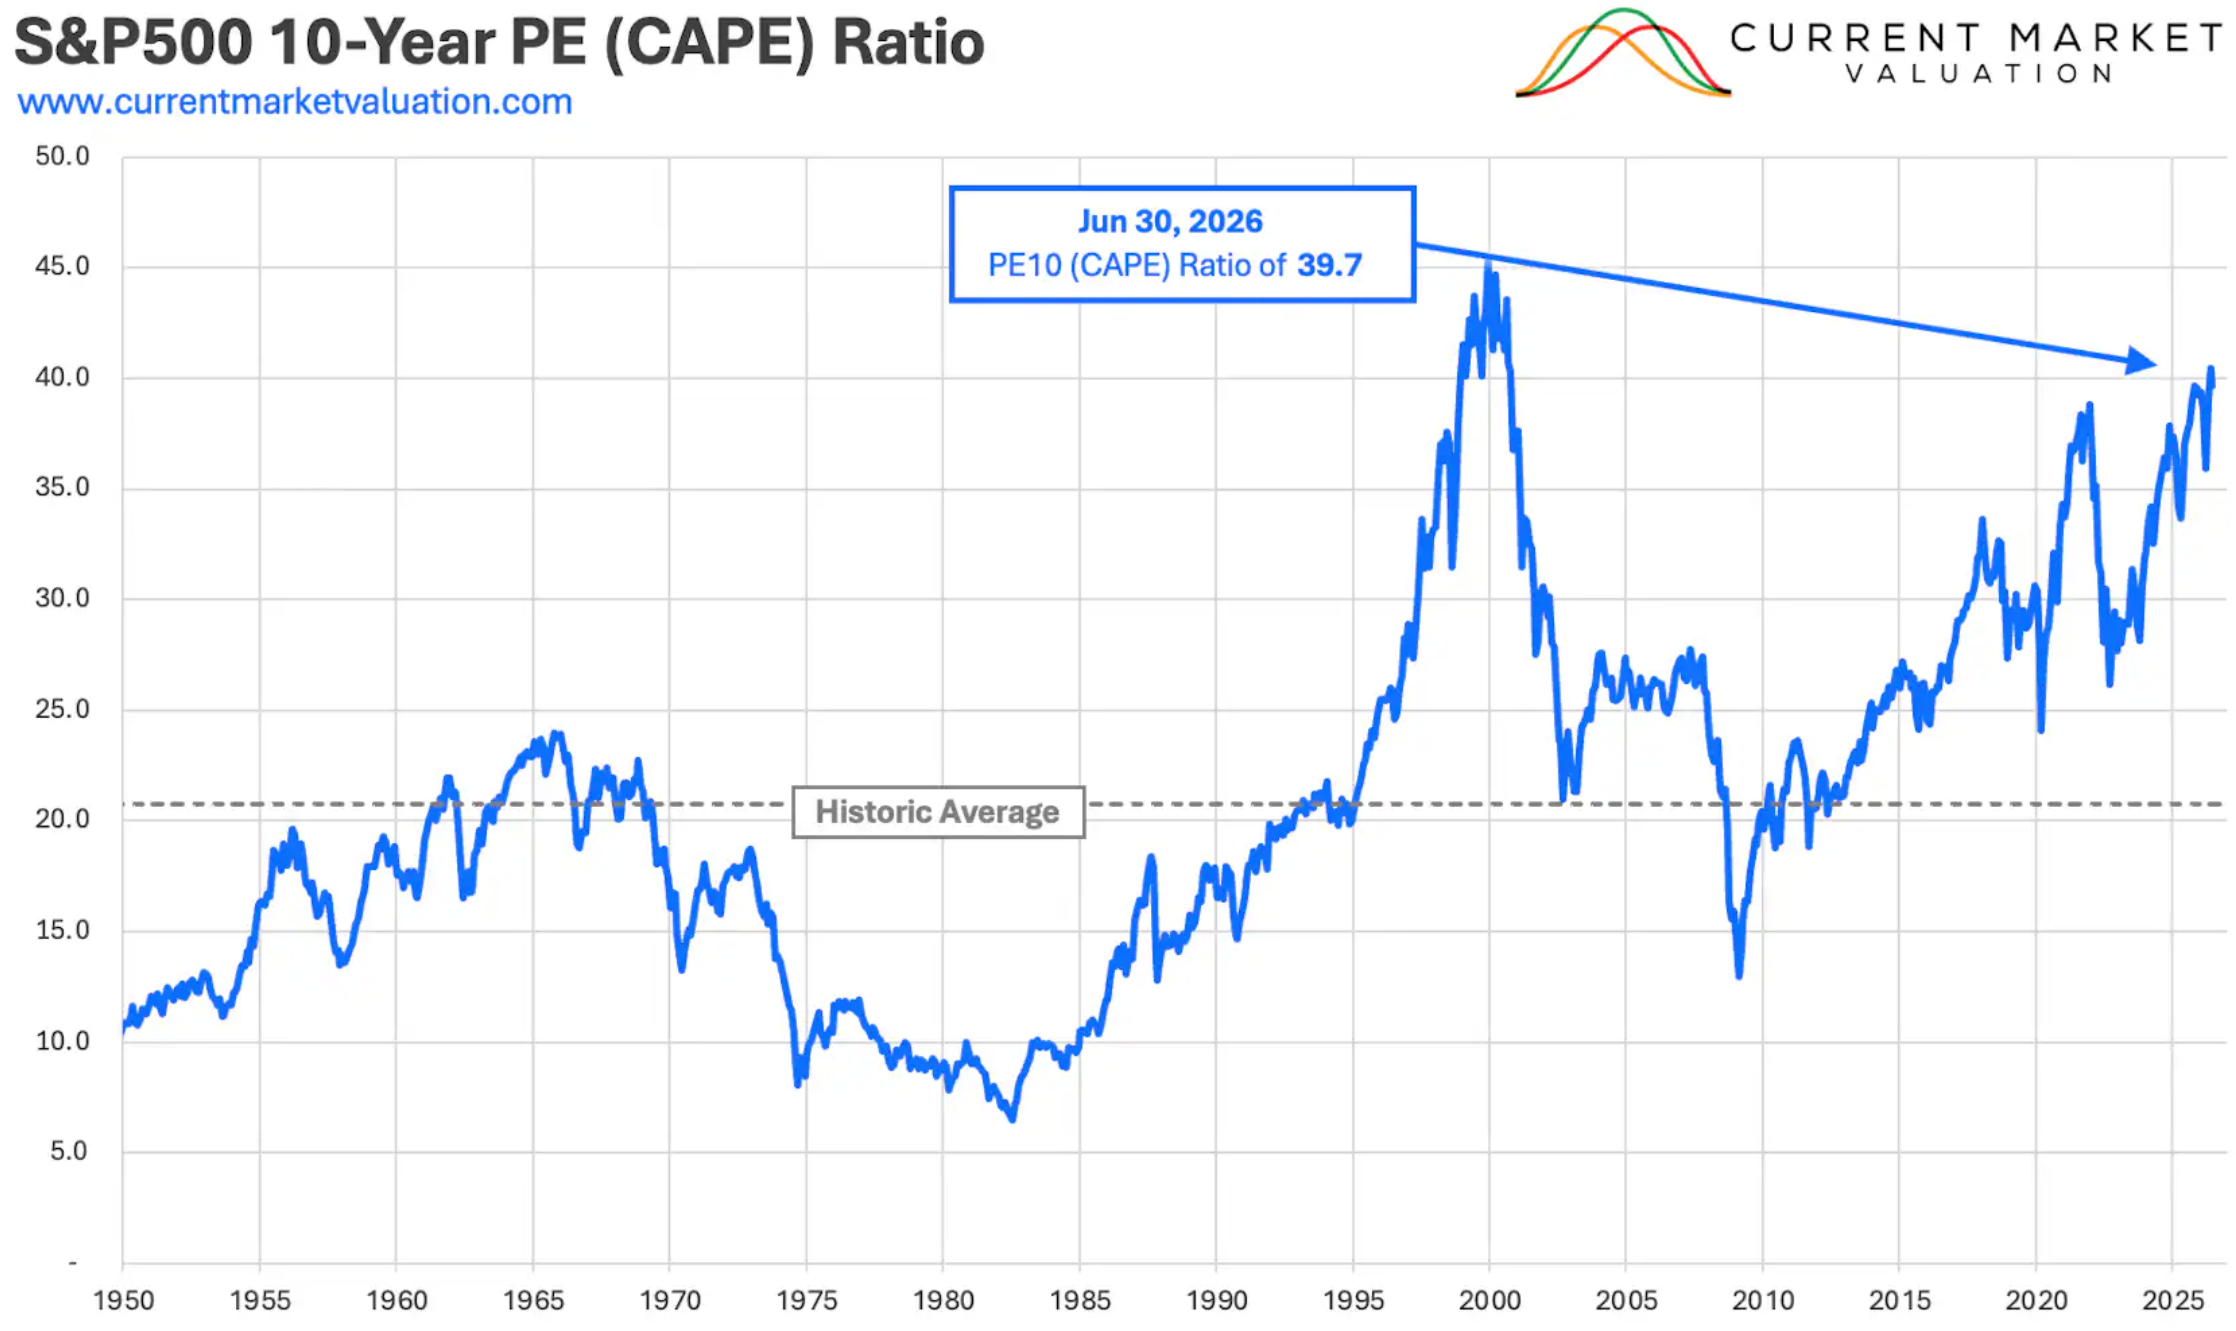
Shiller CAPE: The cyclically adjusted price-to-earnings ratio is also close to historic extremes. At around 40.6 in September 2026, it remains below its 2000 peak but far above most historical readings.
Buffett Indicator: The ratio of total U.S. stock-market capitalisation to GDP also remains at exceptionally elevated levels. Depending on the methodology used, current estimates vary, but the measure is substantially above its long-term historical norms.
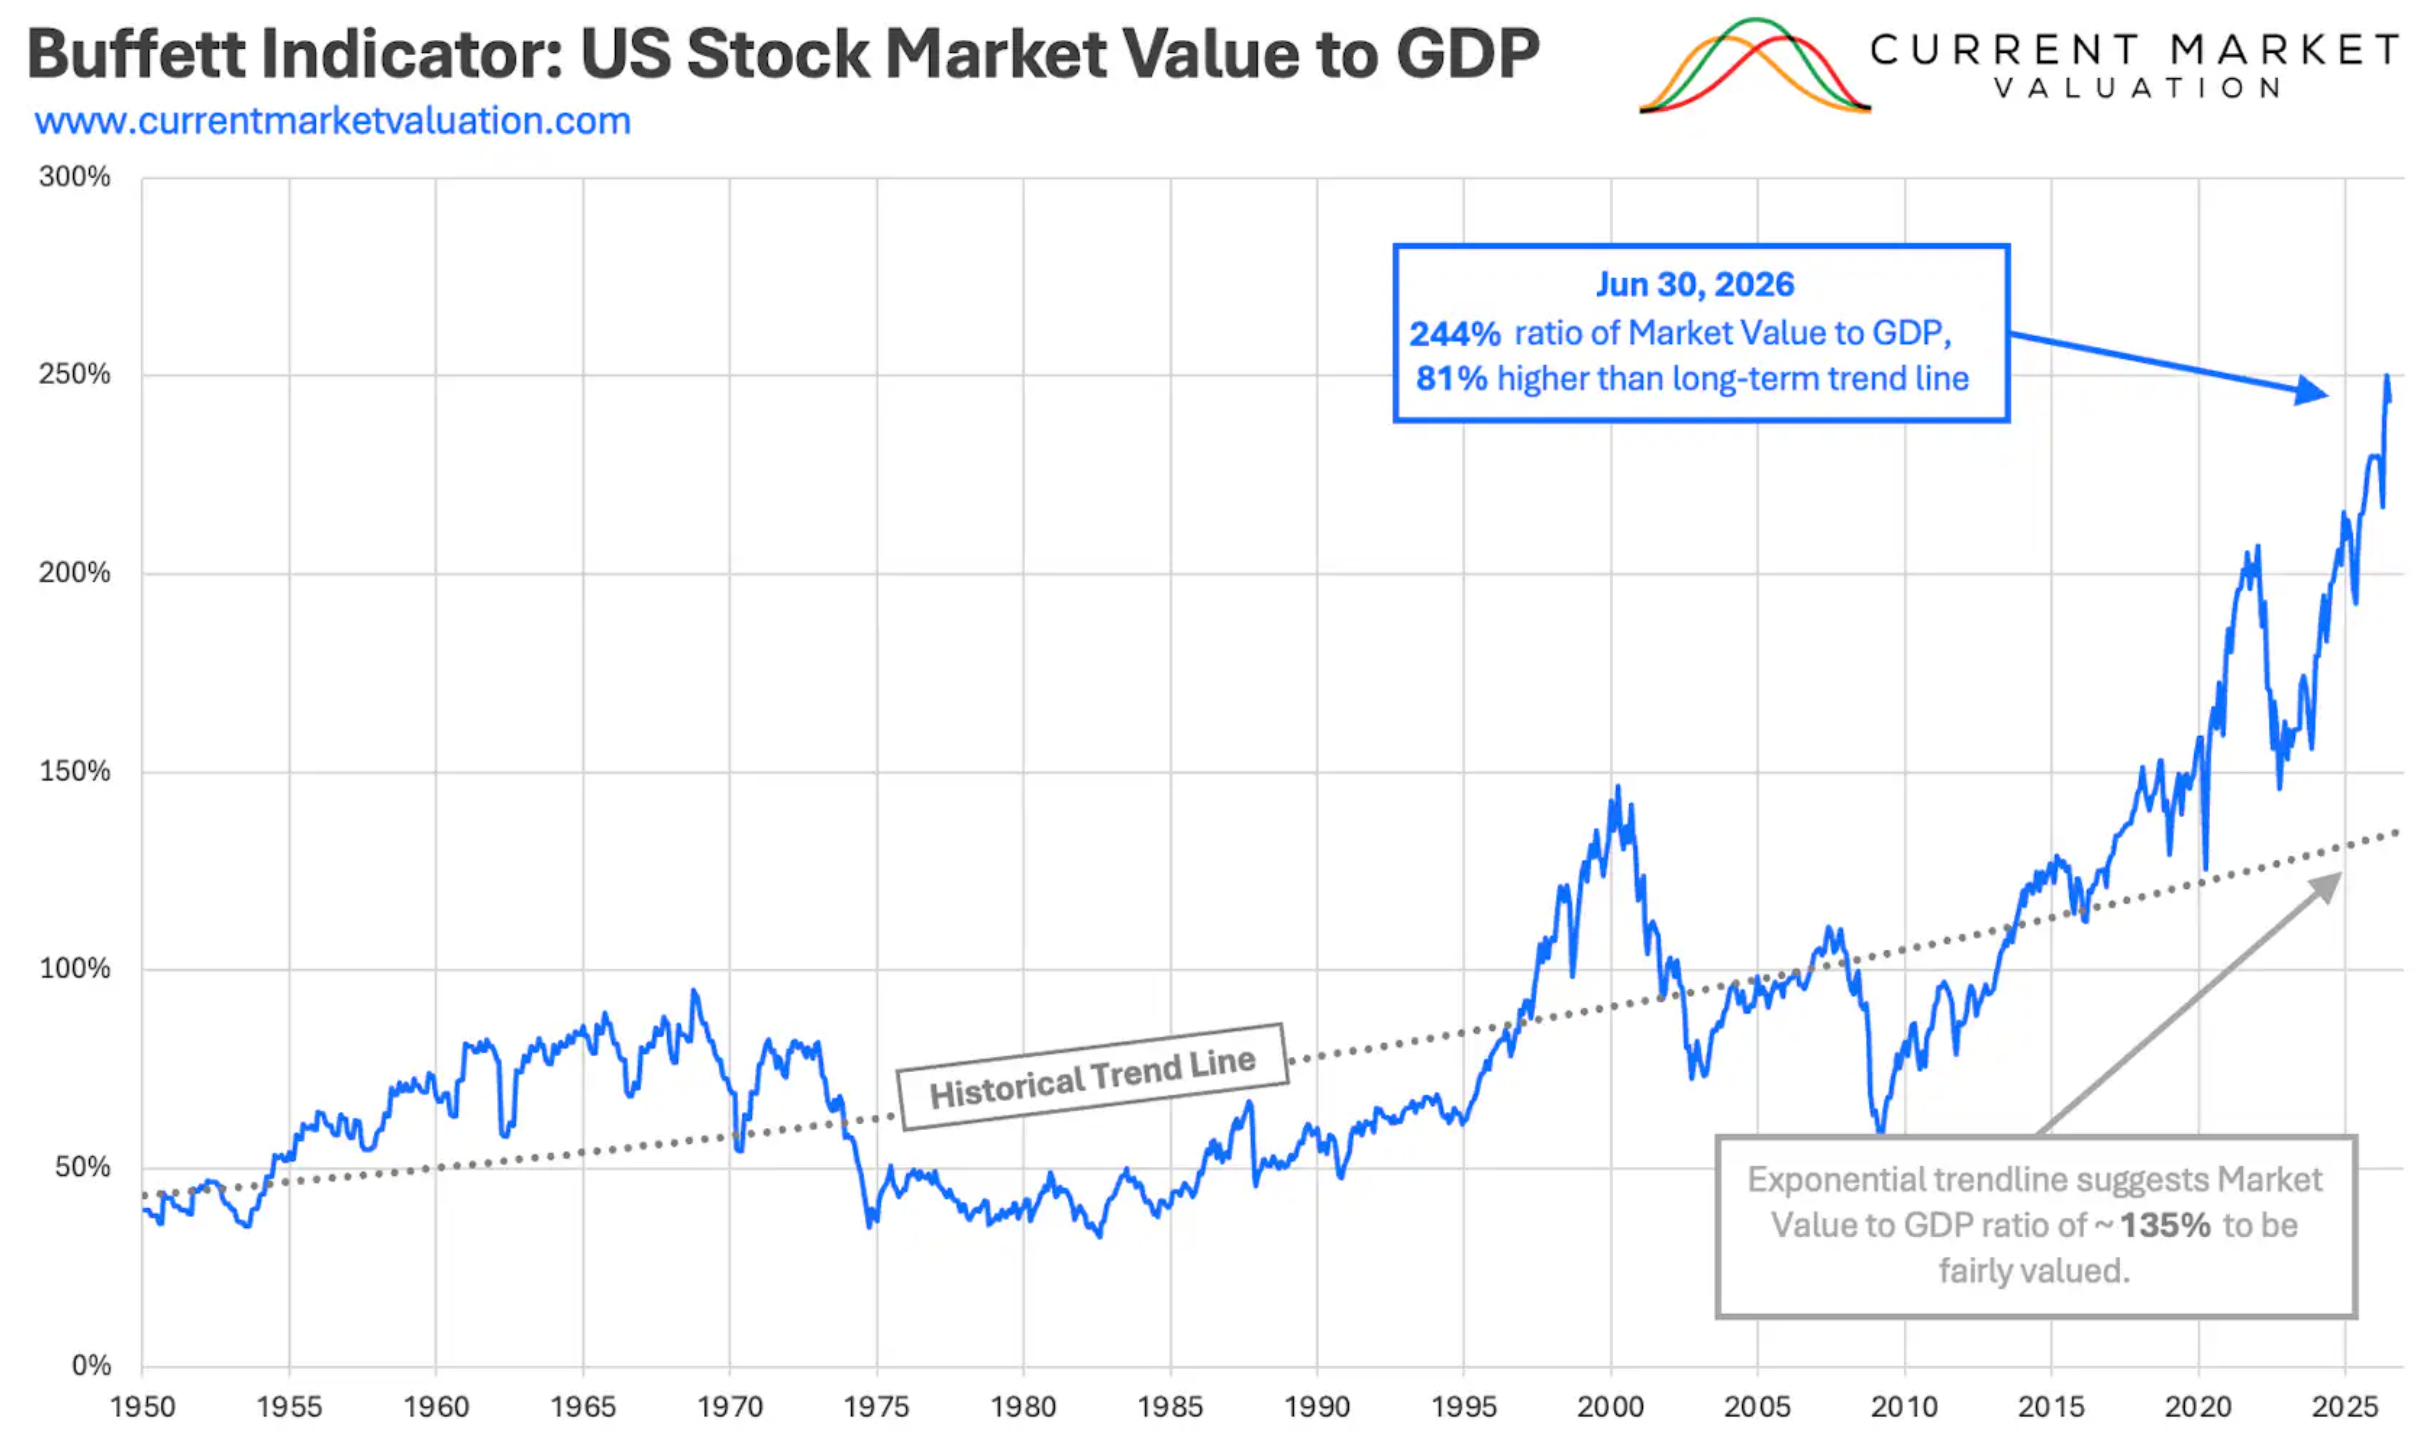
Three different approaches. Three different methodologies. Yet broadly the same message: U.S. equities are priced for a great deal of future success.
Internet Bubble vs AI Bubble
This is where the comparison with 2000 becomes particularly interesting. In 1999 and early 2000, the internet was going to transform the global economy. It did. The technology was real. The productivity gains were real. The companies that eventually emerged as long-term winners were real.
But investors paid extraordinary prices for that future success. The problem wasn’t necessarily the technology. It was the expectations embedded in the price.
Today, the story is artificial intelligence. AI could genuinely transform productivity. It could reshape industries, alter labour markets and create enormous economic value.
It may even exceed today’s expectations. But that doesn’t automatically make every AI-related investment attractive at today’s prices.
Markets don’t necessarily crash because a technological revolution fails. Sometimes they fall because the hope is way ahead of the reality. And the cravings become impossible to satisfy.
Investor Psychology Looks Uncomfortably Familiar
There is another similarity worth considering. Today’s market has been characterised by:
- Extreme optimism around AI.
- Fear of missing out on the next major technology winners.
- Heavy concentration in a relatively small number of mega-cap companies.
- Significant leverage across parts of the financial system.
- A persistent belief that policymakers will ultimately respond to major market stress.
The last point is particularly important. Since the 2008 Global Financial Crisis, investors have repeatedly experienced powerful policy responses to severe market declines. The 2008 Financial Crisis was followed by extraordinary monetary accommodation.
The 2020 Covid-19 Pandemic produced another enormous policy response. And subsequent market recoveries reinforced the idea that major drawdowns can ultimately become opportunities to buy.
These experiences can shape investor psychology. But there is a risk in assuming that every future correction will be met with the same policy response – or that such a response would necessarily produce the same result.
A Generation Shaped By Easy Money
There is another historical difference worth considering. A large proportion of today’s investment community has spent its career operating in an environment heavily influenced by falling interest rates, quantitative easing and abundant liquidity.
That does not mean today’s investors have never experienced a correction. They have. But the experience of the post-2008 era has repeatedly reinforced the importance of buying the dip.
The Federal Reserve cut rates aggressively during the 2008 Global Financial Crisis. It did so again during the 2020 Covid-19 Pandemic. Asset prices subsequently recovered and reached new highs.
That creates a powerful psychological feedback loop:
- Prices fall → policymakers respond → liquidity improves → prices recover → investors become more confident buying the next dip.
The danger comes when that pattern eventually stops repeating.
The S&P 500 Doesn’t Have To Crash…
Extreme valuations do not provide a precise market-timing signal. The S&P 500 can remain expensive for years. It can become even more expensive. And technological progress can continue to support corporate earnings. The market can also defy valuation models for considerably longer than investors expect.
That is why I don’t claim to know where the exact top will be. Nobody does. Instead, I am interested in the risk/reward. And that is becoming increasingly difficult to ignore.
When valuations are close to historic extremes, when liquidity-adjusted valuations resemble previous bubble peaks, and when investor enthusiasm is heavily concentrated around a transformational technology, the potential downside deserves considerably more attention.
The Bottom Line
The biggest mistake investors can make is assuming that because the underlying technology is real, the investment opportunity must also be attractive. That wasn’t true in 2000. And it won’t necessarily be true, either, in 2026.
The internet changed the world. But buying internet stocks at the peak of the Dot Com Bubble was still a terrible mistake for many investors. AI may change the world too. But do today’s prices already discount too much of that future success?
My M2-adjusted S&P 500 analysis suggests something particularly uncomfortable:
After accounting for the enormous expansion in U.S. liquidity, today’s equity market is trading at a valuation level comparable with the 2000 Dot Com peak.
That doesn’t mean the S&P 500 is about to crash. It doesn’t mean the AI boom is over. And it certainly doesn’t mean history will repeat itself exactly. But it does mean investors should be asking a different question. Not: “How much higher can the S&P 500 go?” But: “How much future success is already priced in?”
Because when expectations become extreme, the greatest risk isn’t necessarily that the story turns out to be wrong. It is that the story turns out to be right… but the price was already too high.