Key Insights:
- Ripple (XRP) price remains rooted within the $0.62 – $0.61 narrow range this week, while trading volume shrinks.
- On-chain data trends reveal that XRP struggles to attract market demand, largely due to the flat price action.
- The Bollinger Band technical indicator highlights the specific resistance zone that the bulls must clear to regain control of the market momentum.
Ripple (XRP) price continues to consolidate within the $0.62 – $0.61 narrow range this week, while rival top 20 ranking altcoins like Cardano (ADA) and Solana (SOL) have scored sizable gains.
On-chain analysis identifies a major driving factor behind the flat XRP price action, as well as the key resistance level that could trigger a major breakout in the days ahead.
XRP Trading Volume Has Declined by $150M Amid Price Downtrend
XRP price tumbled toward $0.61 on Tuesday, Dec 19, down 10 % from last week’s peak of $0.67. Meanwhile, rival megacap altcoins such as Avalanche (AVAX), Cardano (ADA) and Solana (SOL) have made sizable gains.
On-chain data trends have identified the rapid decline in XRP trading volume as a pivotal factor holding back it from joining the altcoin market rally.
According to Coinglass, XRP Daily Trading Volume has declined rapidly since the rejecting at the $0.68 range last week. The chart below illustrates that XRP trading volume has dropped $148.4 million, between Dec 9 and Dec 19.
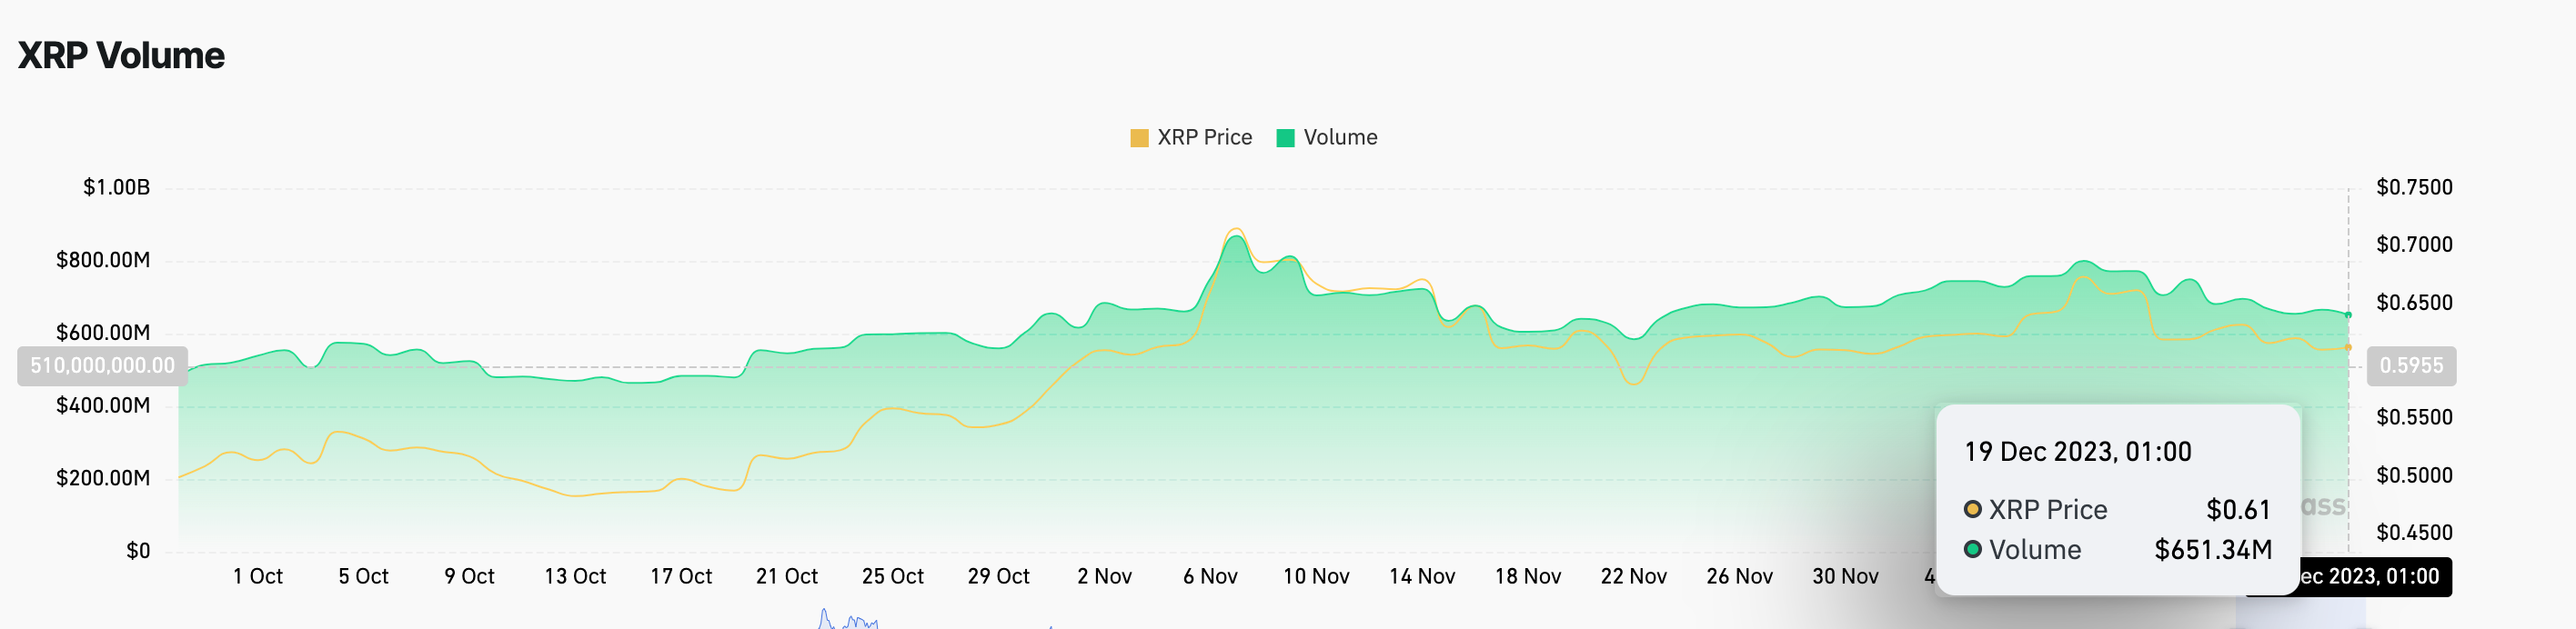
Trading Volume measures the dollar value of the total number of trades involving a particular cryptocurrency on a given day. Typically, it measures the degree of market demand and economic activity that the asset attracts.
When a trading volume for an asset declines during a broader altcoin market rally, it could be a signal that investors are over looking it for rival tokens with seeming better short-term profit prospects.
XRP Price Forecast: Will it Fall Below $0.60?
XRP price looks set to tumble below $0.60, given the current market dynamics. The price rebound prospects rests on heavily the other mega-cap altcoins retracing from their current euphoric peaks.
Without any significant bullish news event, the bears could force another downswing in below $0.60 in the days ahead.
In the daily timeframe, Bollinger Band technical indicators also confirms this bearish stance. Its currently shows that with XRP currently trading at $0.60, it now dipped below the middle-band (SMA) of $0.63.
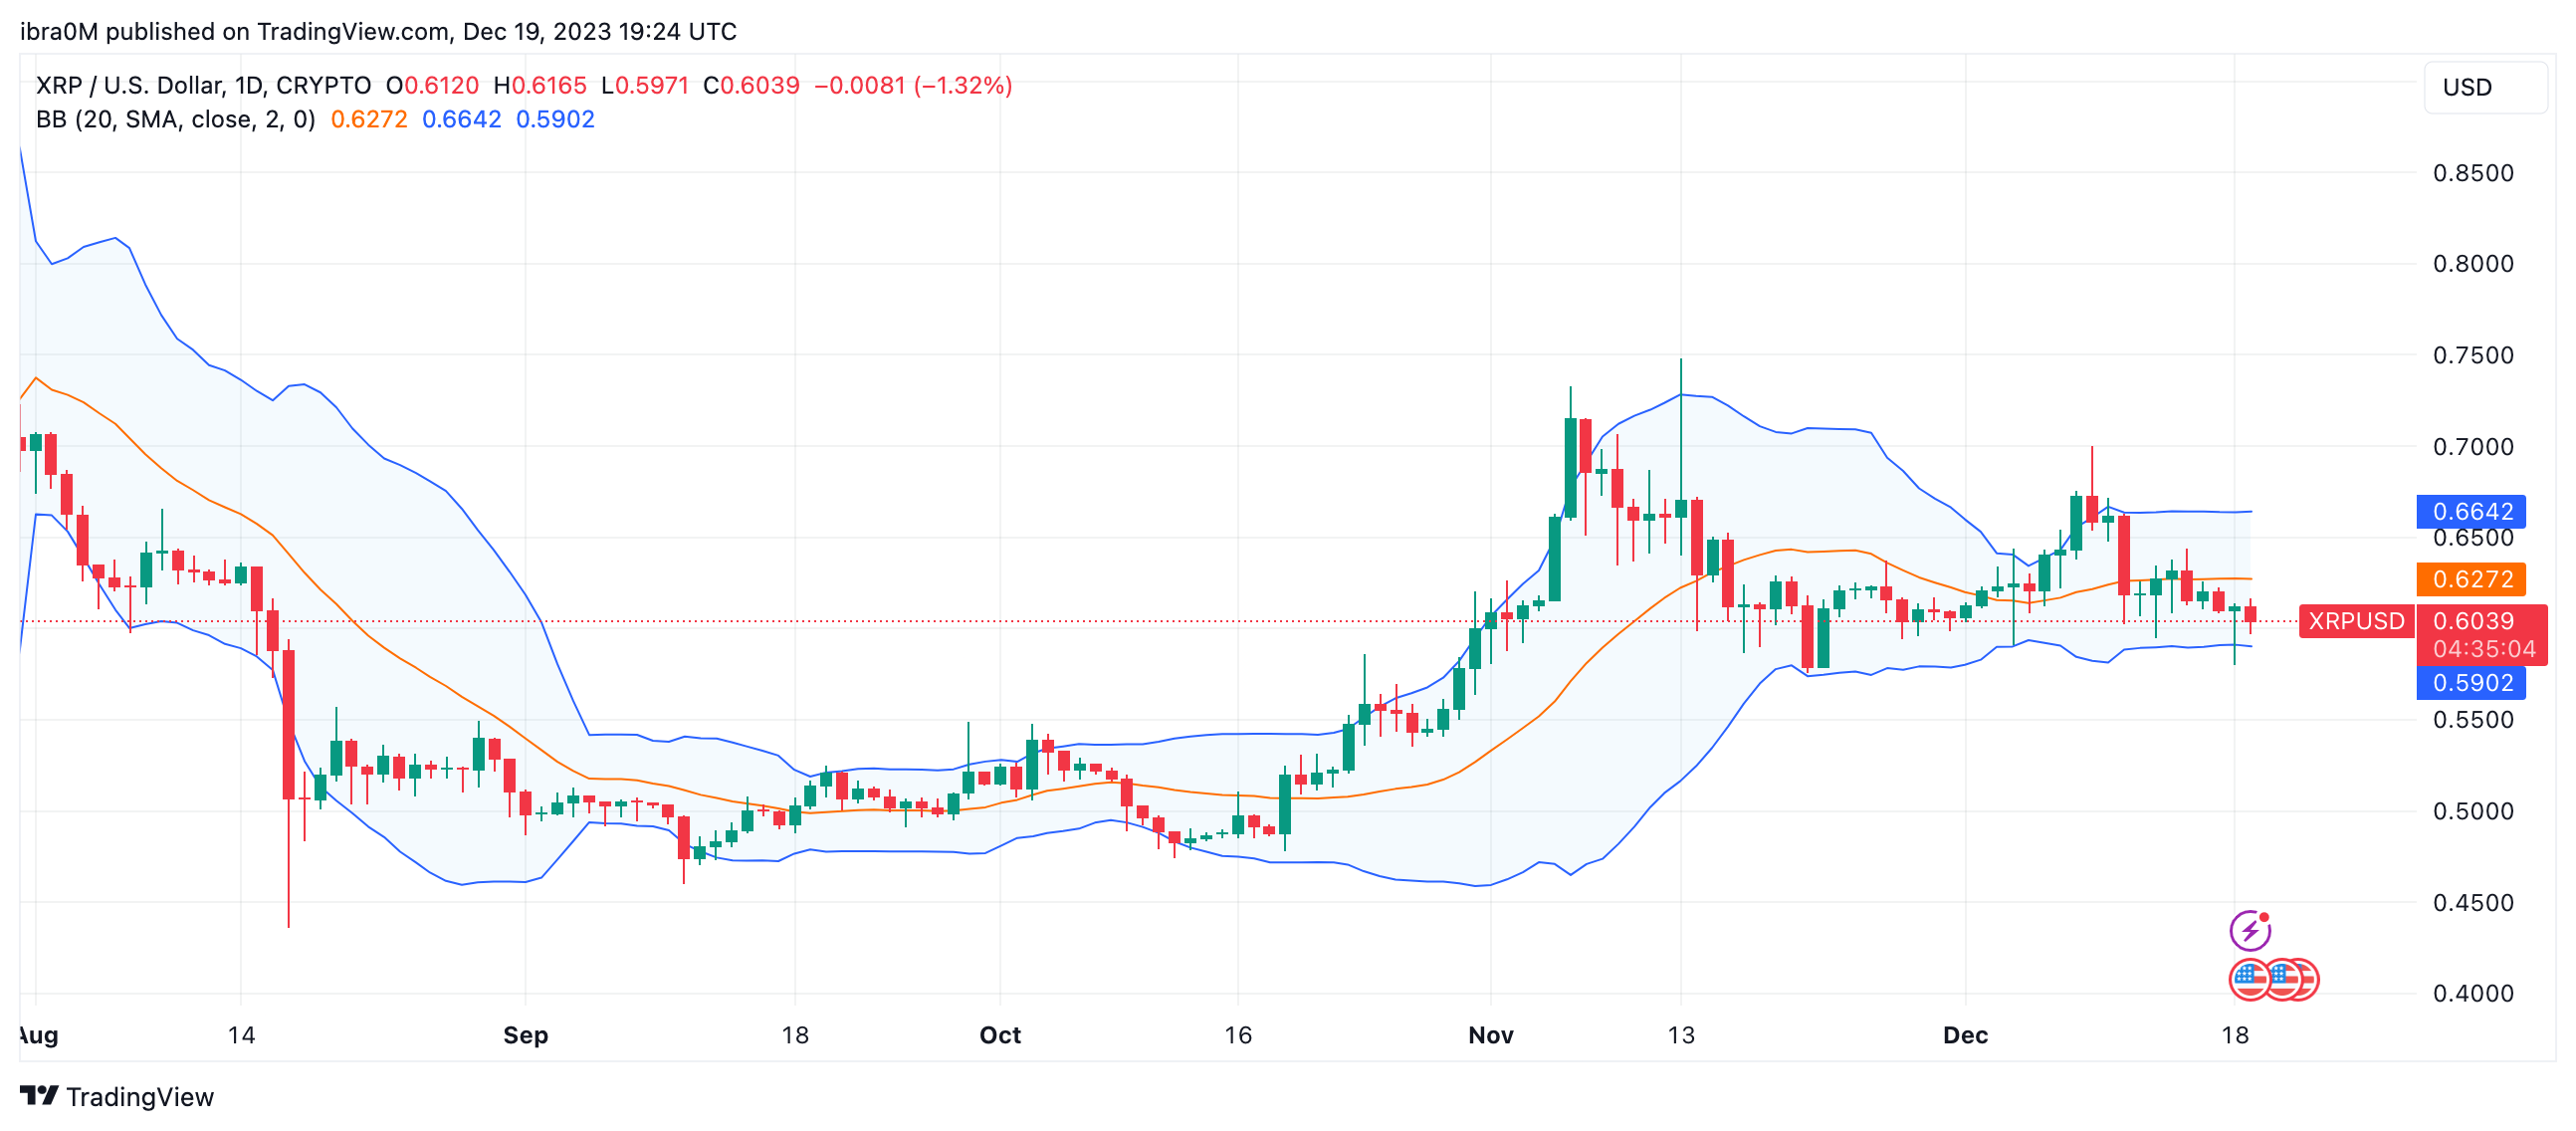
However, if the current XRP investors can hold their positions, the bulls can regroup at the lower bollinger band around $0.59. Failure to trigger a rebound from the $0.59 support level could open the door to further XRP price downswing.
Conversely, for the momentum to flip bullish, the XRP bulls will have to reclaim the $0.67 territory.