


Two weeks ago, I wrote that silver was likely to move toward $42–$44. Today, it’s less than $2 above that range.
At the moment of writing these words, December silver futures trade near $45.50, after moving down to $45.050, their lowest level since September 19, 2025. December copper futures fell to $5.6880, their lowest level since March 31, and gold futures are below $3,800. The USD Index moved up to its highest level since April 2025, as the Fed’s rate hikes come closer.
Silver is falling faster than gold, and there’s a clear reason for it. Silver is both a monetary metal and an industrial one, and right now, both of its sides are under pressure.
Silver Approaches My November Target
On November 4, when silver traded near $52, I wrote: “in my view, the current rebound is likely to fade, and silver is likely to move toward $42-$44.” The rebound faded, and since then, silver has declined by about 12 percent.
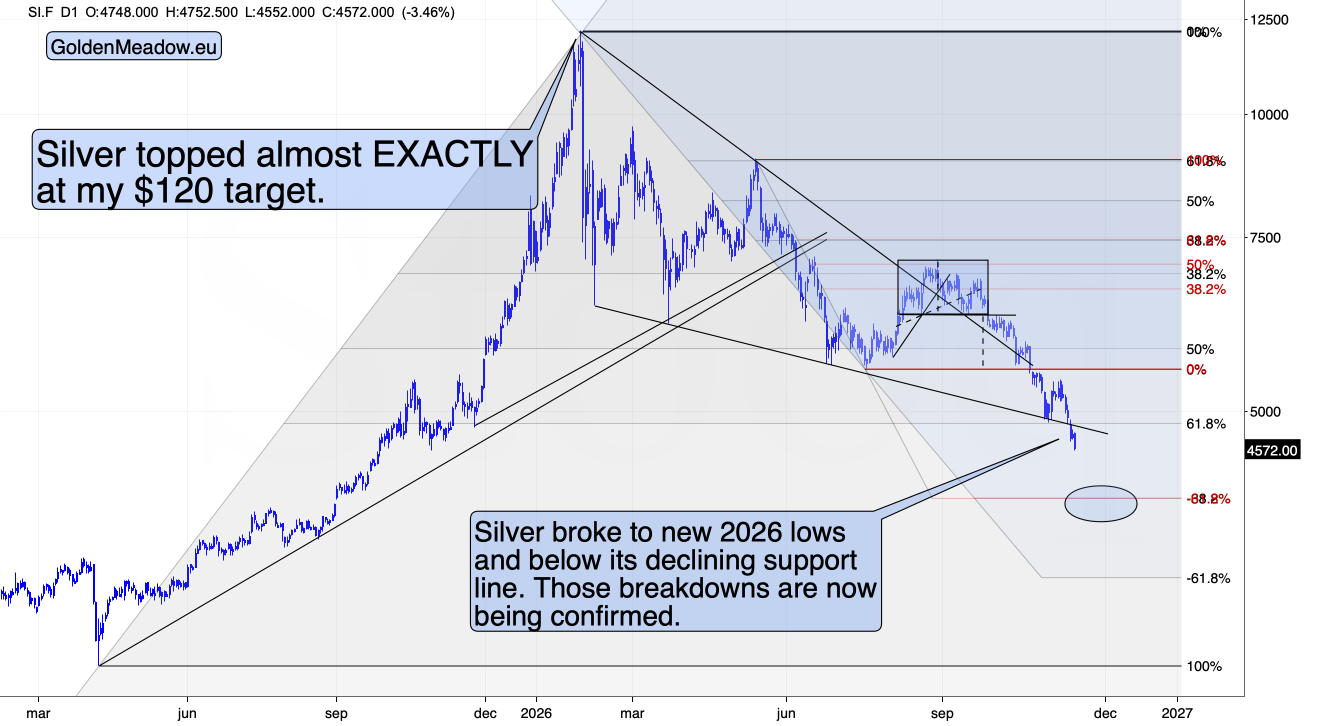
Silver broke to new 2026 lows and below its declining support line, and those breakdowns are now being confirmed. Since November 9, the day before the hot October inflation report, silver has fallen by about 14 percent, while gold has fallen by about 8 percent.
The gold-to-silver ratio shows the same thing. It rose from about 78 on November 9 to about 83 this morning, its highest level since November 2025. In declines, silver tends to fall faster than gold, and the ratio rises. At real bottoms, it’s the other way around: silver and the miners lead gold higher. We’re not seeing this yet.
The first part of silver’s weakness comes from its monetary side.
Silver Price Forecast
Every new Silver analysis as it publishes, today's technical signal and key levels, live price — on one page.
See all Silver forecastsThe Dollar Keeps Rising
On November 11, when the USD Index futures traded slightly above 102.4, I wrote: “It looks like the USD Index is ready to move to new yearly highs.” This morning, they moved up to 103.830, a new 2026 high, and the cash USD Index rose to 103.91, its highest level since April 2, 2025.
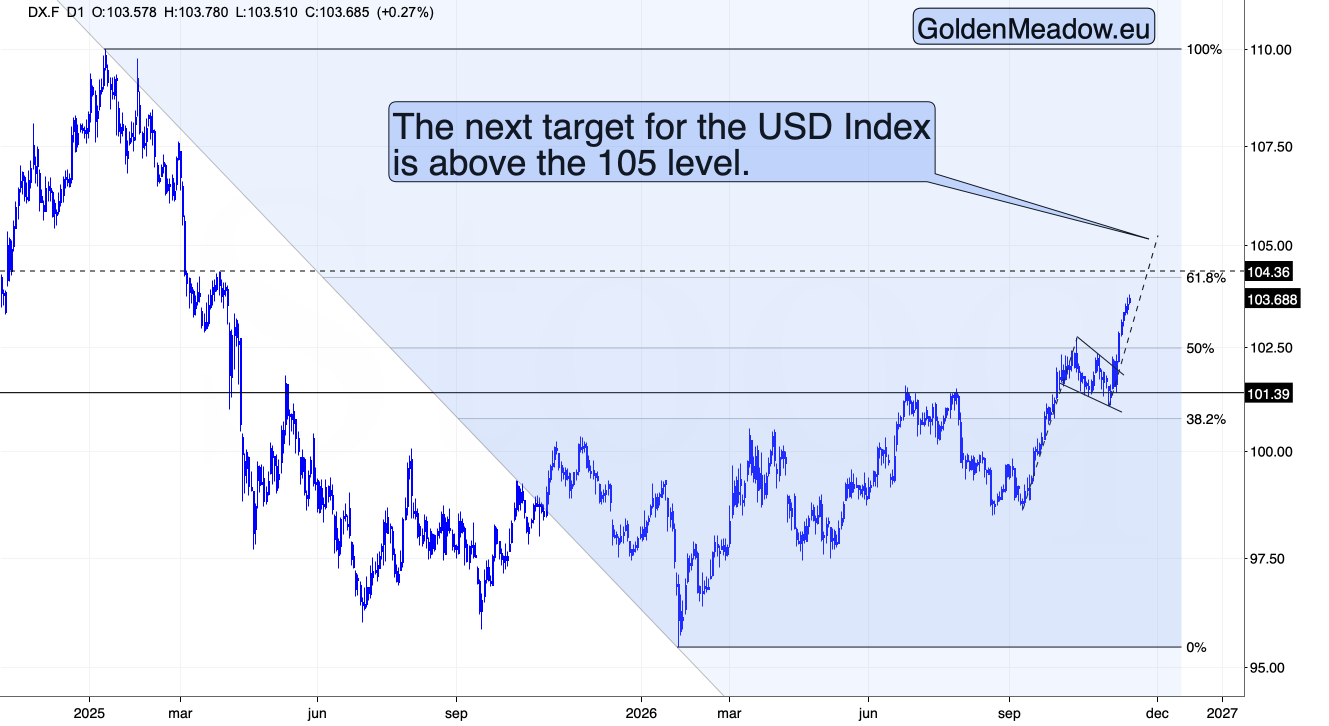
In my view, the next target for the USD Index is above 105, which is bearish for silver and the rest of the precious metals sector.
Rates are the driver. On Tuesday, St. Louis Fed President Alberto Musalem said that 100 to 150 basis points of hikes might be needed by spring 2027, and the fed funds futures now price more than a full 25-basis-point hike on December 9. Silver pays no interest, so when the return on bonds rises, holding it gets more costly, and higher real interest rates also tend to lift the dollar. Silver is priced in dollars, so a stronger dollar makes it more expensive for buyers who pay in other currencies.
That’s the monetary side. The industrial side is weakening too, and copper shows it best.
Copper Shows Silver’s Industrial Side
Industry is the biggest source of silver demand. In 2025, it used 657.4 million ounces of silver, almost 60 percent of the total, according to the Silver Institute. Much of that silver goes into electronics and solar panels, the same kind of electrical uses that drive copper demand. So when copper falls on worries about demand, silver’s industrial side feels it too.
This morning, December copper futures fell to $5.6880, their lowest level since March 31, as the dollar rose and investors questioned the pace of AI data-center investment. Copper is now about 16 percent below its October 14 high.
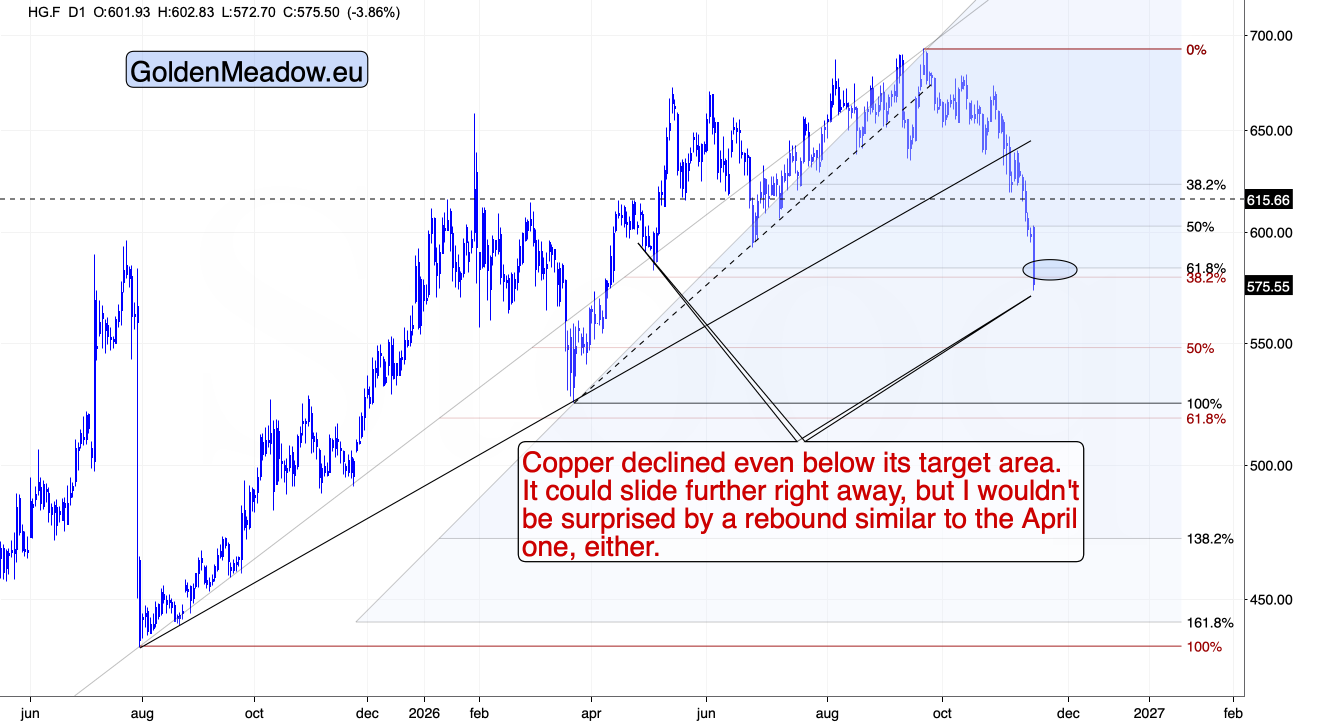
Copper declined even below its target area. It might slide further right away, but after such a sharp decline, a rebound similar to the April one wouldn’t surprise me either.
The copper producers are falling with it.
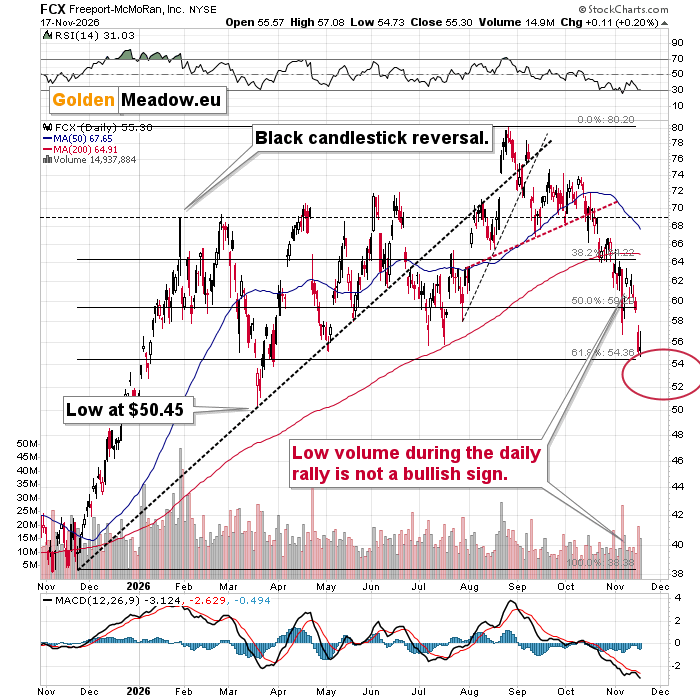
FCX’s stock price keeps falling with copper. On September 2, I wrote: “This convinces me that getting back on the short side of the FCX trade when it was above $75 was indeed a good idea.” In pre-market trading, FCX is near $52.80, about 30 percent below $75.
Crude oil is the other big part of the industrial picture, and it also feeds into inflation, so it matters for both sides of silver.
Why Oil Matters for Silver: A Subscriber’s Question
Oil affects silver in two ways. Higher oil prices add to inflation, which pushes the Fed toward more hikes and hits silver’s monetary side. Lower oil prices, when they come from weaker demand, point to a slower economy, which hits silver’s industrial side. That’s why a question from one of my Gold Trading Alerts subscribers matters for silver investors too.
The subscriber asked in the comments how to reconcile oil’s fundamentals with its technicals. The International Energy Agency expects a supply surplus, while my oil chart points to a triangle-vertex-based reversal in late November, possibly at higher prices. It’s a good question, and I’m happy to answer it here as well.
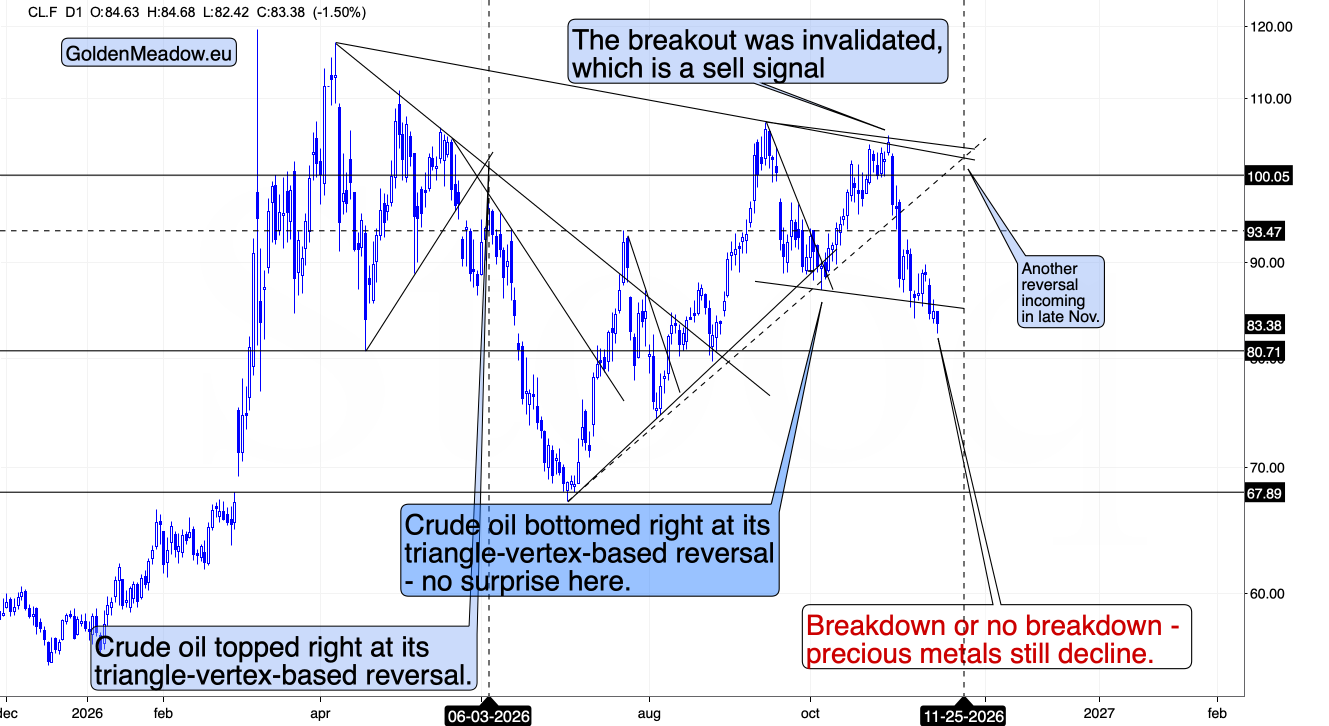
The triangle-vertex-based reversals tell me when a turning point is likely, not in which direction it will be. The direction depends on the move that comes before it. On October 7, when WTI traded near $89.50, I wrote: “Today, it is declining into one, which means the reversal has bullish implications for crude oil.” Within about three weeks, December WTI futures rallied from below $88 to almost $105.
The next reversal is due around November 25, and so far, the price of oil is declining into it. This morning, January WTI futures moved down to $82.38, their lowest level since September 4. If this continues, the reversal would more likely mark a short-term bottom. A rebound from there wouldn’t contradict the IEA’s surplus forecast, which points lower in the medium term. The fundamentals tell me more about the medium-term direction, and the technicals help with the timing.
For silver, both paths lead to the same place. If oil rebounds, it adds to inflation worries and to the case for more Fed hikes, which supports the dollar and hurts silver’s monetary side. If oil breaks lower instead, it confirms that demand is weakening, which is bearish for industrial metals, silver included. Breakdown or no breakdown in crude oil, the precious metals still decline.
Even the war headlines don’t change this. They affect the precious metals mostly through oil (more on Iran and gold in our explanations), and overnight, neither oil nor silver rallied on new drone attacks on Bahrain and Kuwait.
Related guide: What Really Drives Gold, Silver, and Precious Metals Prices: A Comprehensive Guide
Where This Leaves Us
Both sides of silver are under pressure. The rising dollar and the Fed’s hawks weigh on its monetary side, and the slide in copper and the falling oil price weigh on its industrial side. Silver is close to my November target area, the gold-to-silver ratio is at its highest level since November 2025, and in my view, gold is likely to decline toward about $3,500.
Silver has two sides, and right now, both of them point lower.
In today’s Gold Trading Alert, I also covered the mining stocks, why Nvidia’s strong results barely moved stocks, the VIX, and what I plan to do with the FCX position.
Important note: the forecasts are up-to-date at the moment of their publication; we don’t guarantee updating them for free readers. We will, however, keep our premium subscribers updated at all times.
Thank you for reading today’s analysis – I appreciate that you took the time to dig deeper and that you read the entire piece. If you’d like to get more (and extra details not available to 99% of investors), I invite you to stay updated with our free analyses – sign up for our free gold newsletter now.
Thank you.
Sincerely,
Przemysław K. Radomski, CFA
This article is for information only and is not investment advice. Trading CFDs, forex, stocks and cryptocurrencies carries a high risk of losing money; past performance is no guide to future results.