


Silver (XAG) price gained 5.72% last week despite the strong rally in the US dollar due to strong jobs data. The jobs report increased the possibility of rate hike in December. This lifted the US dollar index near 102.30. The market is now watching for the US CPI data which may set the tone for silver’s next move.
Strong US Jobs Report Fuels December Rate Hike Bets
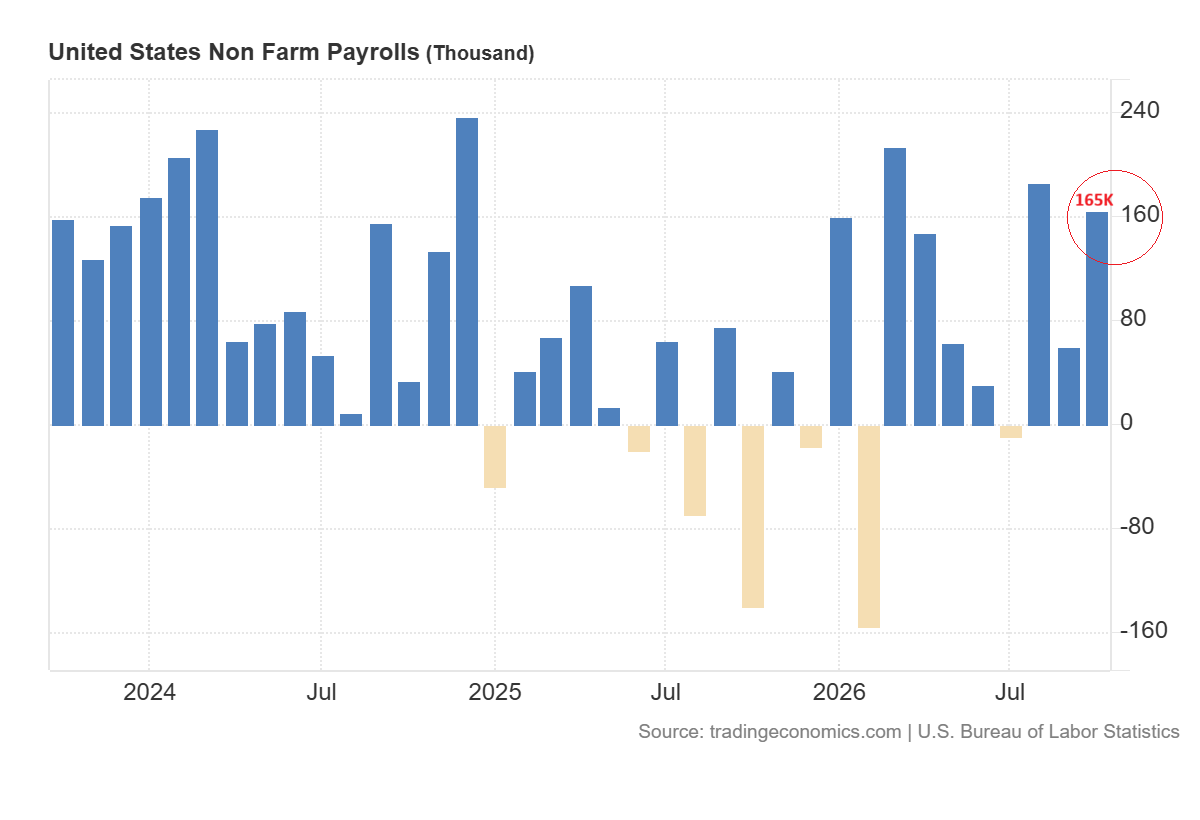
The BLS reported strong US jobs data for October, which increased expectations of a rate hike in December. The chart below shows that the labor market added 165,000 jobs in October which is up sharply from 60,000 in September.
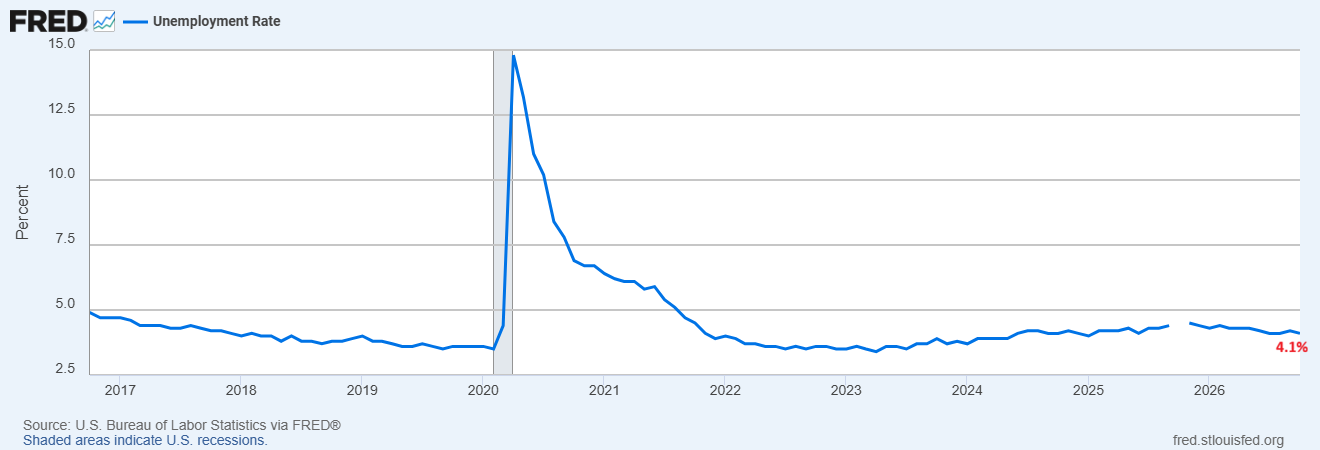
The unemployment rate dropped to 4.1% from 4.2%. The combination of strong hiring and lower unemployment suggests that Fed may have more room to focus on inflation.
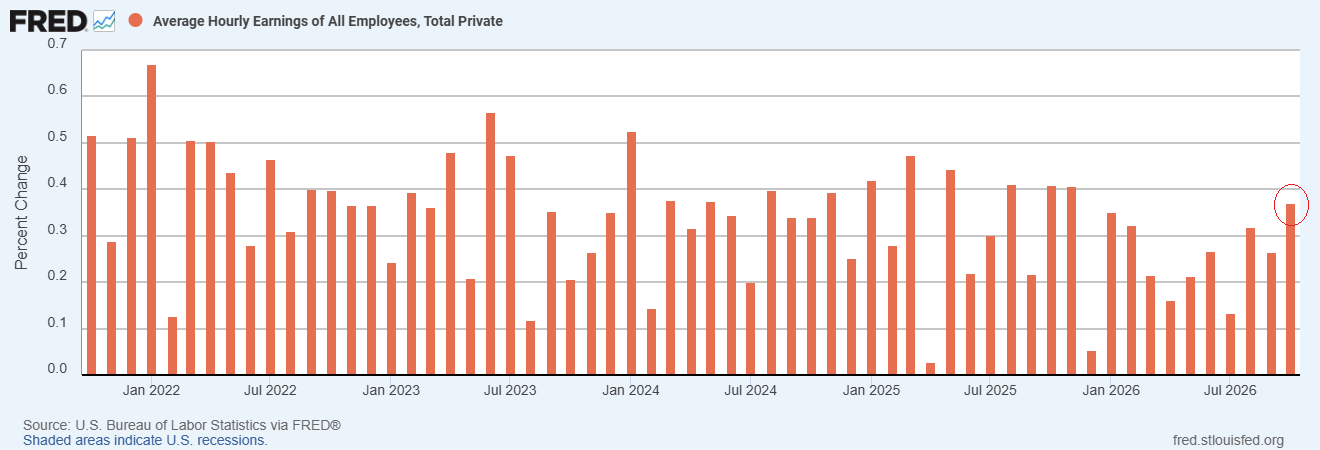
The average hourly earnings increased by 0.4% in October.
After the release of the US jobs data, the odds of rate hike in December increased to around 80%. These expectations for high interest rates pushed US dollar index to 102.30 on Friday and the two-year Treasury yield to 4.51%. The strong US dollar kept pressure on silver prices.
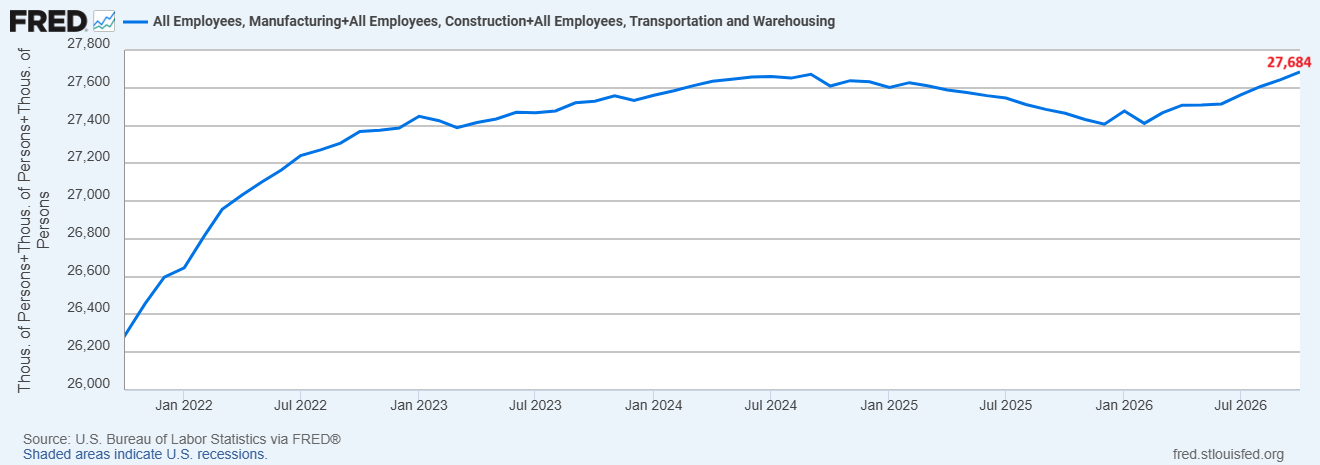
Employment in manufacturing, construction, transportation and warehousing increased to 27.68 million in October as shown in the chart below. Manufacturers added 19,000 jobs. This includes 7,000 in computer and electronic products. The pickup in electronics hiring suggests that the activity remains strong which may be supportive for silver.
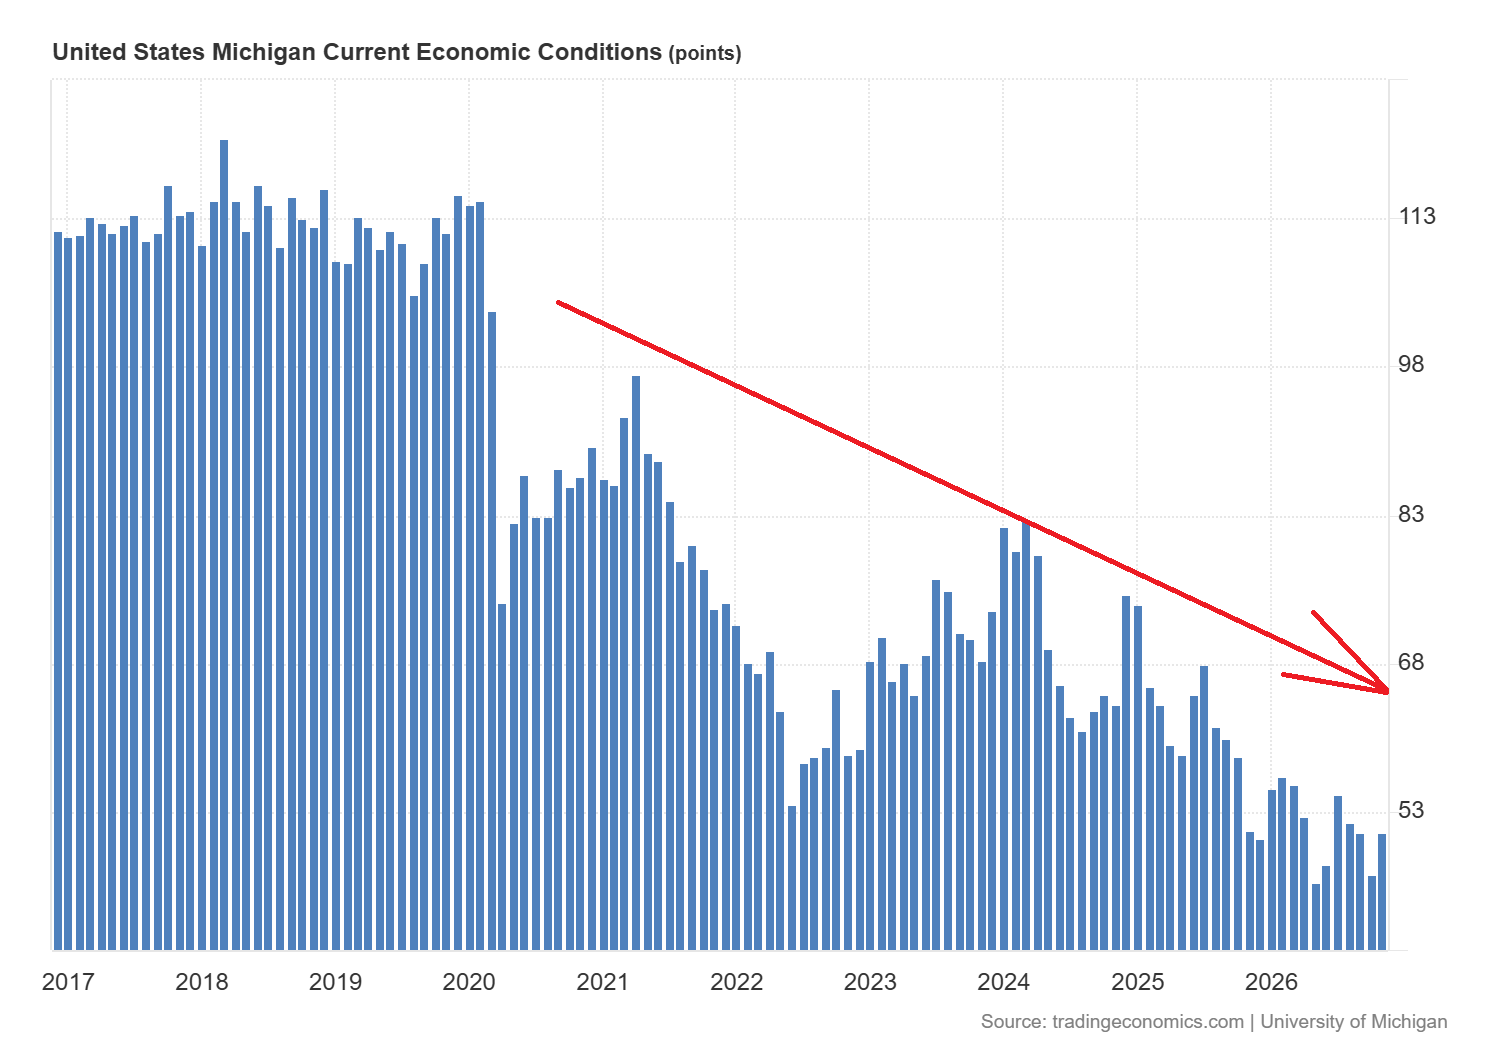
The preliminary November survey by University of Michigan shows that the Current Economic Conditions Index increased to 51.0 but the index remains near historical lows.
Silver edged higher on Friday and closed near $51.90 despite the strong rally in the US dollar. The market is now waiting for the US CPI data which will be released on Tuesday. If the inflation data is strong, the US dollar and Treasury yields will likely continue to rise and limit the rallies in silver prices. But a soft reading may ease bets on rate hike and give silver some room to extend the rebound.
Silver Price Forecast
Every new Silver analysis as it publishes, today's technical signal and key levels, live price — on one page.
See all Silver forecastsUS Dollar Index Eyes 104 on a Break Above 102.80
The strong US jobs data pushed the US dollar higher and closed the week above 200-week SMA. The weekly candle suggests that the US dollar index faces upward pressure in the short term.
The weekly chart for the US dollar shows strong bottoming process from April 2025 to September 2026. The breakout above 100.50 pushed the index to a high of 102.945 in October 2026. But the index has consolidated over the past four weeks and formed a low near strong support at 101.
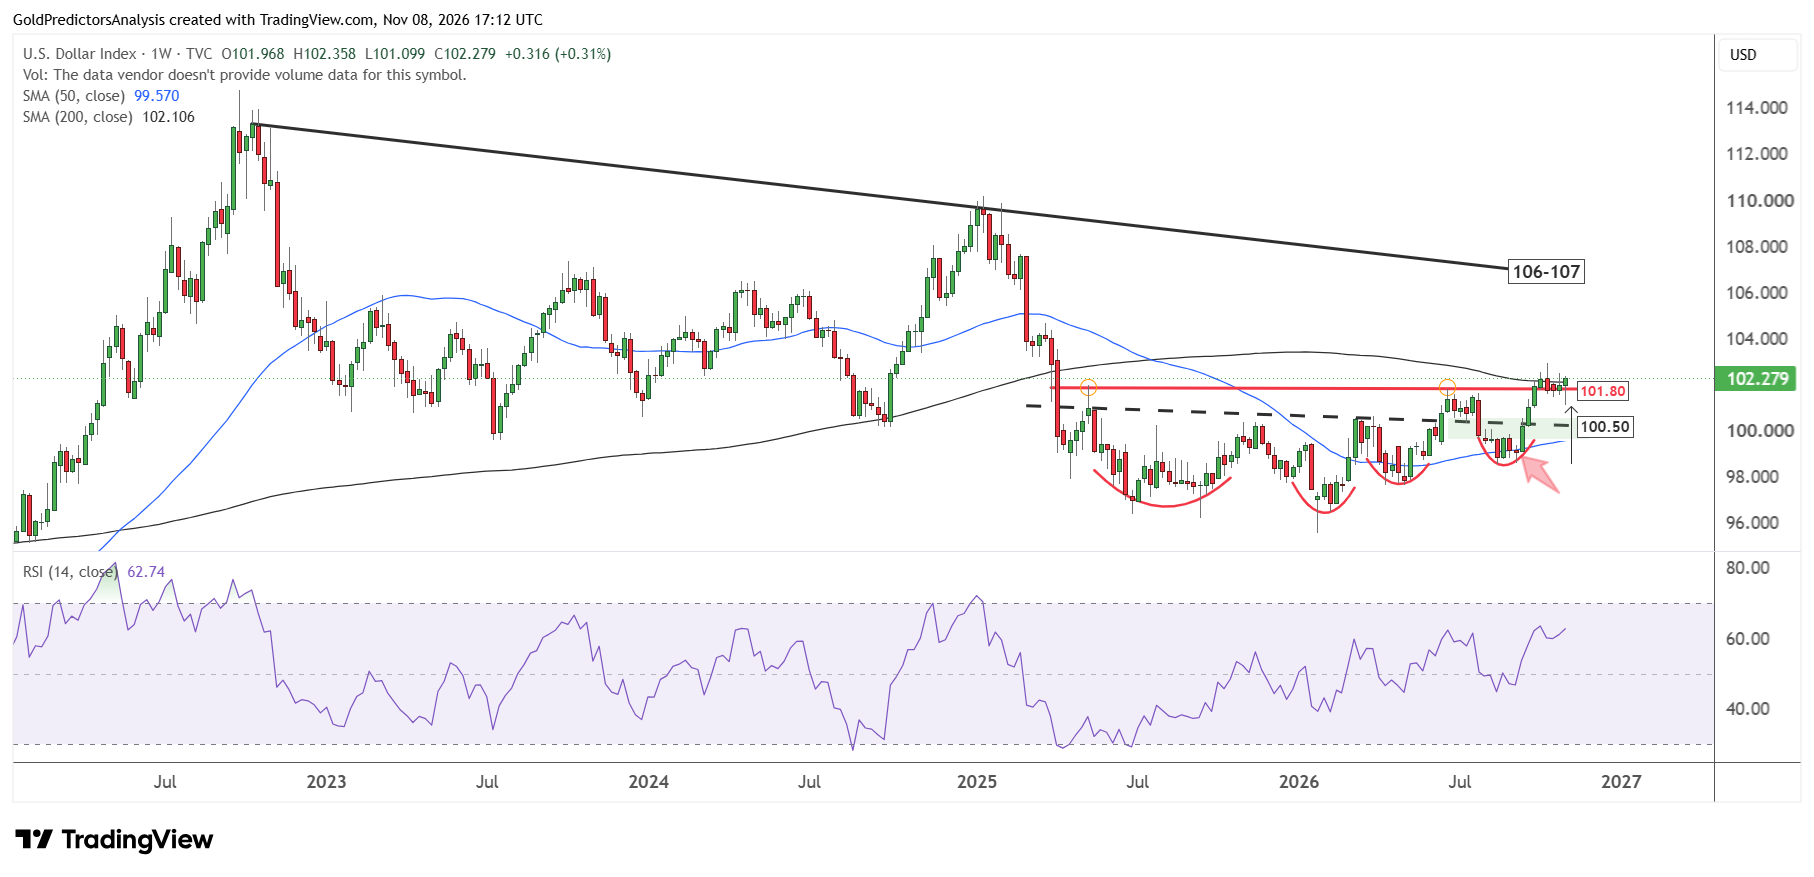
The weekly candle closed above 101.80 which suggests a positive move. If the US dollar index continues to rally above 102.80, it may move toward the 104 level. A break above 104 will likely open the way for further upside toward the 106-107 range. The descending trend line from the highs of October 2022 defines this target. The RSI also remains above the midline which supports a positive trend.
The daily chart for the US dollar index shows the formation of V-shaped pattern in January 2026. Then the index formed double bottom in April and May 2026 and another double bottom in August and September 2026. These patterns point to constructive price action in the short term.
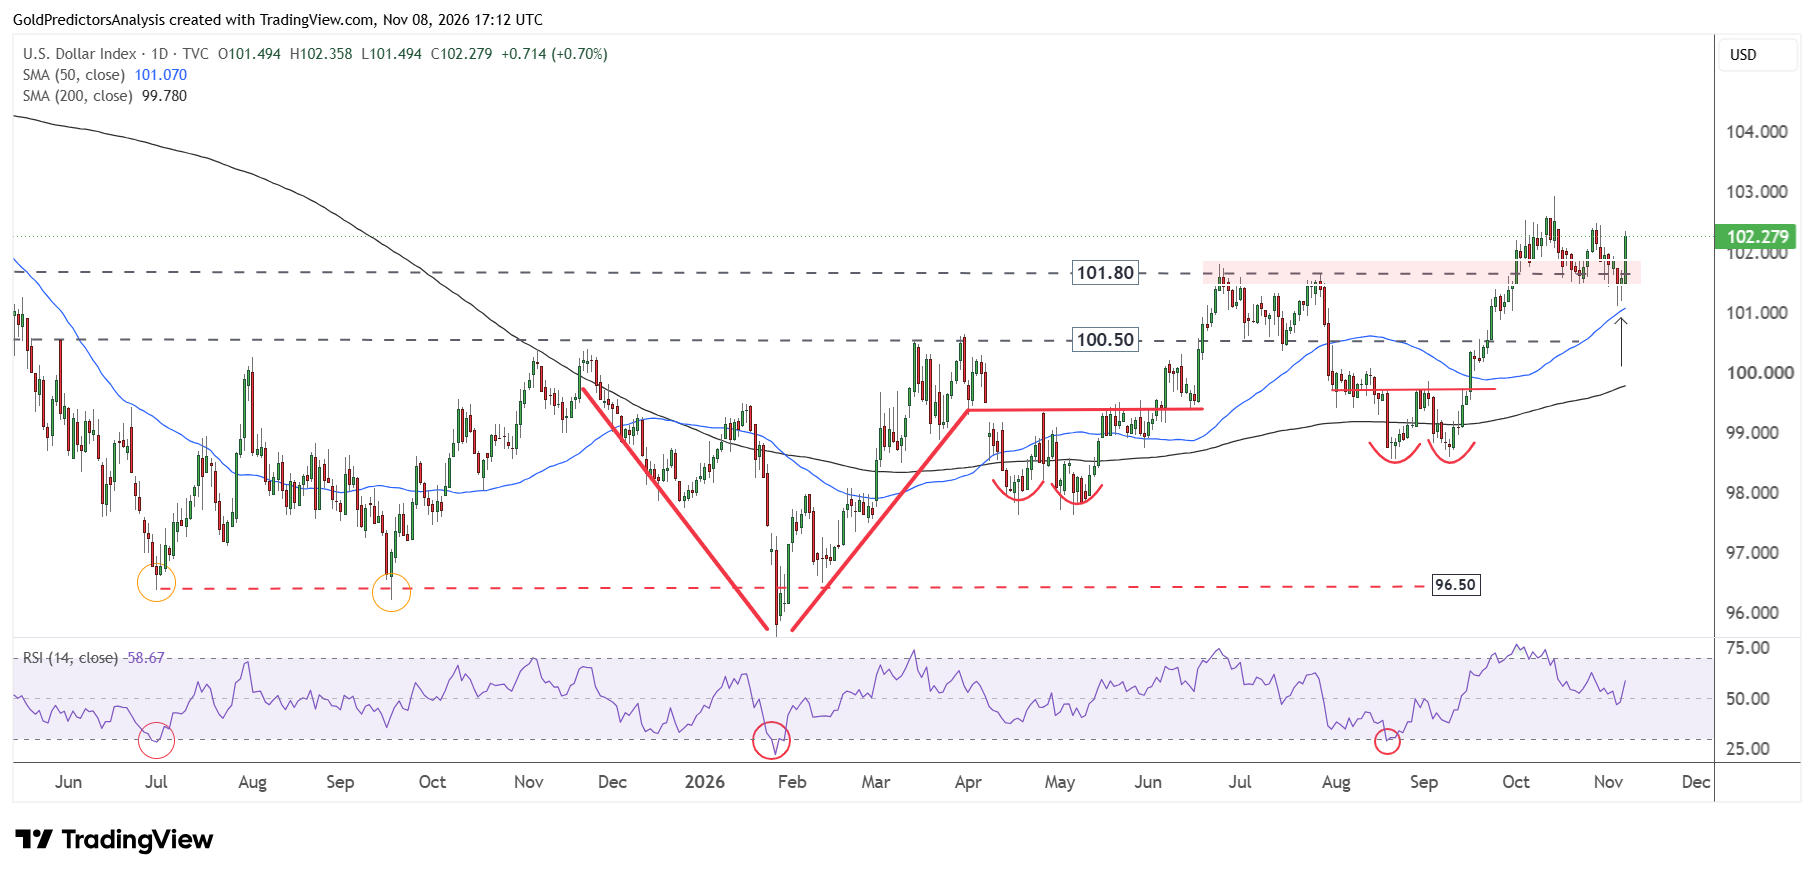
The US dollar index consolidated around the support of 101.30 and then gained about 0.70% on Friday. A break above 102.80 will likely open the way for further upside towards 104. The RSI is also rebounding from midline as the index rebounds from support at 101.30. This strength in US dollar index suggests that the rallies in the silver price may be limited in the short term.
Silver Rebounds From the $48–$50 Support Zone
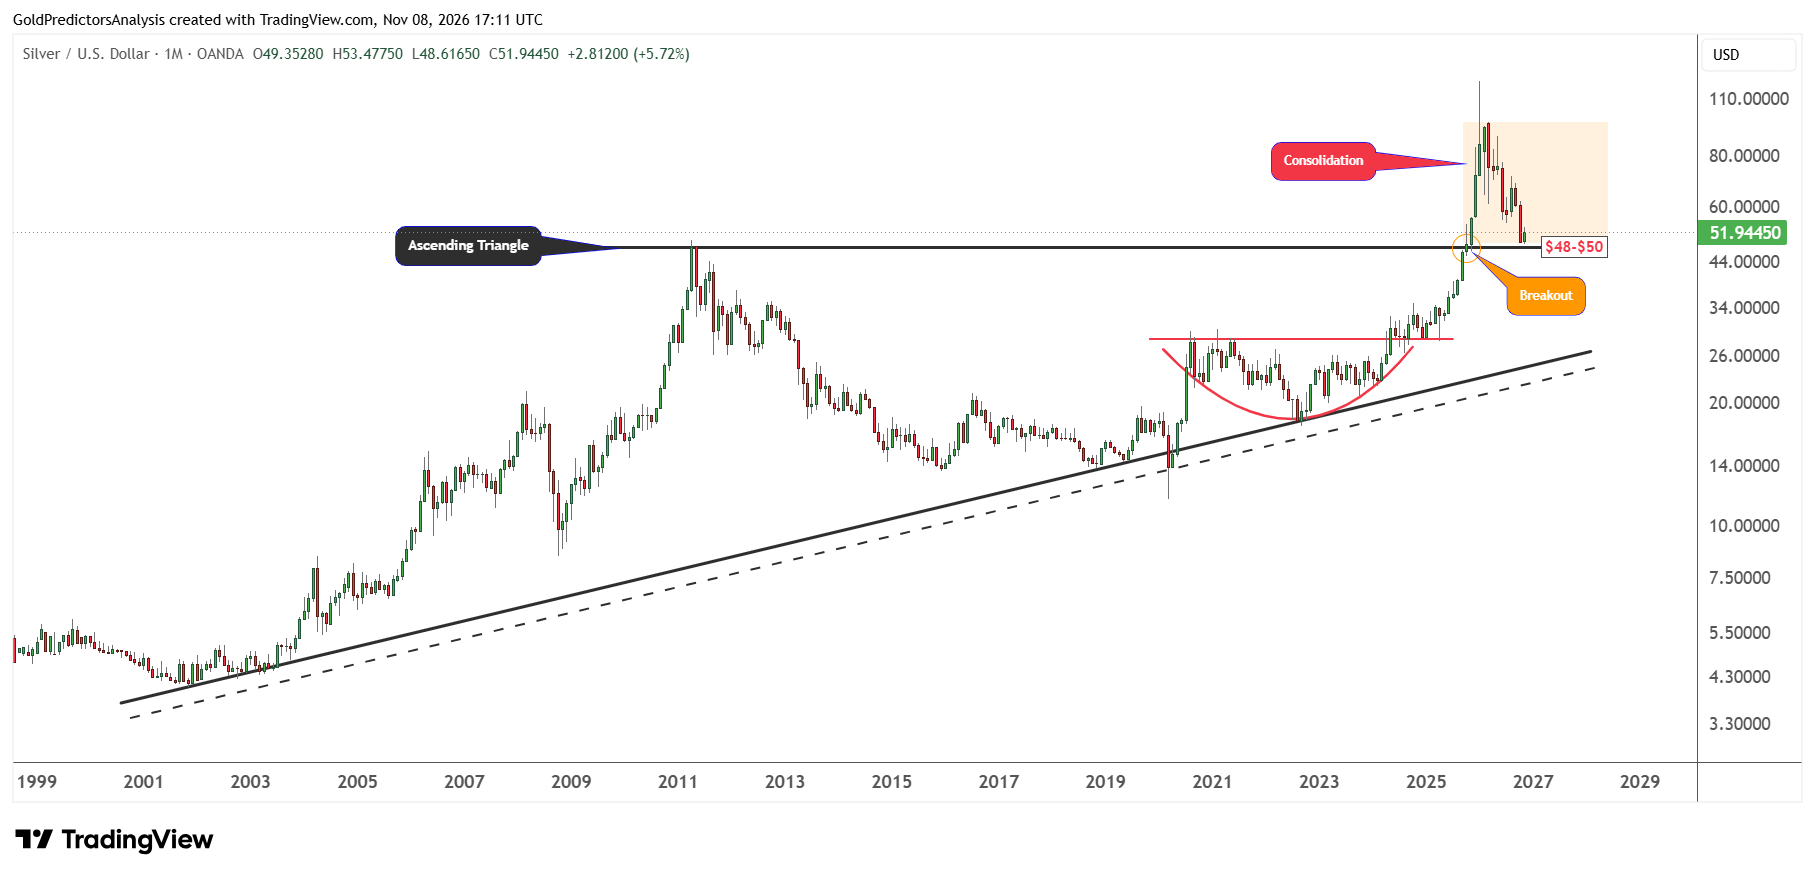
The monthly chart for silver shows that the price reached the key support zone of $48 to $50 and rebounded last week. The highs of 2011 define this support zone. A break below $48 may push the price further lower.
Silver has already broken above the ascending triangle pattern that formed from the lows of 2001. If silver holds and consolidates around the $48 to $50 region, it may rally to higher levels. The lower boundary of the broader support zone lies near $45.
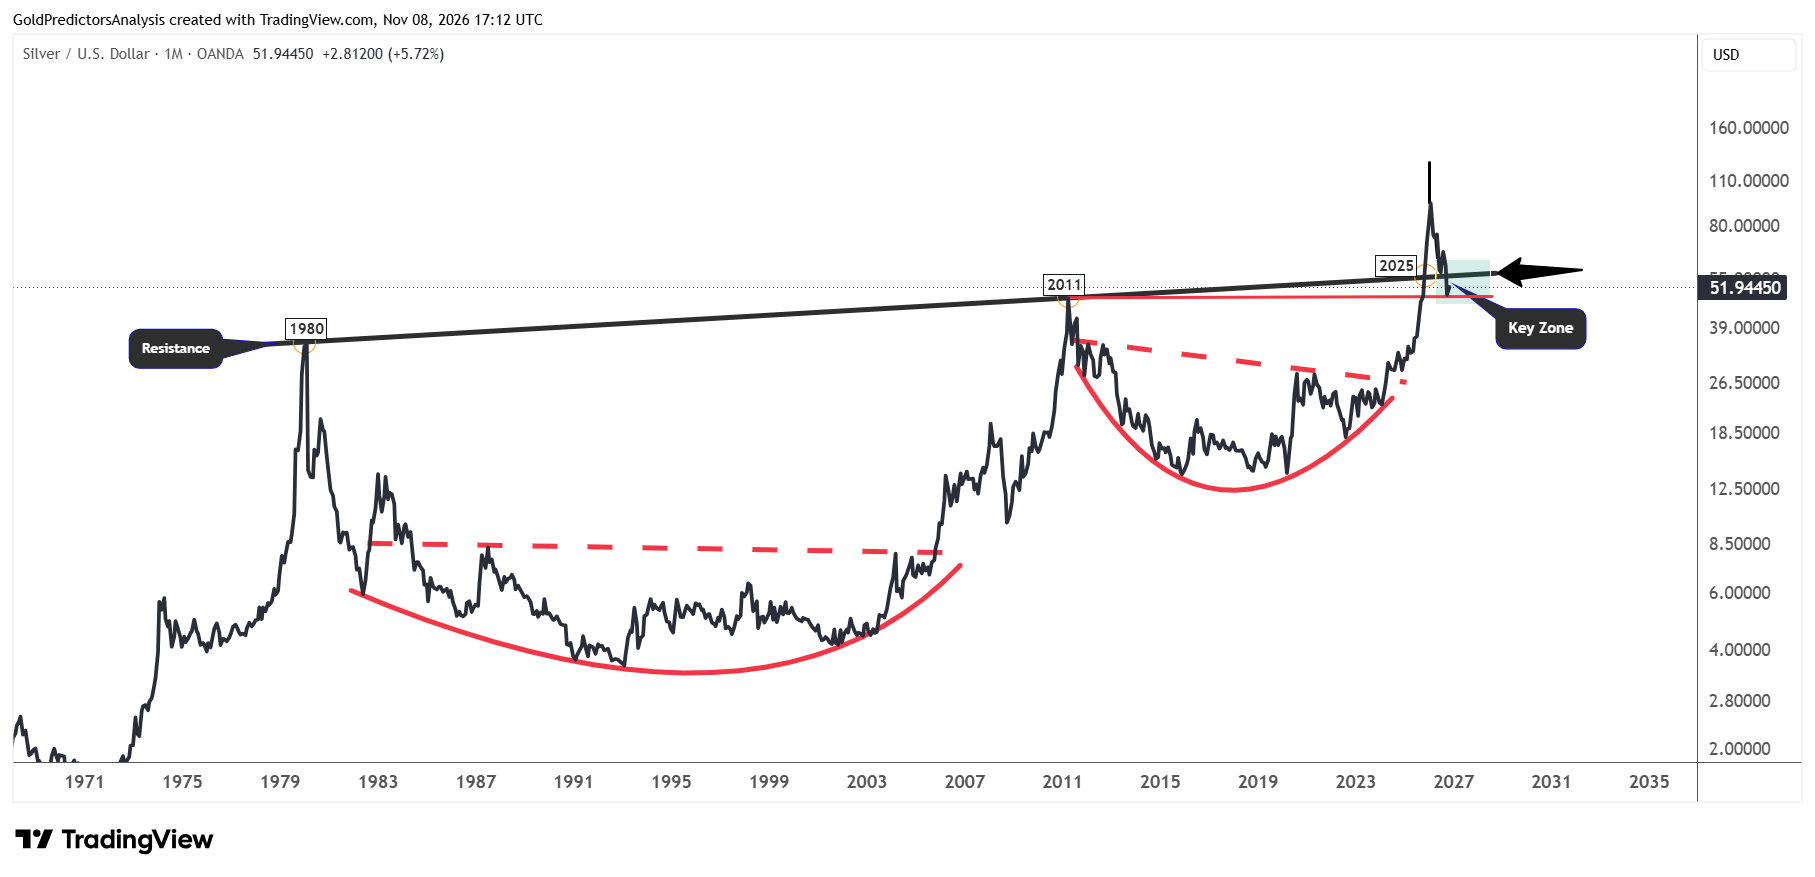
The monthly chart below also shows the same support zone. It is observed that the price is approaching the neckline of cup and handle pattern that was formed from the highs of 1980. Silver has now tested the highs of 2011 near $48 and is rebounding.
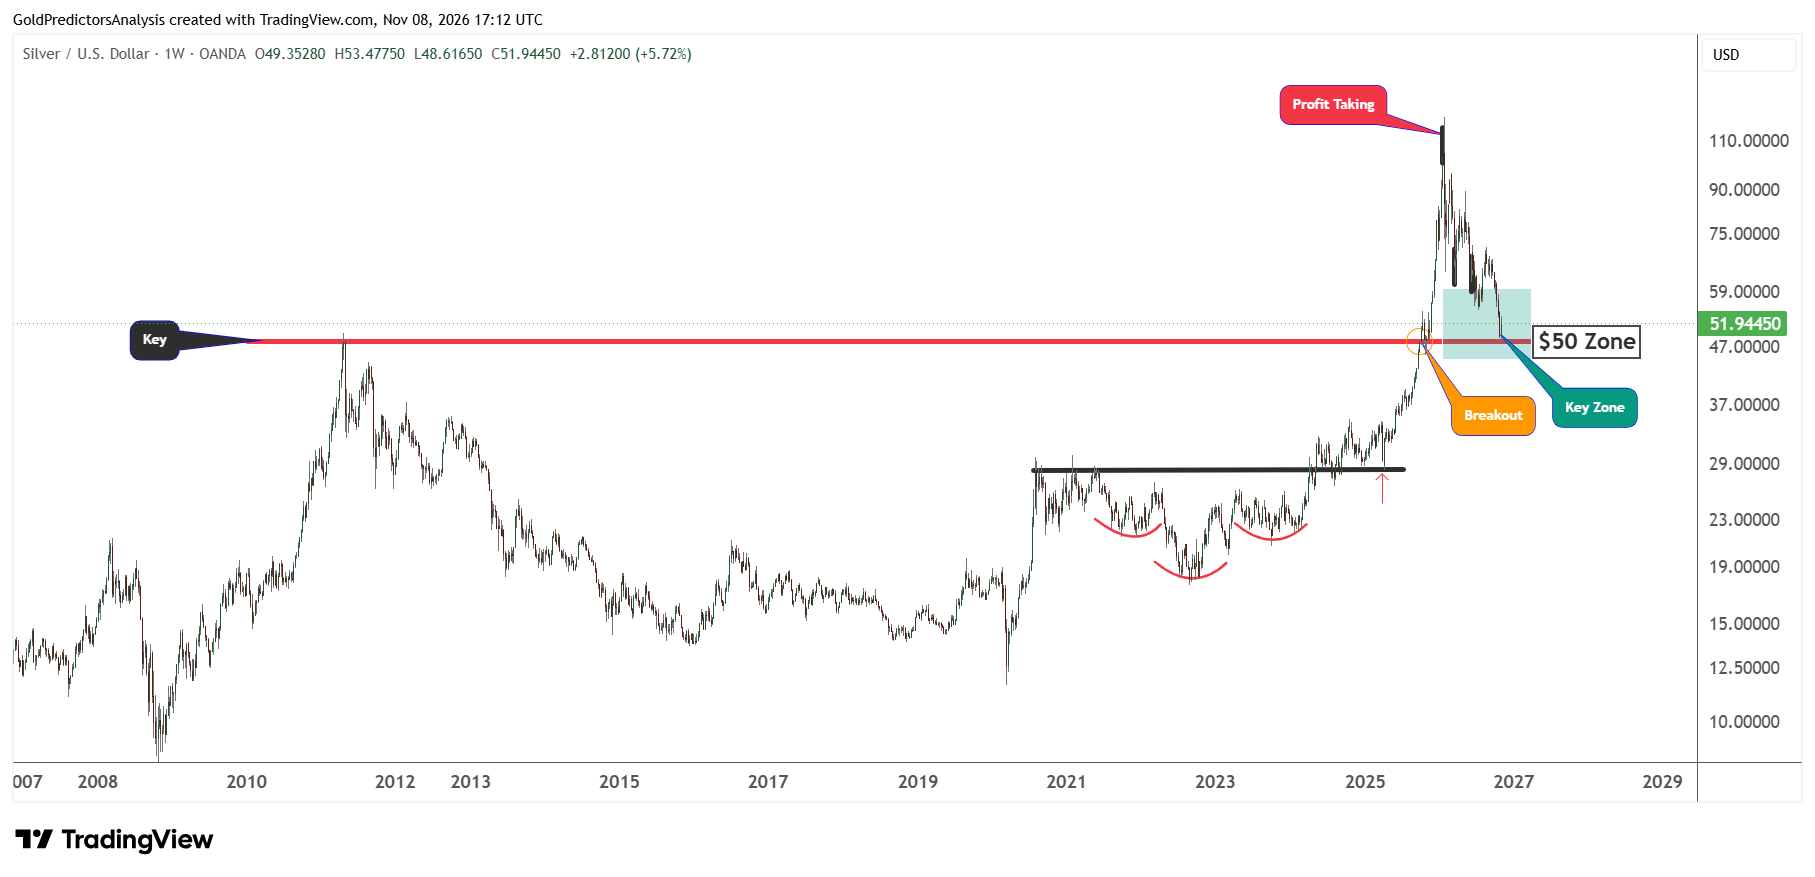
The weekly chart for spot silver also shows the importance of the current support zone. If the price holds above $45, the possibility of a rebound towards $60 is high. The formation of inverted head and shoulders pattern from 2020 to 2024 suggests constructive price action.
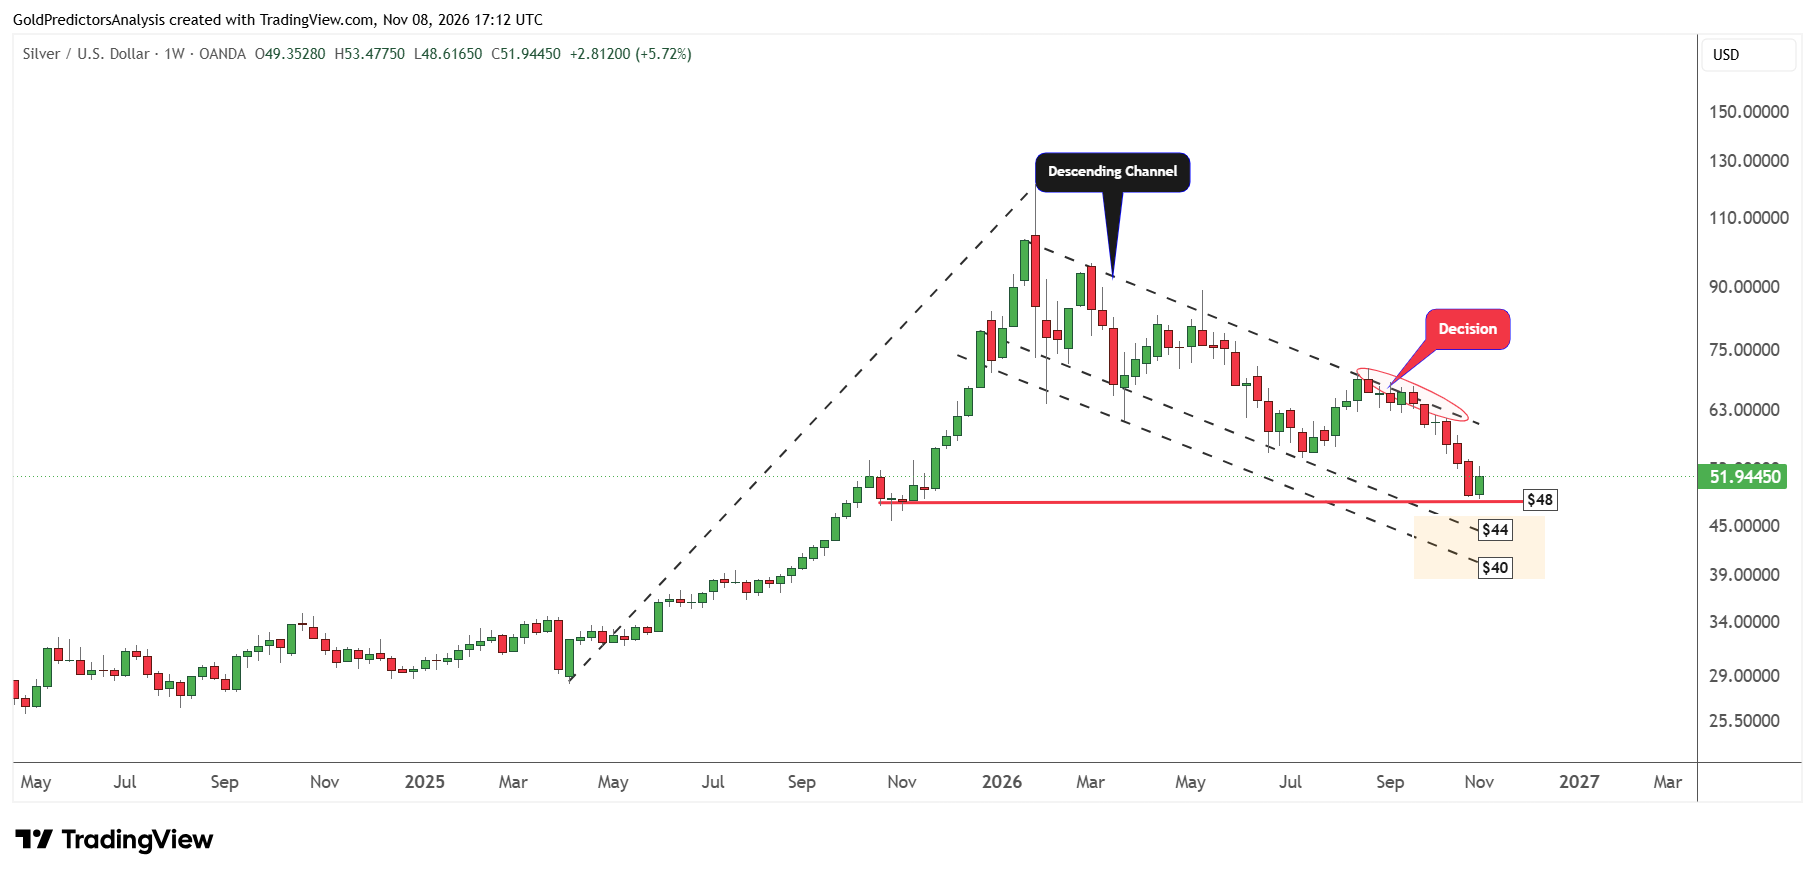
The chart below shows that the silver price is rebounding from the support line of the falling wedge pattern. The resistance for the falling wedge is $60. If the price fails to hold $48, it may fall toward $45.
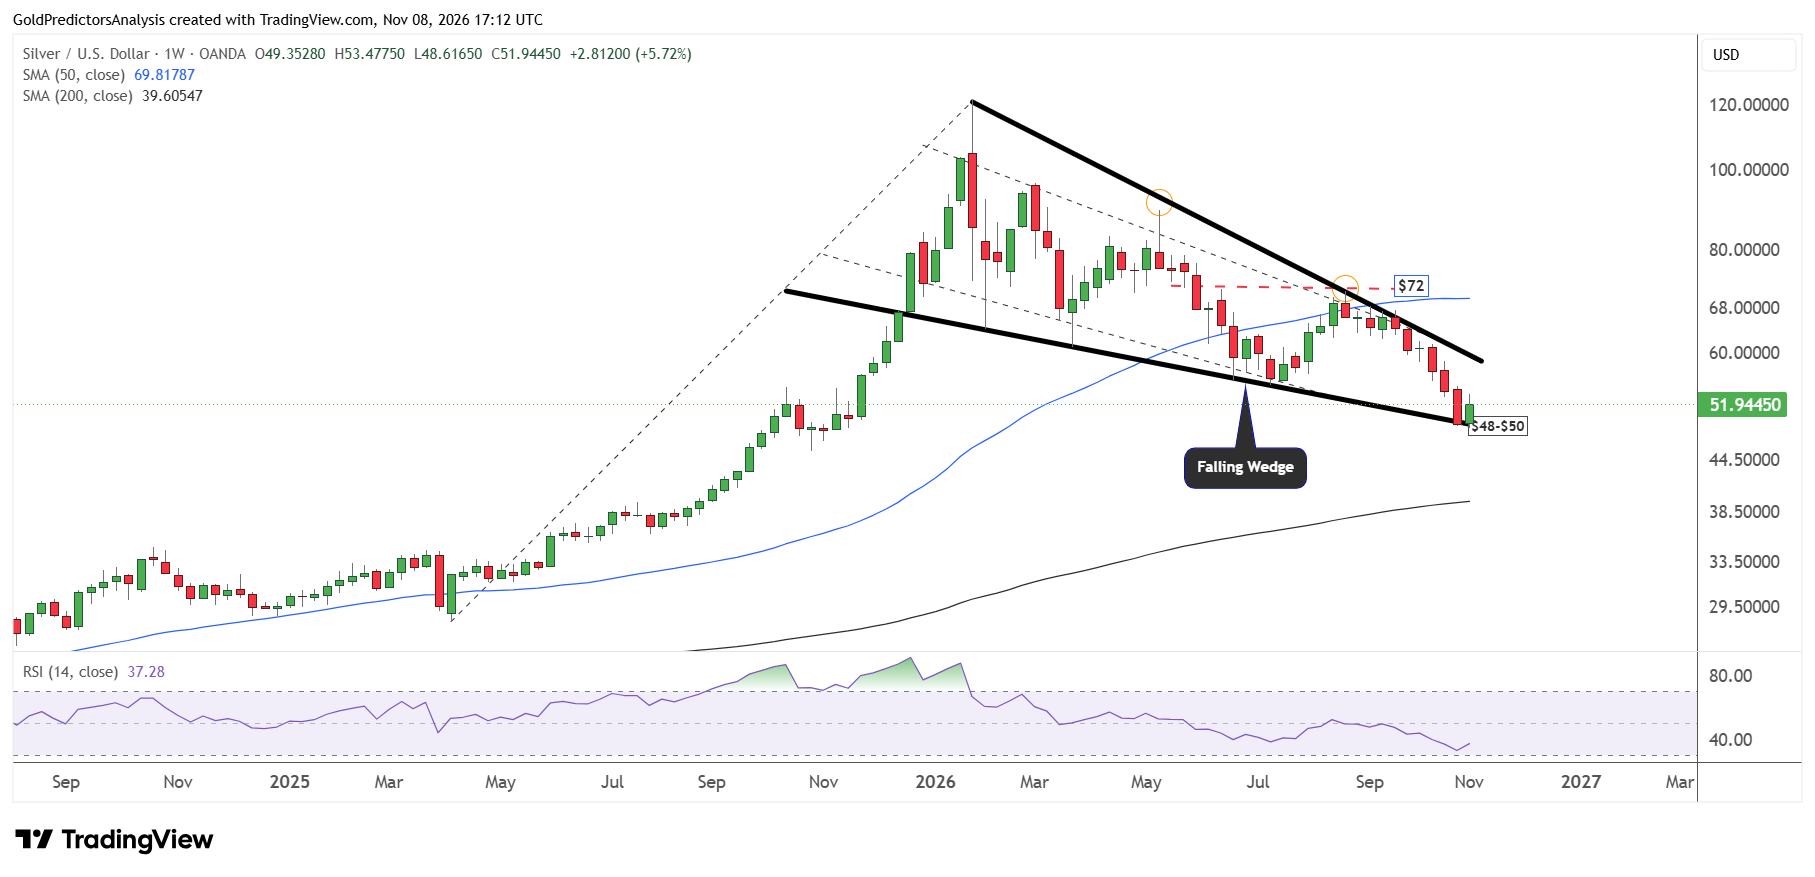
If the Fed tightening continues due to the hot inflation environment, silver may continue lower toward the long-term support zone. This breakdown might be activated if the price breaks below $48. The break below this support may open the way for a drop toward the lower bound of support of the descending channel between $40 and $45, as seen in the chart below.
Gold-to-Silver Ratio Tests 80 as Silver Finds Support
The ratio of gold (XAU) to silver may be used to understand the relative performance of both metals. The ratio increases when the gold price outperforms silver and falls when silver outperforms gold. When the silver price hit the support of $48, the gold to silver ratio reached the resistance of 80. The chart shows that the historical peaks in the ratio have been correlated with major bottoms in gold and silver prices.
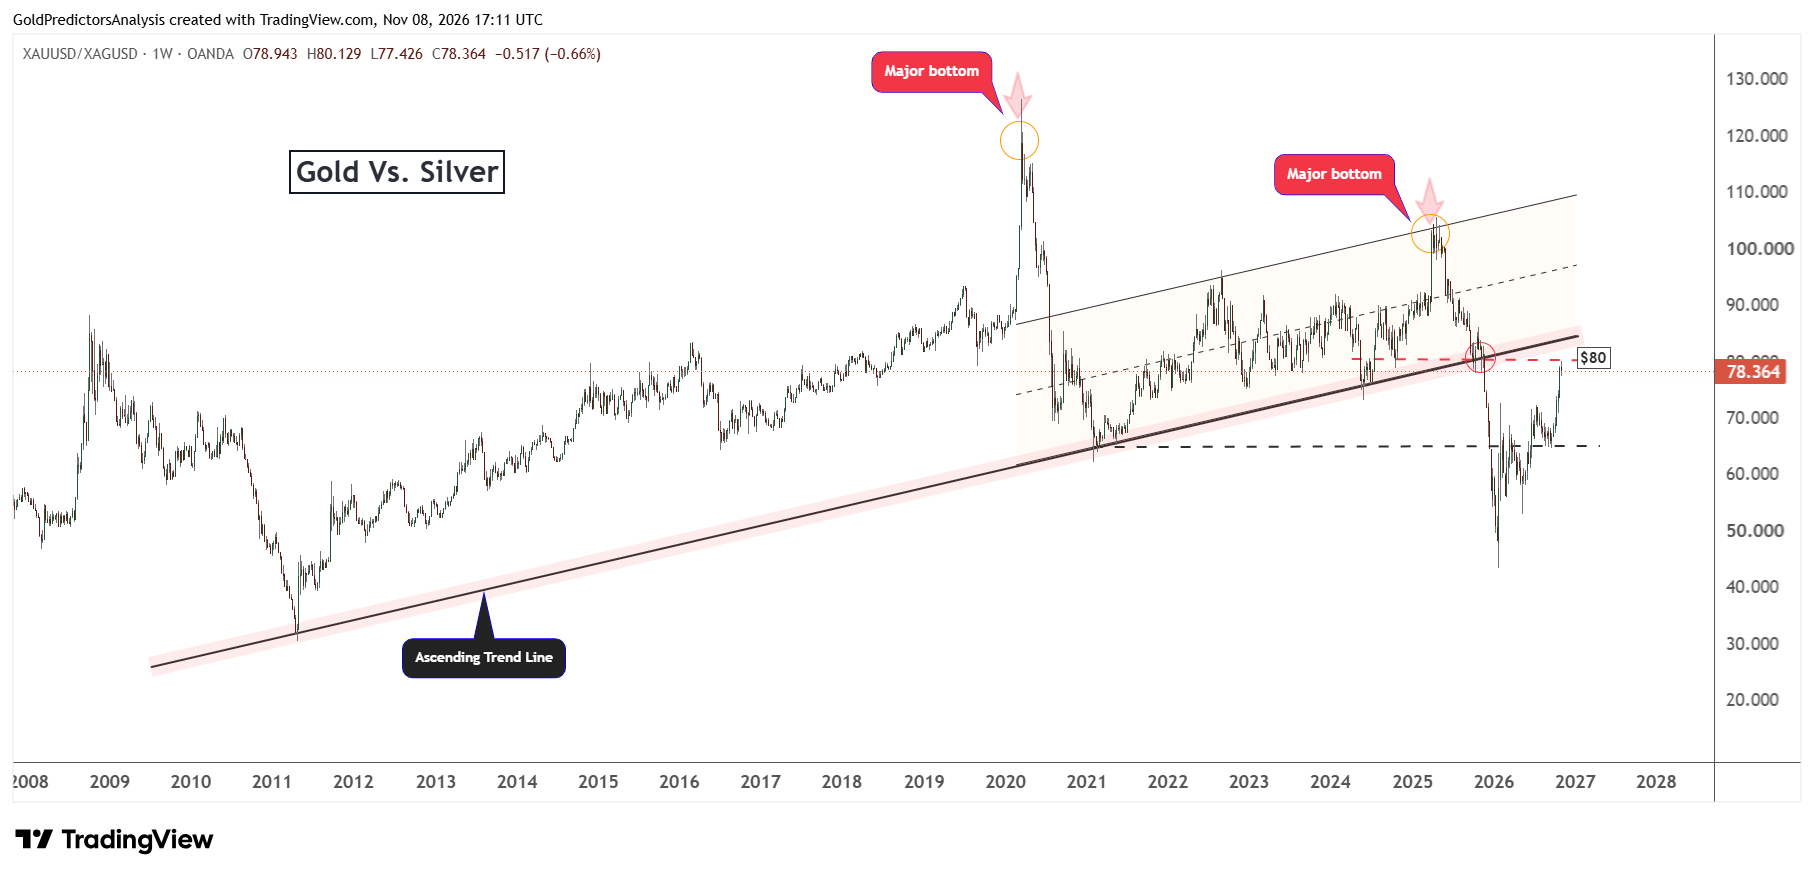
The ratio has been rebounding from support since lows of January 2026 as gold and silver continue to correct from record levels. When the ratio peaks and continues to drop, the gold and silver prices may form bottom. The resistance for the ratio remains at 80. A break above 80 will likely push the ratio towards 84.
Hot US CPI Could Extend the Dollar Rally and Pressure Silver
The main risk for silver this week is the US CPI data which will be released on Tuesday. If inflation is higher than expectations, the market may increase expectations for a rate hike in December and in early 2027. That may support a rally in the US dollar toward 104, which may increase pressure on silver prices.
A break below $48 will increase the risk of a correction to $45. If the market fails to hold the $45 level, it will increase the risk of deeper correction. If the gold-to-silver ratio continues to rally above 80, it will also increase the risk of a deeper correction in gold and silver prices.
What to Watch Next
Silver closed positive on Friday despite the strong rally in US dollar index after the strong jobs data. The market is now watching for the US CPI data, which may set the next direction for silver. A strong inflation data may push the US dollar higher toward 104 and limit the rally in silver prices.
Silver has hit the strong support zone of $48 and $50 and created a rebound from this zone. However, the rebound is still limited and requires a break above $60 to suggest a strong recovery. If silver prices fail to break $60 and continue to decline below $48, the next support will likely be $45.
The gold-to-silver ratio also hit the resistance at 80 when the silver price hit the support of $48. If the ratio forms a peak and continues to drop, it will likely suggest a bottom in silver prices.