US CPI Data on Fed Rate Cut Expectations
The US dollar weakened following softer CPI inflation data, increasing hopes for a Fed interest rate cut and boosting precious metals like silver. Fed Bank of Minneapolis President Neel Kashkari highlighted the need to monitor economic conditions to determine if current policy rates are too restrictive. According to CME’s FedWatch Tool, financial markets now predict a 75% chance of a Fed rate cut in September 2024, up from 65% before the CPI report.
The US Consumer Price Index (CPI) rose by 3.4% year-over-year (YoY) in April, slightly lower than March’s 3.5%, meeting market expectations. Monthly CPI inflation dipped to 0.3% from 0.4%, below the anticipated 0.4%.
Excluding food and energy, core CPI increased by 3.6% YoY, down from the previous 3.8%, with monthly core CPI easing to 0.3% from 0.4%. US Retail Sales stagnated at 0% month-over-month (MoM) in April, contrasting with March’s 0.6% rise and falling short of the estimated 0.4%.
The softer US CPI data has raised hopes for a Fed rate cut, weakening the US dollar and boosting silver prices. Lower interest rates can make holding non-yielding assets like silver more attractive.
Silver (XAG/USD) Price Forecast
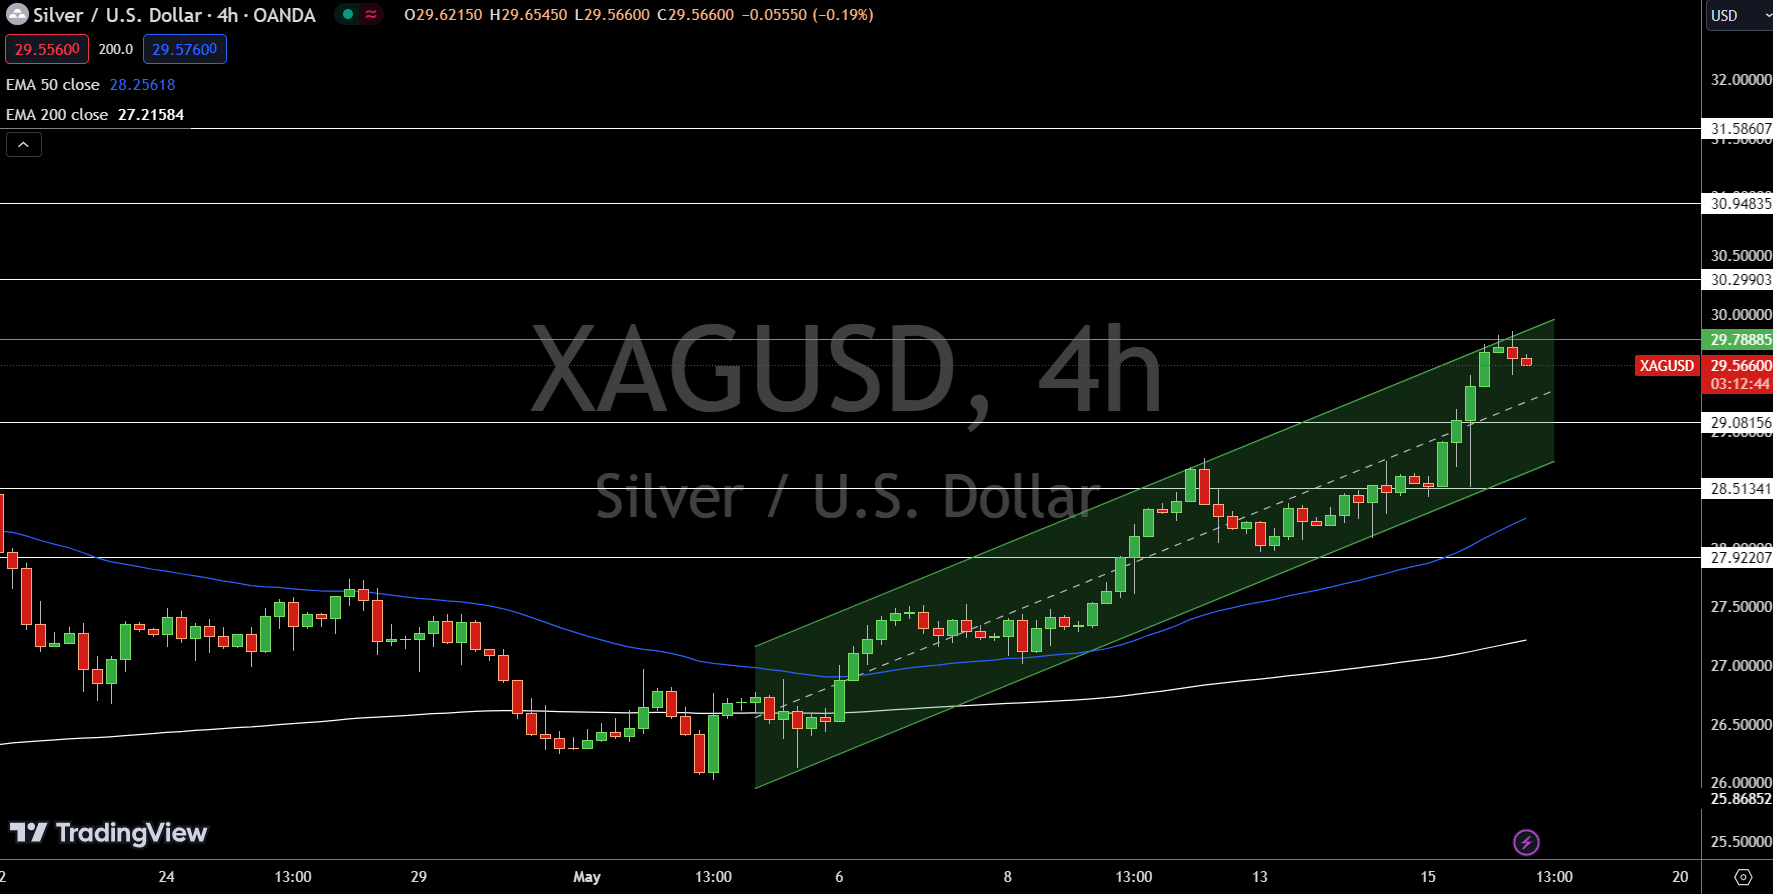
Silver (XAG/USD) is trading at $29.56, down 0.32%. Key price levels to watch include a pivot point at $29.79. Immediate resistance levels are at $30.30, $30.95, and $31.59. On the support side, immediate levels are at $29.08, $28.51, and $27.92.
Technical indicators present a mixed outlook. The 50-day Exponential Moving Average (EMA) is at $28.26, and the 200-day EMA is at $27.22, both suggesting an overall bullish trend. However, the formation of Doji and Spinning Top candles near the $29.78 resistance level indicates a potential bearish correction.
In conclusion, Silver remains bearish below the pivot point at $29.79. A break above this level could enhance bullish momentum, while failure to surpass it might lead to a further bearish correction towards the $29 mark.