


The S&P 500 receives mixed signals from oil prices and the risk of rate hikes by the Fed. The earnings of Tesla, Inc. (TSLA) and Meta Platforms, Inc. (META) have also raised concerns about AI spending and future returns. But the technical picture remains constructive as the S&P 500 compresses near the resistance of 7,800.
Maria Agustina Patti, Financial Markets Strategist at Exness, commented:
High oil prices are putting pressure on the stock market, as rising energy costs feed into inflation and make another rate hike from the Fed more likely. At the same time, big tech companies are spending huge amounts on AI, and investors are starting to ask when that money will actually pay off. Meta’s latest results showed strong sales but heavy spending, while Tesla cut back its budget to protect its cash. Even so, the S&P 500 is holding up well, and a break above 7,800 could open the door to 8,000.
In my opinion, a break above 7,800 will push the index towards 8,000. But high energy prices and cost of borrowing remain key risks to the outlook for the S&P 500.
S&P 500 Fundamentals: Oil Above $110 Raises Fed Hike Risks
Oil prices remain strong and continue to move higher due to the recent escalation in the Middle East. High oil prices have become the immediate threat to the outlook for the U.S. stock market.
Brent oil trades above $110 and looks to break higher due to emergence of bullish price action. The positive move in the oil market is seen after the fresh attacks in Saudi Arabia that renewed concerns about supply in Middle East. The U.S. also ordered some diplomats and families to leave the country.
The high prices for energy can raise the cost of transport and production. The increase in transport costs and production costs can reduce household spending. I think that the continued increase in oil prices may reduce the margins of profit for consumer and industrial companies in the medium term.
The 10-year U.S. Treasury yield dropped to 5.04% after reaching high of 5.36%. But the yield found support and rebounded higher this week. Despite the correction in U.S. Treasury yields, the outlook still remains strong due to high inflation concerns after U.S.-Iran war. The elevated yields suggest that the outlook for U.S. stocks is sensitive to the growth in earnings.
The uncertainty in the U.S. stock market also comes from the expectations of interest rate hikes. The chances of rate hike by the Fed in December still remain above 80%. This suggests that the markets are caught between weaker confidence in growth and the risk of persistent inflation.
S&P 500 Price Forecast
Every new S&P 500 analysis as it publishes, today's technical signal and key levels, live price — on one page.
See all S&P 500 forecastsTesla and Meta Earnings Put AI Spending Risks in Focus
The latest earnings for Tesla show tension between preserving cash and funding future growth. The company has cut the annual capital spending forecast to around $20 billion. The drop in spending helped to generate $1.53 billion in quarterly free cash flow.
But this also raised questions about the AI and robotics plans. I think that investors need clear evidence that tighter spending can support the flow of cash without delaying projects behind the valuation.
Meta Platforms also reported strong growth in sales. Its investment needs remain big concern. The revenue for Meta increased by 26% to $64.60 billion. The company forecast annual capital spending of $135 billion to $145 billion.
It reported negative quarterly free cash flow. The company also approved new non-voting share class to provide more financing flexibility from 2027. The reaction of stock market to these earnings suggests that strong revenue alone may struggle to support confidence when investors remain uncertain about the returns on future investment.
The weakness also spread to AI suppliers. Nvidia Corp. (NVDA) and Super Micro Computer Inc. (SMCI) continue to drop from the October peak. International Business Machines Corporation (IBM) offered more encouraging business signal. It raised the annual software revenue growth forecast to 7%-8%. The chart below shows that Nvidia and Meta remain weak in October but Tesla’s stock shows strength.
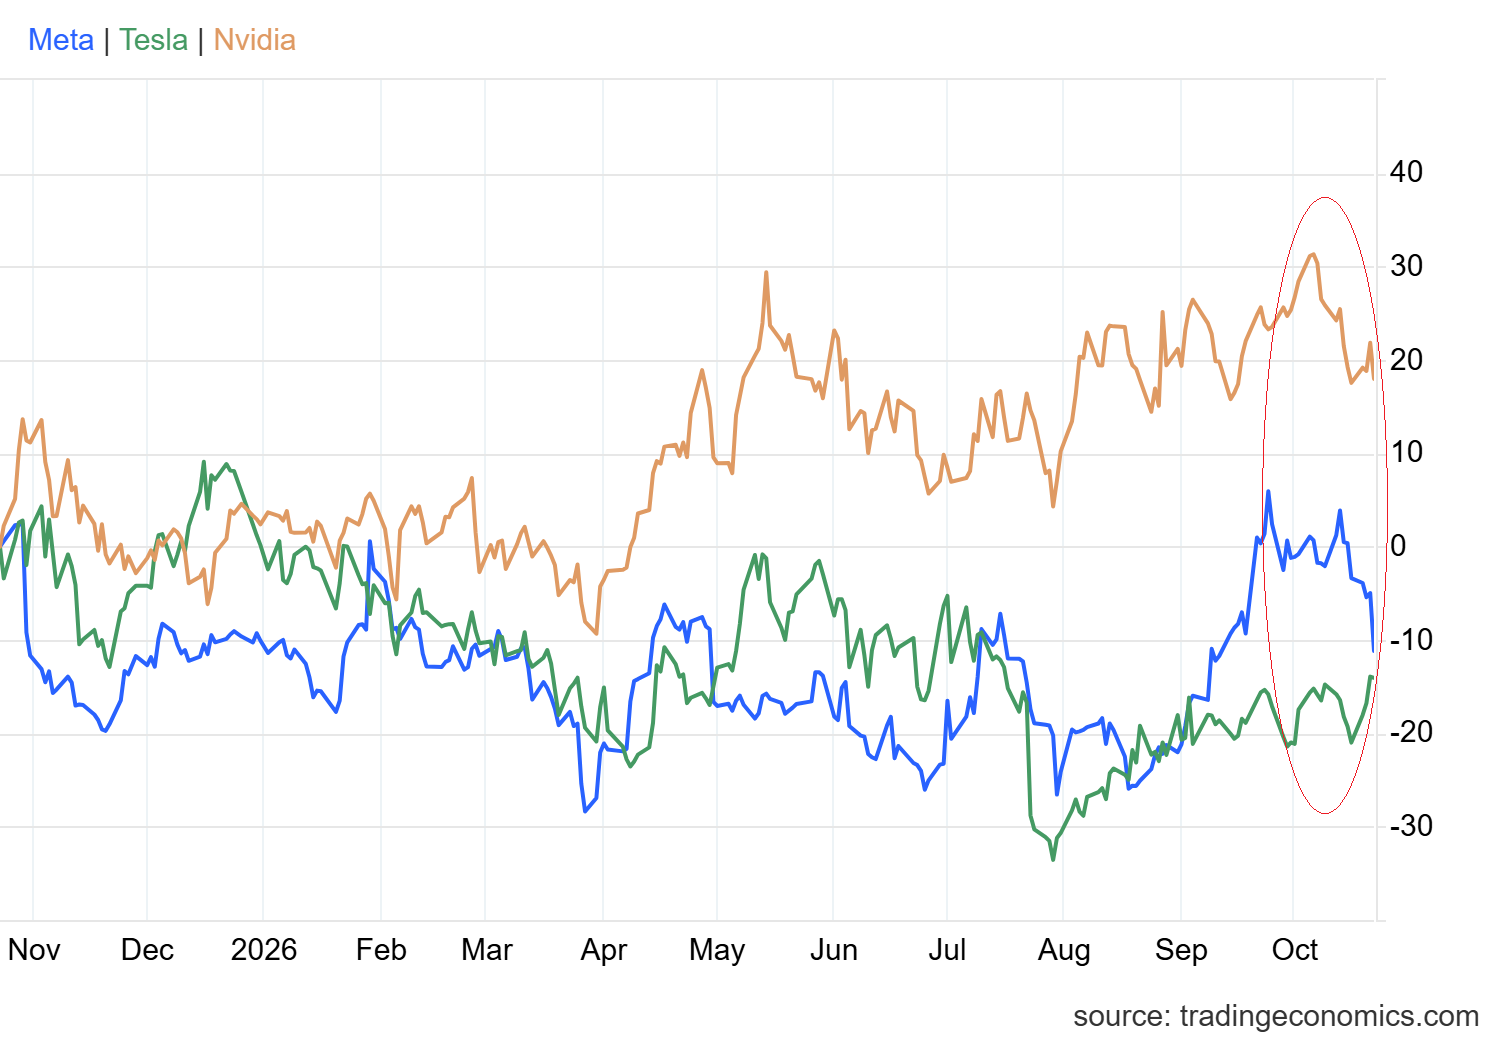
These developments leave mixed picture. I think that S&P 500 needs confidence in both technology demand and the returns on AI spending. The correction in oil prices will also help to reduce the pressure on broader market.
S&P 500 Technical Analysis: A Path to 8,000
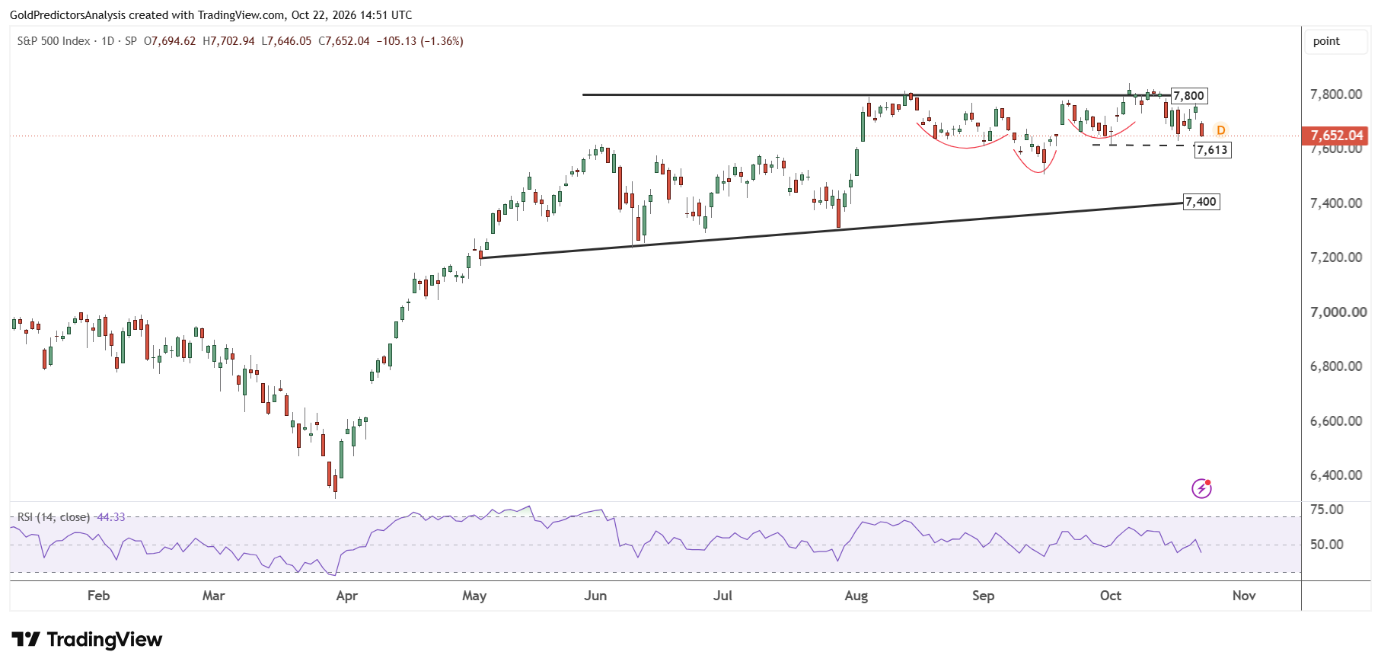
The daily chart below shows that the S&P 500 has formed constructive price action in the long term despite the strong sell-off in AI stocks. The sell-off in AI stocks has pushed the index towards the key support zone seen at the 50-day SMA. The index produced a low at $7,631 and rebounded higher back towards the key resistance area at the 7,800 level.
The emergence of inverted head and shoulders pattern from January 2025 to June 2025 and then the emergence of an ascending broadening wedge pattern since July 2025 suggests a broader bullish structure. Then the V-shaped recovery in April 2026 and price compression between $7,500 and $7,800 since August 2026 suggest that the S&P 500 may break higher towards the $8,000 level.
A break above 7,800 will push the index towards the 8,000 level. But a break below the 7,631 level will open the way for further drop towards the 7,500 level. As long as the index remains above the 200-day SMA at the 7,284 level, it will likely continue to trend to higher levels.
The short-term price action for the S&P 500 shows that the index is compressing within the triangle pattern. The boundaries of the triangle lie between 7,400 and 7,800. A break of any of these levels will likely define the next move in the index.
The immediate support in the index is 7,613. A break below this level will likely push the index to 7,400. On the other hand, a break above 7,800 will open the way for 8,000. The RSI is now breaking below the midline, which may trigger a drop in S&P 500 before the next rally.
What to Watch Next
In my view, the S&P 500 is consolidating between 7400 and 7800 levels and looks to find the next move. A break above 7800 will open the way for a strong rally towards 8000. On the other hand, a break below 7613 will push the index towards 7400. As long as the index remains above 7400, the possibility of an upside breakout above 7800 is high.
The risk for the S&P 500 in the near term is the positive movement in the oil market. The strong oil prices keep the expectations high for a rate hike by the Fed in December. The high oil prices also raise the cost for businesses and keep the inflation risk alive. The market will also watch spending on AI infrastructure to see whether this spending can deliver strong earnings and cash flow.