


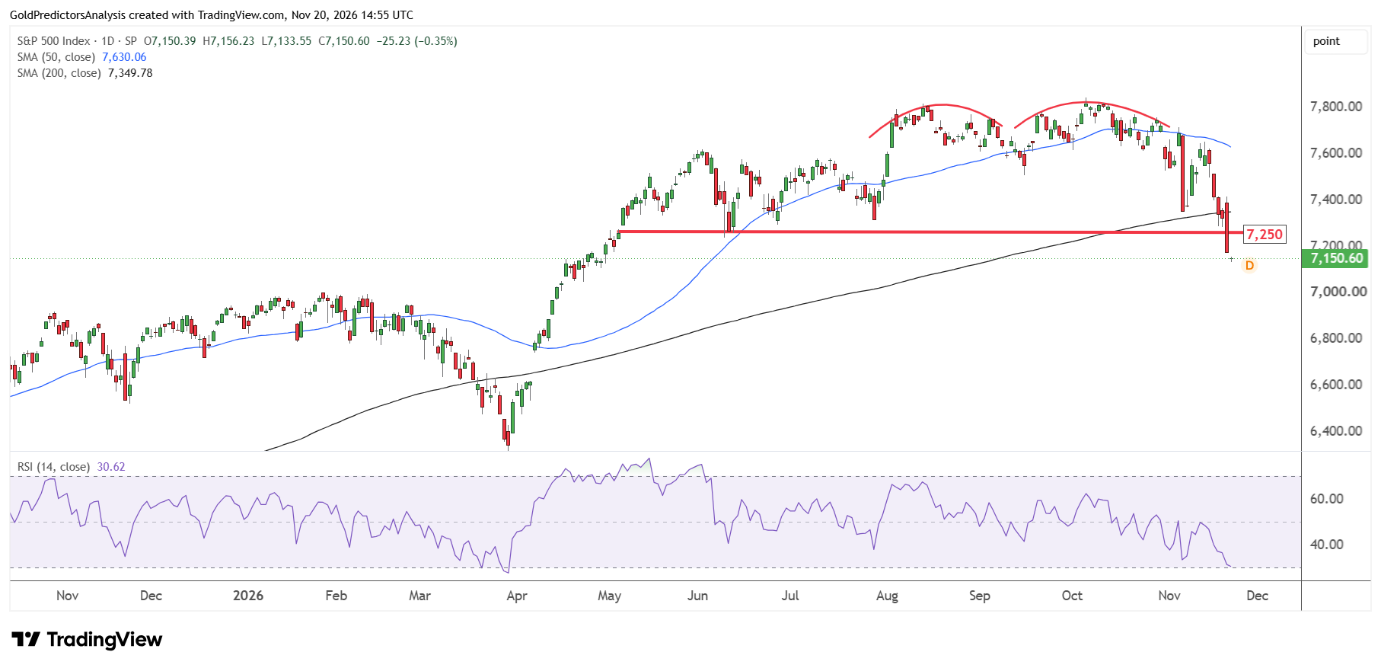
The S&P 500 remains under pressure in the short term as expectations for interest rates keep US dollar strong. The strong revenue growth for Nvidia may support interest in AI stocks. But investors still remain cautious about the increase in AI spending and future profits. The technology and semiconductor stocks remain under pressure on Friday as the S&P 500 broke below the key support of 7,250.
Inki Cho, Senior Financial Markets Strategist at Exness, commented:
Technology companies are spending billions on data centres and equipment, but investors want to see that this money is bringing in more business and profits. Higher interest rates make these projects more expensive, while lower oil prices could help reduce costs for businesses and consumers. However, inflation remains a concern, and the Fed may not be ready to lower rates. Its next decisions will remain important for the stock market.
Nvidia Earnings Highlight AI Demand and Spending Risks
The earnings from Nvidia show that the demand for AI computing remains strong. The Q3 revenue for Nvidia is $115.8 billion which increased by 103% from the previous year. The chart below shows that Nvidia has consistently increased revenue during the past 10 years.
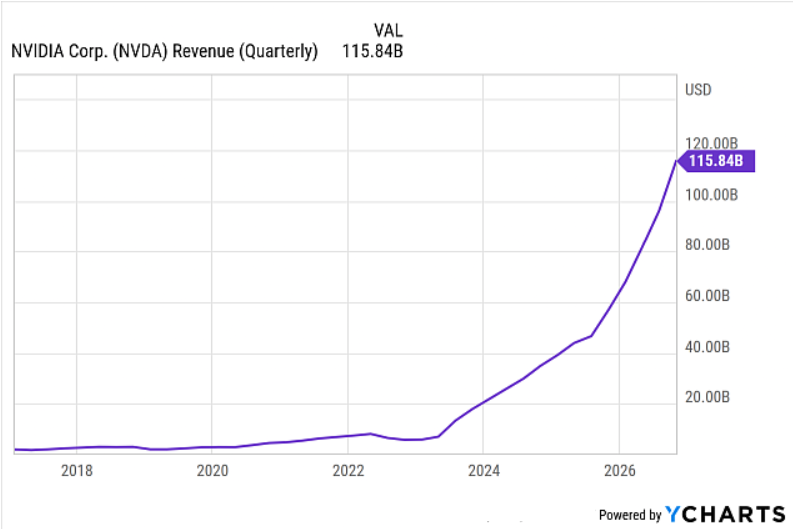
However, the revenue growth after 2023 is stronger due to the generative AI infrastructure boom and development of data centers. The chart below shows that the growth in revenue for Nvidia is 1420% over the past 5 years.
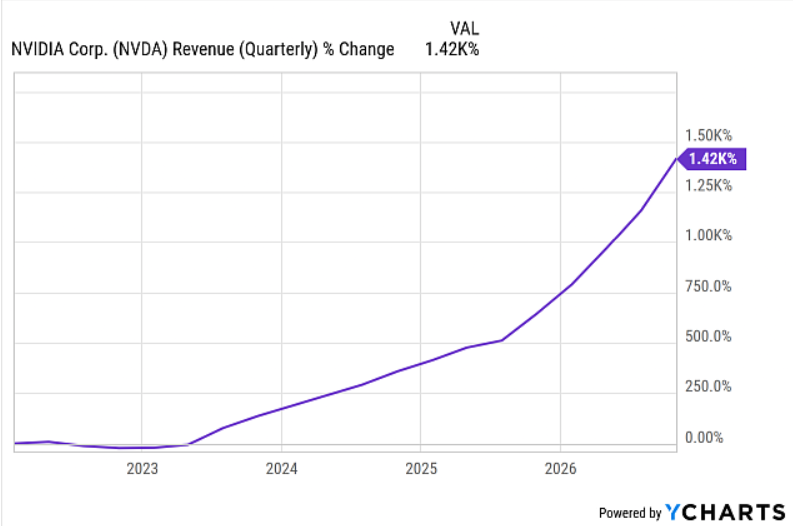
The forecast for Q4 is also strong at $130 billion. The stock price of Nvidia dropped significantly as the market faces uncertainty about the change in leadership for the company. I think that strong revenue alone may not produce positive reaction in stocks, as investors also need confidence in future profits.
The stock indices remain under pressure as the S&P 500 has lost over 2.02% on Thursday to close the index at 7,175.85. This marks the sixth consecutive daily decline in the index. The Nasdaq index also remains under pressure as it remains below the 200-day SMA.
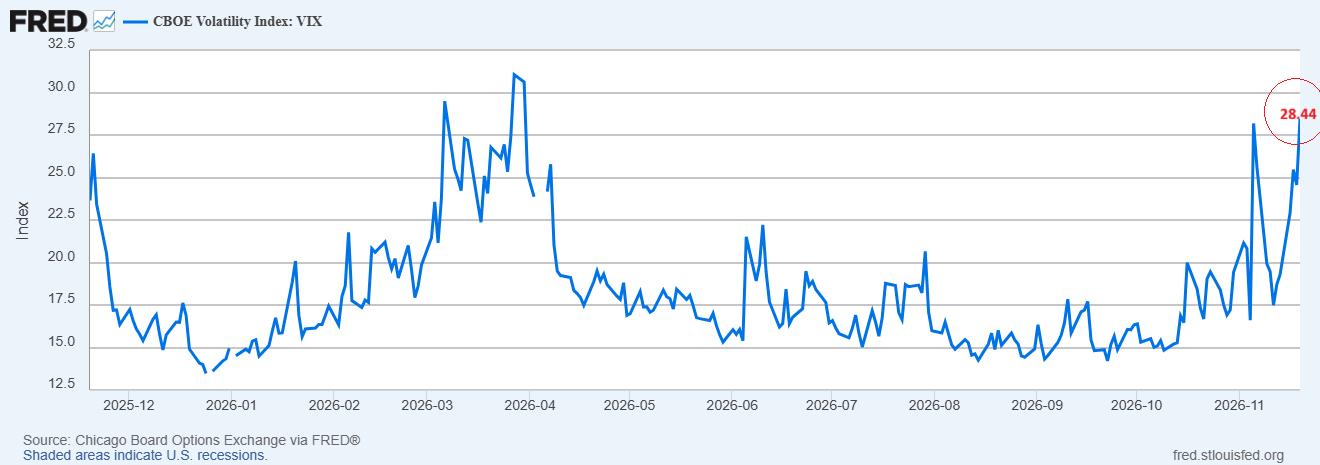
The market swings in the US stock market have increased significantly as seen by the VIX index below. The VIX has reached the 28.44 level on Friday which suggests that uncertainty still remains high.
The Fed minutes were released on Wednesday and raised questions about the financing behind the AI expansion. Officials are worried about the current AI spending. They mentioned that the AI-related debt has grown significantly and AI investment may not make money as per expectations.
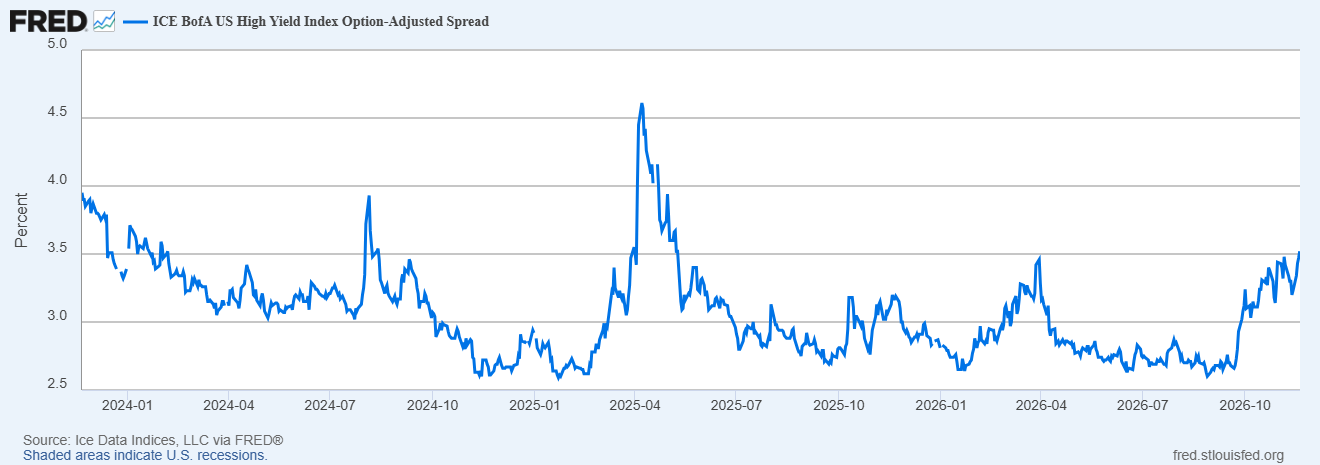
The chart below shows that the high yield credit spread also shows caution as the credit spread has increased to 3.43%.
S&P 500 Price Forecast
Every new S&P 500 analysis as it publishes, today's technical signal and key levels, live price — on one page.
See all S&P 500 forecastsWhy High Treasury Yields Are Weighing on US Stocks
Interest rates remain the major challenge for US stocks. As per the latest meeting minutes from the Fed, almost all participants expected the increase in interest rates as their baseline case. Some of the participants even expected the hike larger than 25 basis points if the inflation data remains strong.
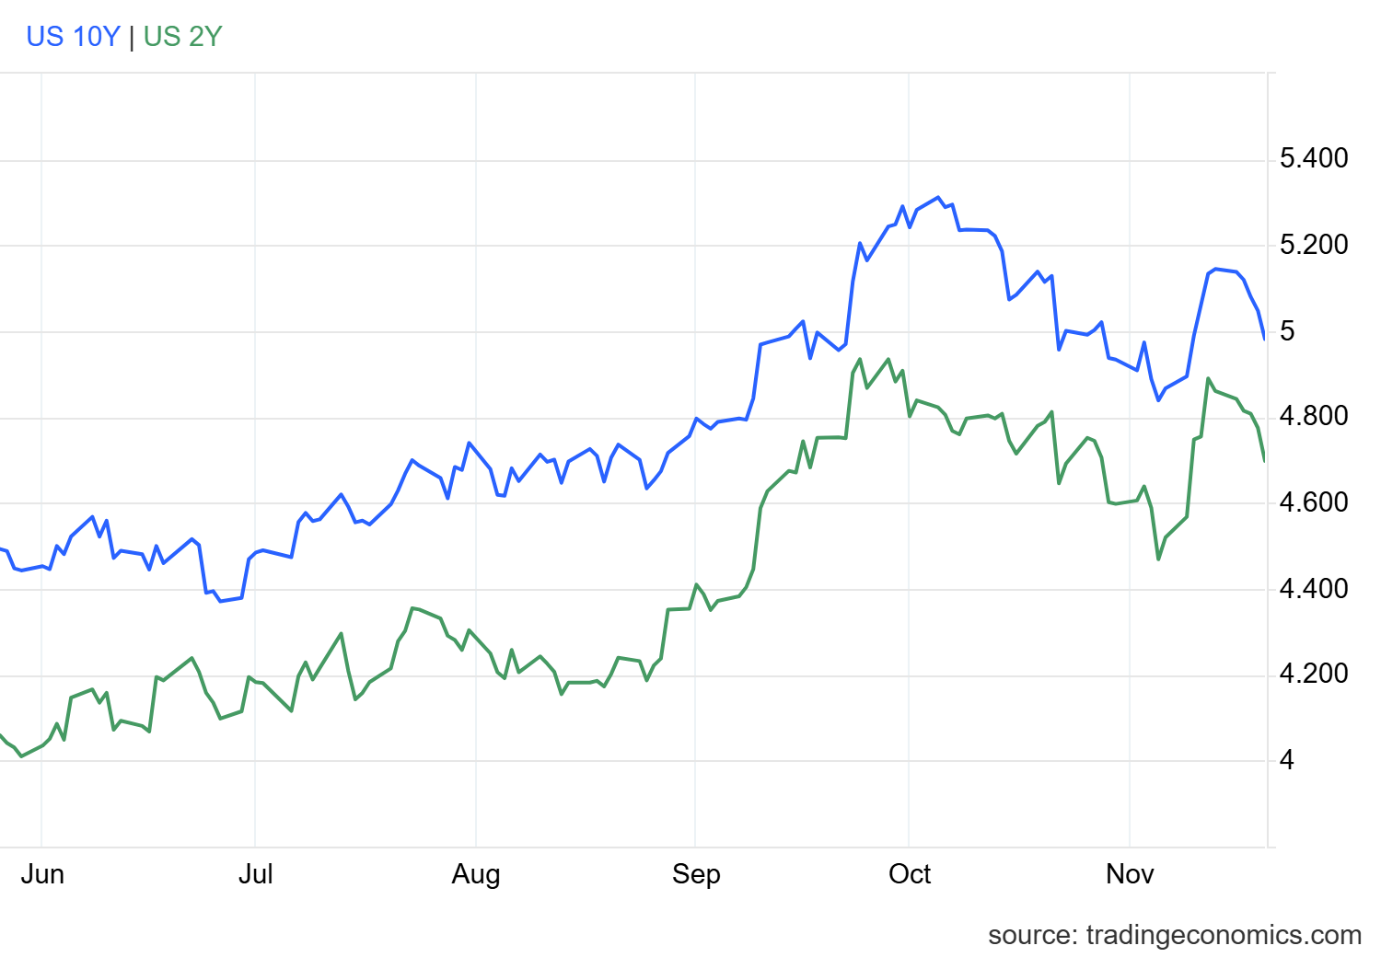
The chart below shows that the 10-year US Treasury yield dropped below 5% on Friday as investors look for safety in government bonds. The 2-year US Treasury yield also dropped to 4.70%. But the Treasury yields still remain elevated. The high yields challenge the growth for expensive growth stocks.
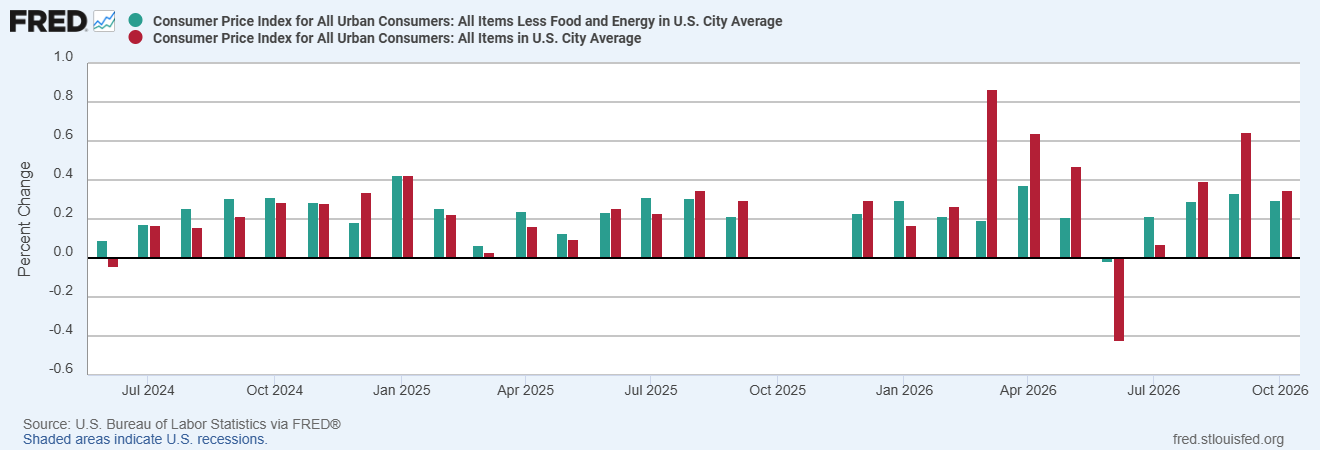
The US dollar remains strong as the inflation outlook is strong. The chart below shows that the headline and core CPI increased 0.4% and 0.3% in October, respectively. The persistent price increases may keep the Fed cautious about interest rates.
If the US dollar continues to strengthen further, it may reduce the dollar value of overseas earnings for US companies.
Consumer spending provides some support but the pace has slowed. The chart below shows that the retail sales increased to $748.22 billion in October which is up from $746.64 billion in September.
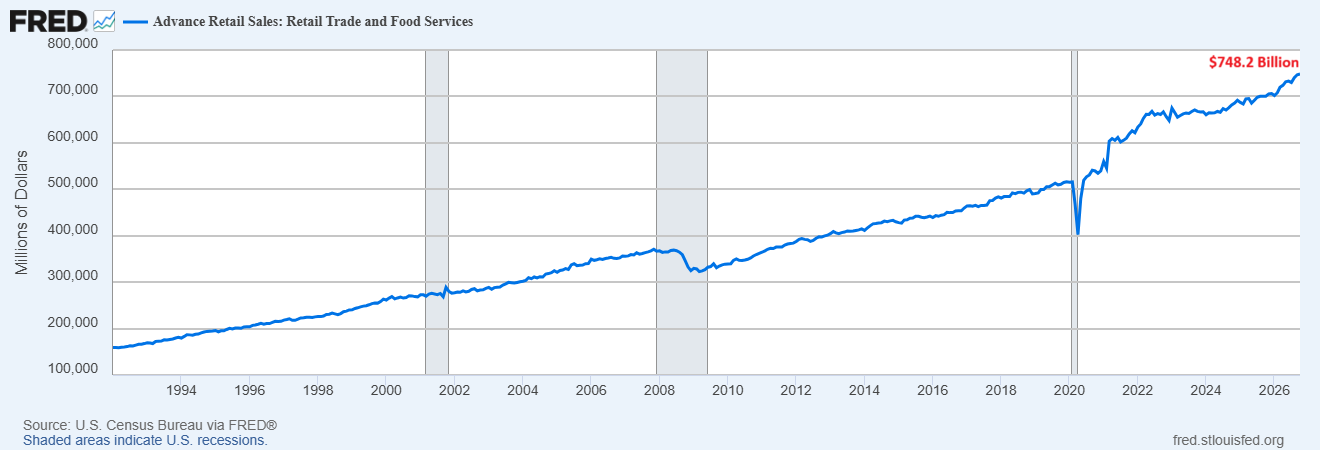
The monthly growth in retail sales was 0.2% which is down from 0.8% in September. But the retail sales data does not provide evidence about the growth in the volume of goods that were bought.
The upbeat outlook for Target Corporation (TGT) and TJX Companies Inc. (TJX) lifted their share price on Wednesday. The earnings from Walmart Inc. (WMT) showed the quarterly revenue of $188.8 billion, which is up 5.2% from the previous year. The company also raised the full-year outlook.
How Lower Oil Prices Could Affect S&P 500 Earnings
Crude oil prices continue to drop after hitting the key resistance level of $120 in October. The correction in oil prices adds another factor to the outlook for US stocks. WTI oil dropped to $83 while Brent oil dropped to $92.30.
This decline in oil prices was driven by the increase in US inventories which increased concerns about supply. As per the latest report from EIA, crude stocks increased by 3.4 million barrels last week.
In my view, the correction in oil prices supports airline and transport companies as these companies cut fuel costs. Retailers may also benefit from the lower cost of delivery. Households may have more money to spend if petrol prices follow the oil prices in later stages. But the drop in oil prices may reduce margins for the oil producers which creates a mixed outlook for S&P 500.
S&P 500 Technical Analysis: Does the Break Below 7,250 Open 7,000?
From a technical perspective, the S&P 500 formed the inverted head and shoulders pattern from November 2021 to December 2023. The head of this pattern formed with the low of 3,491 in October 2022 and the shoulders formed with the low of 4,114 in February 2022 and the low of 4,103 in October 2023. The inverted head and shoulders pattern broke higher above the neckline in January 2024 and triggered a strong rally.
After the breakout, the price has been forming the ascending broadening wedge pattern since April 2024. After marking a record high of 7,844.52, the S&P 500 continued to drop toward the 50-week SMA. The break below 7,250 increases the risk of deeper correction to 7,000, which is near the highs of January 2026.
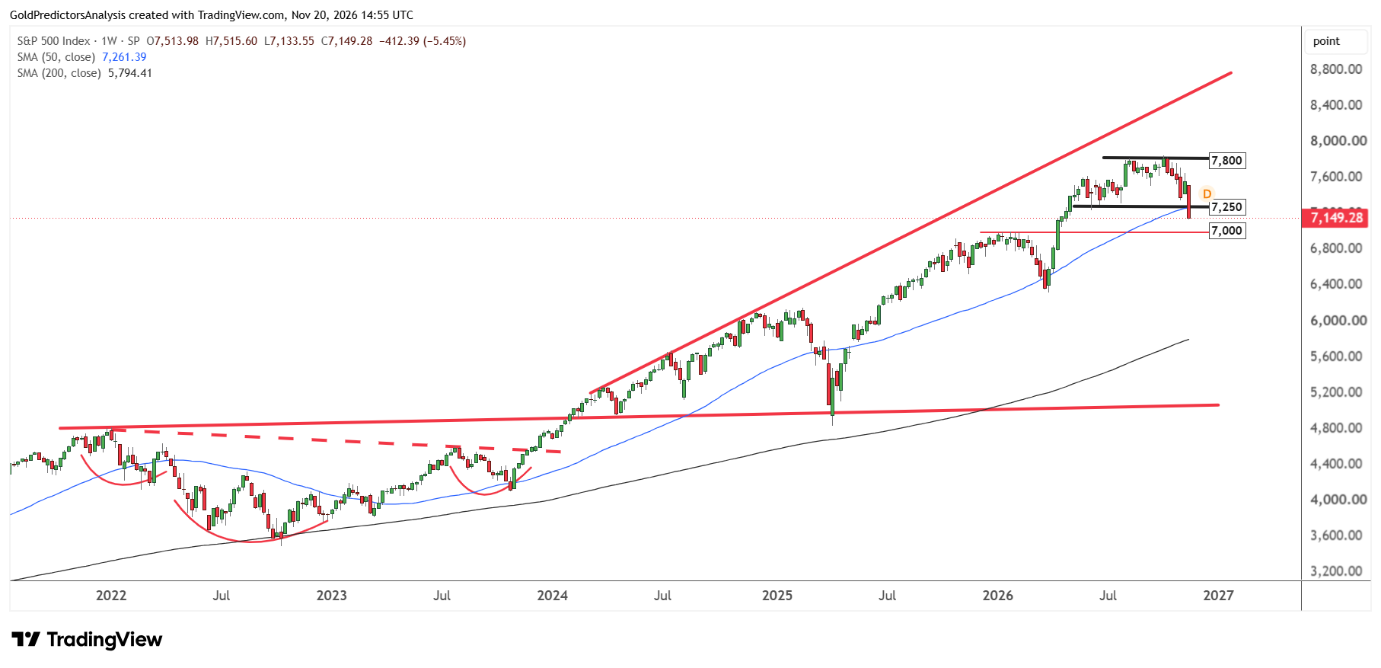
The chart shows that each correction in the S&P 500 has produced a bottom. For example, the deeper correction in April 2025 triggered strong rally to mark a new record high. The correction in April 2026 triggered another rally in the S&P 500. Therefore, this correction in the S&P 500 may offer potential for strong rebound.
The key support zone in the S&P 500 in the short term is seen on the daily chart. It is observed that the index has moved below the 200-day SMA which suggests further weakness. The break below 7,250 suggests further downside.
What to Watch Next for S&P 500
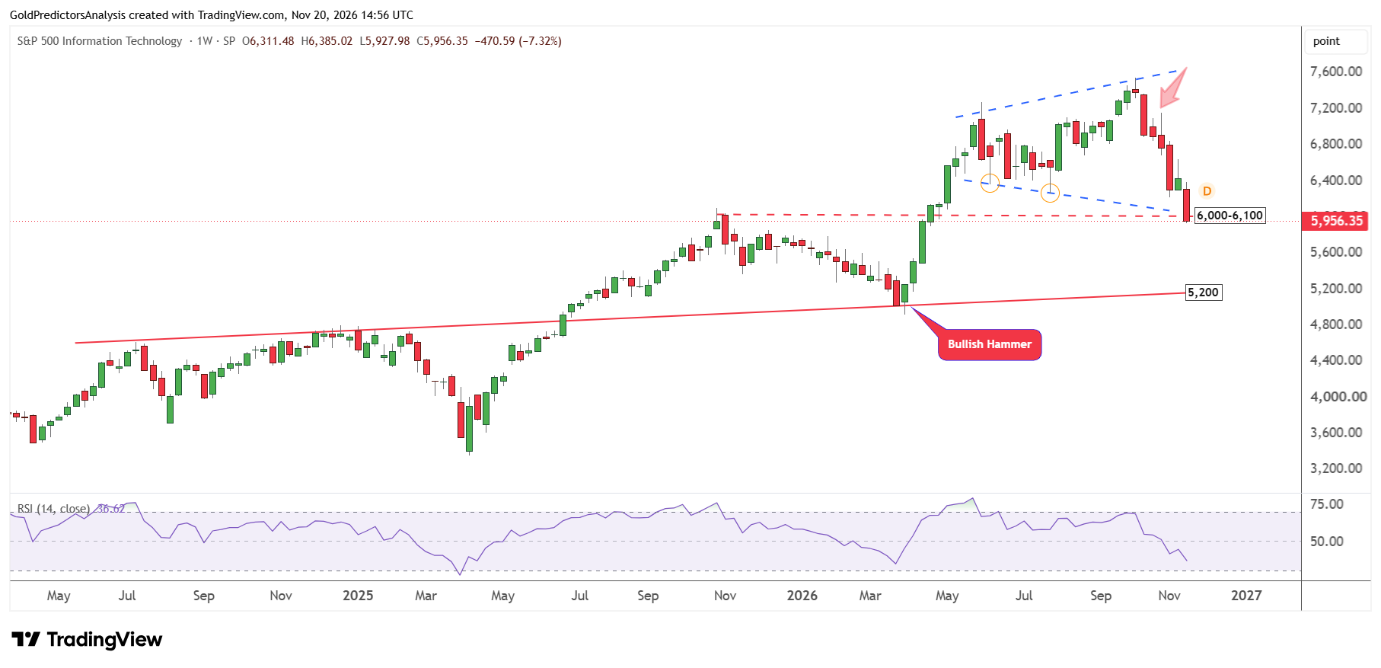
The US stocks continue to decline this week and remain under pressure. The chart below shows that the S&P 500 technology index remains under pressure near the support at 6,000-6,100 which is defined by the symmetrical broadening wedge pattern. The bearish pressure in the technology index near the support increases the risk of deeper correction in technology stocks.
The chip stocks also remain under pressure as the semiconductor index dropped significantly during the past five months. But the semiconductor stocks are also facing support at the key level of 9,000, as seen in the chart below. A weekly close below this level will increase the risk of deeper decline in chip stocks.
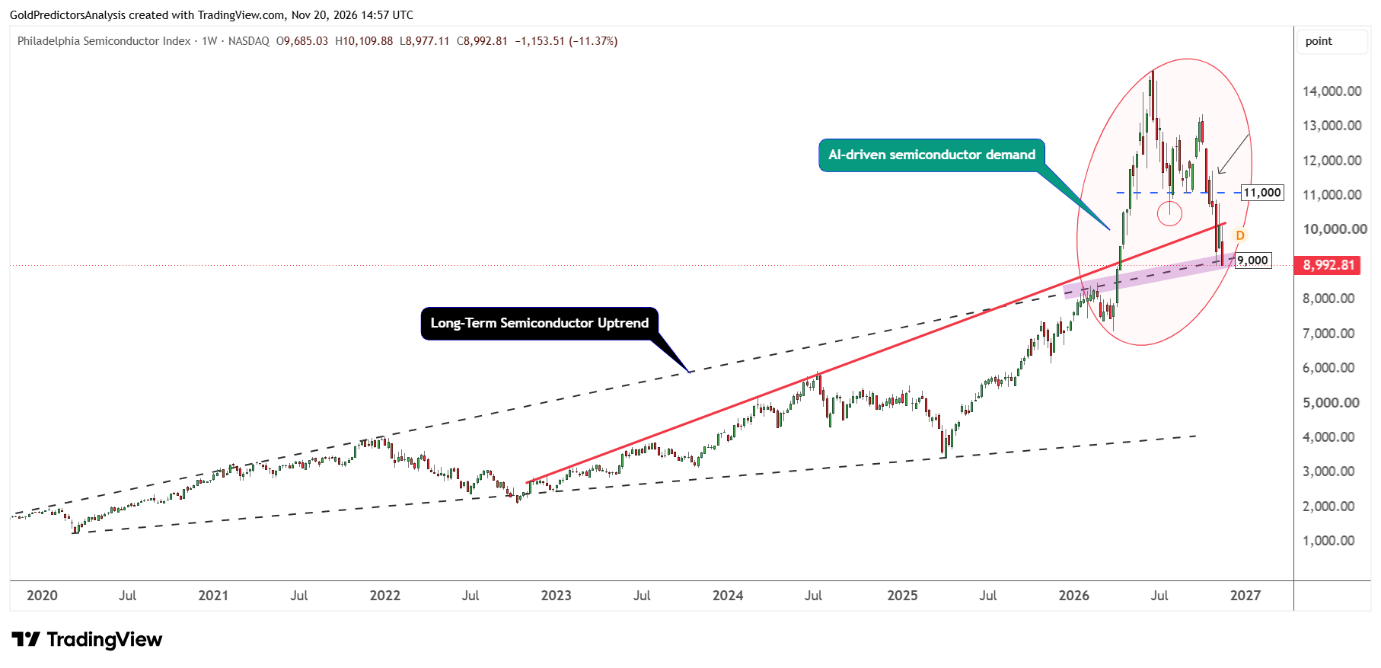
A recovery in S&P 500 above 7,250 and a rebound in technology and semiconductor indices create the case for a strong recovery if these support levels hold. But expectations for Fed rate hikes continue to provide support to US dollar and US Treasury yields and limit the rebound in the S&P 500.
The break below 7,250 suggests that the index may drop further towards 7,000 in the short term. If the index holds 7,000 and recovers above 7,250, it may create a strong rally higher. A break above 7,800 may open the way for further upside towards 8,000. The next move in S&P 500 will likely depend on changes in expectations for interest rates in the US.