



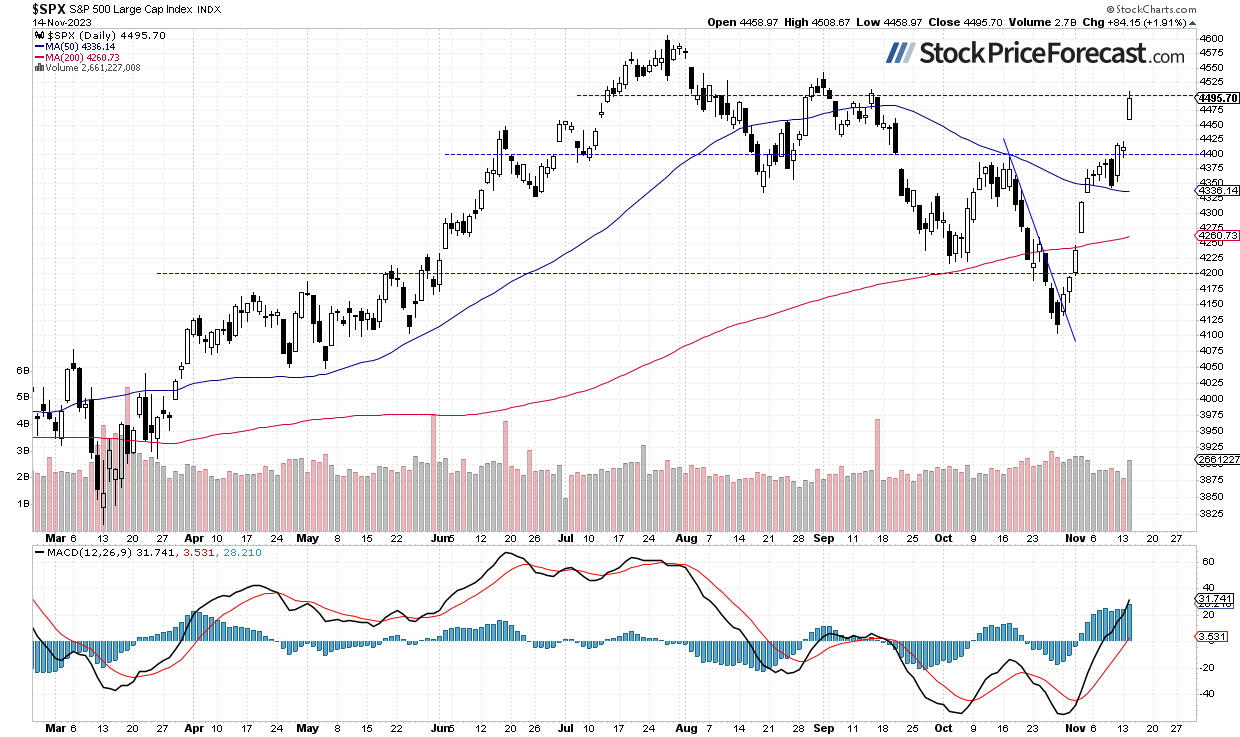
It reached new local high of 4,508.67 and it was the highest since mid-September. Recently the index broke above the resistance level marked by the technically important September 21 daily gap down of around 4,376-4,401. Stocks rallied despite uncertainty about monetary policy, economic growth and geopolitics. The market resumed its rally from October 27 local low of 4,103.78.
US Dollar Index Price Forecast
Every new US Dollar Index analysis as it publishes, today's technical signal and key levels, live price — on one page.
See all US Dollar Index forecastsStocks will likely open 0.3% higher this morning following lower-than-expected PPI release and higher-than-expected Retail Sales, Empire State Manufacturing Index releases. The S&P 500 is now close to the 4,500 level as we can see on the daily chart:
Futures Contract Trades Above 4,500
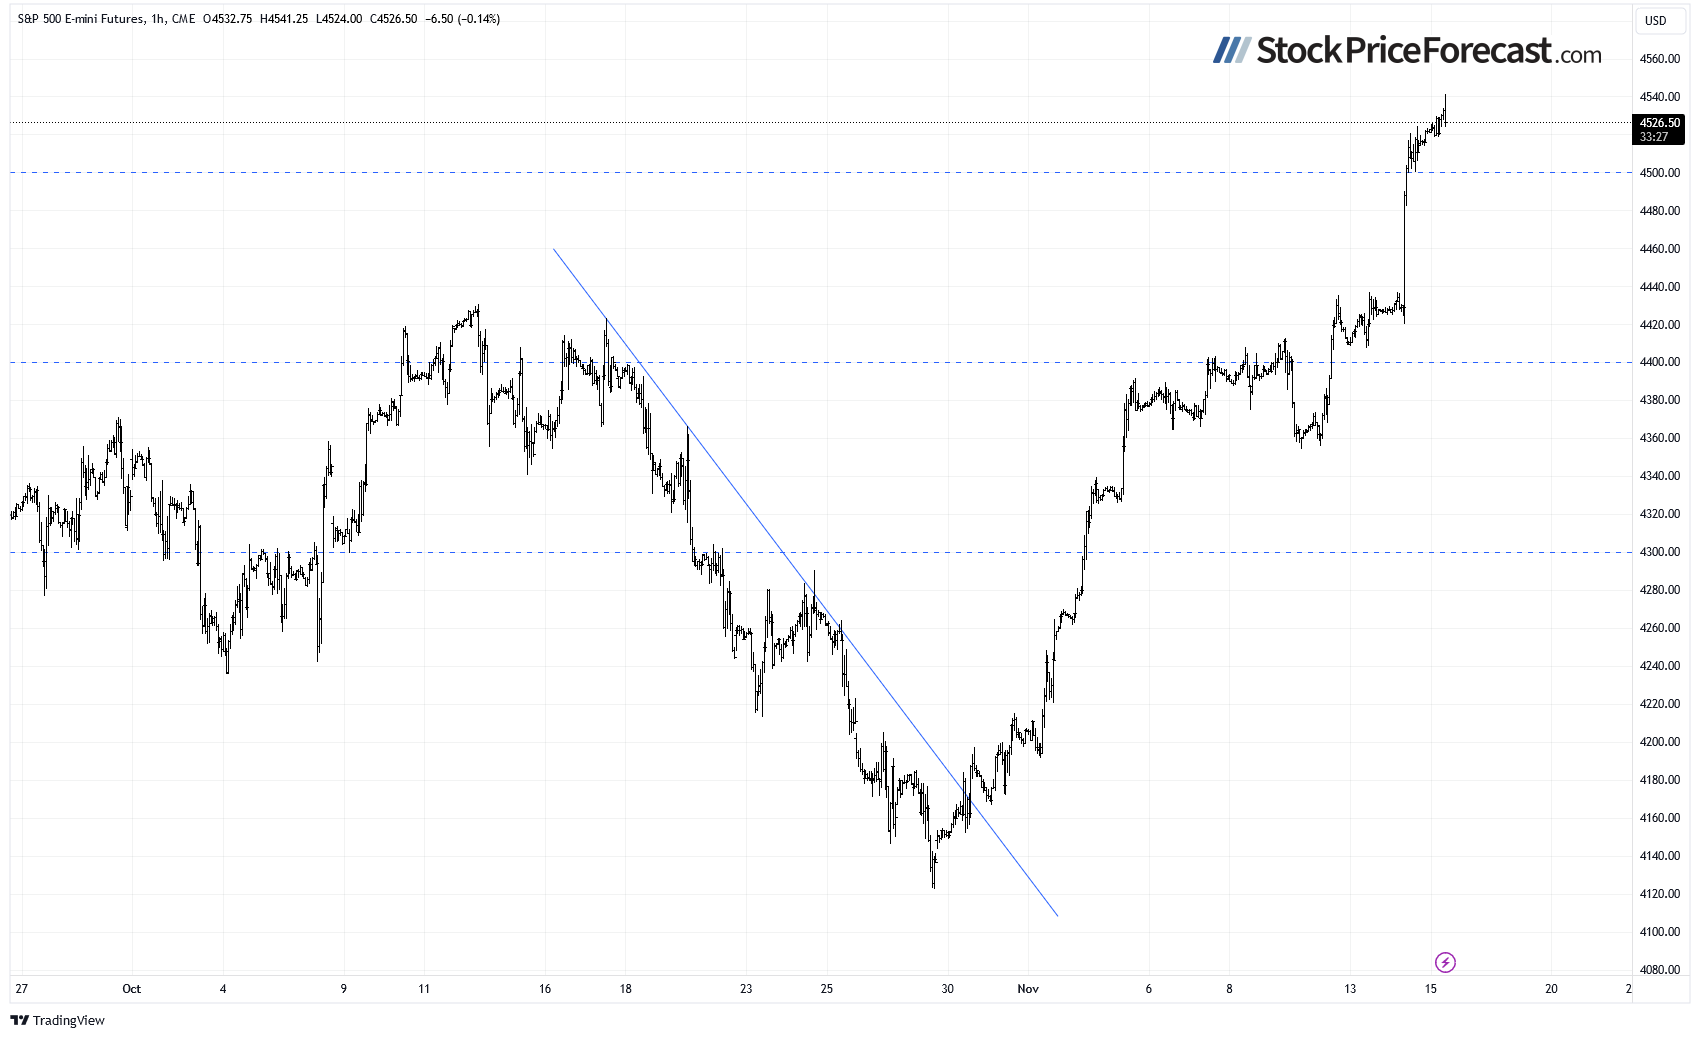
Let’s take a look at the hourly chart of the S&P 500 futures contract. The market accelerated the rally and it broke above the 4,500 level yesterday. The resistance level is now at around 4,550-4,570, marked by the previous local high. On the other hand, the support level is at 4,480-4,500.
Conclusion
The S&P 500 index has further accelerated its uptrend on positive economic data, weakening U.S. dollar. There have been no confirmed negative signals so far. However, there are short-term overbought conditions that may lead to consolidation or a correction at some point.
Here’s the breakdown:
- The S&P 500 trades along the 4,500 level following yesterday’s CPI release.
- There may be a consolidation or downward correction at some point.
- In my opinion, the short-term outlook is still bullish.