



The U.S. dollar has surged above its previous 2026 high, putting an important weekly breakout attempt on the table. Gold, meanwhile, is moving in a very different direction, with bearish candlestick warnings and renewed pressure on key technical support.
But the action doesn’t stop there.
Silver is attempting another recovery after Tuesday’s bearish reversal, platinum keeps struggling with a familiar resistance cluster, and palladium has launched a particularly impressive bullish counterattack.
Copper? Its buyers and sellers are still fighting over a technical boundary that neither side seems willing to surrender.
The big question is whether today’s bullish attempts can survive their next encounter with resistance and whether the bears can finally force decisive breakdowns.
Let’s explore two particularly important developments.
U.S. Dollar (DX.F) – A Breakout Across Three Time Frames?
The dollar bulls have finally delivered the kind of offensive that the market has been waiting for.
After several sessions of consolidation, Wednesday’s buyers pushed the index through Monday’s bearish gap at 102.11-102.18, recovered the important 102.36-102.49 resistance combination, and challenged the previous 2026 high. That’s a substantial achievement.
Gold Price Forecast
Every new Gold analysis as it publishes, today's technical signal and key levels, live price — on one page.
See all Gold forecastsD1: An Important Breakout Attempt
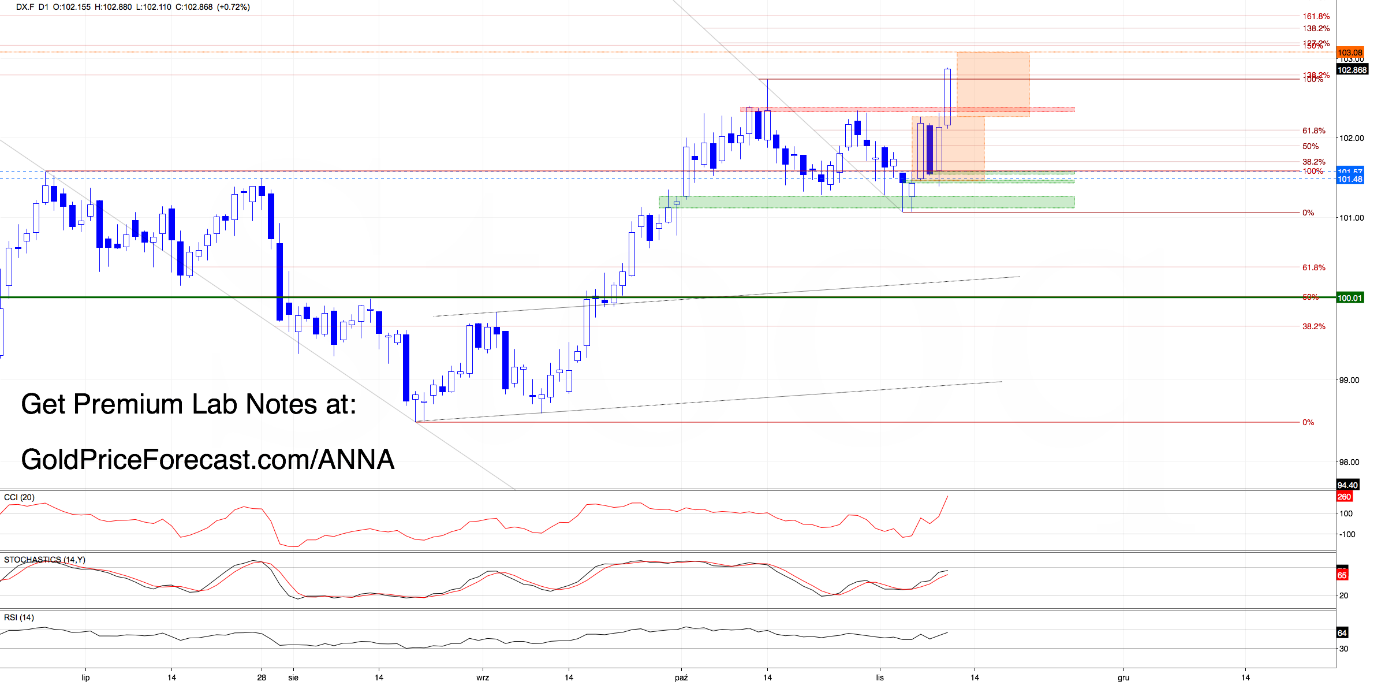
From today’s perspective, we see Wednesday’s advance carried the dollar above the October 14 high at 102.73. Thanks to this price action, the index also increased above two major Fibonacci levels, which provide a particularly important reference:
- 102.36: the monthly 38.2% retracement of the October 2022-February 2026 decline.
- 102.49: the weekly 50% retracement of the January 2025-February 2026 decline.
Additionally, the dollar has another bullish development working in its favor: a breakout above the upper line of the orange consolidation (101.44-102.26).
Why does all that matter?
Because a daily close above 102.73 would confirm a meaningful breakthrough and strengthen the case for additional gains. In other words, if buyers confirm the breakout above the previous peak, the orange consolidation’s height points toward a minimum upside target near 103.08. Beyond that, two Fibonacci extensions – 127.2% and 150% – establish the next resistance area at 103.17-103.20.
But the story doesn’t end there.
W1: Will This Breakout Finally Hold?
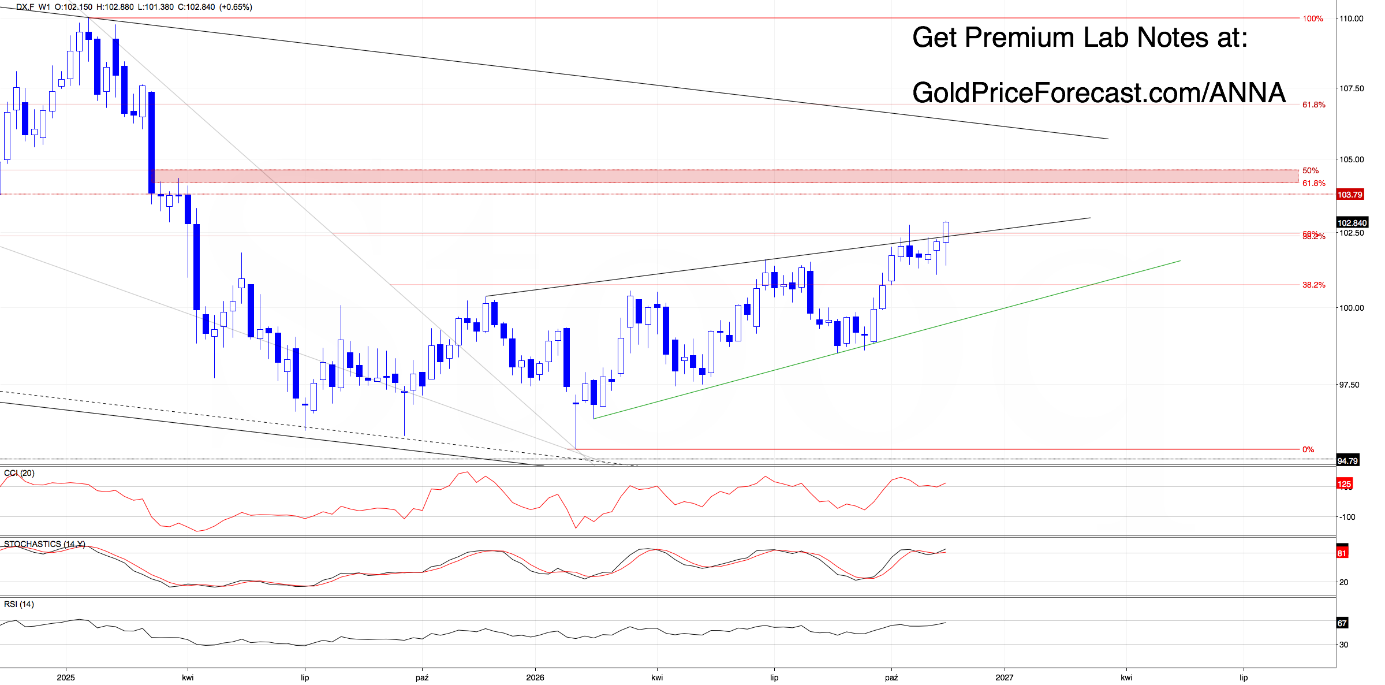
At the same time, on the weekly chart, buyers are also attempting to overcome the upper boundary of the rising wedge, which could be a considerably more important technical development than Wednesday’s impressive daily rally.
However, there’s a reason for caution.
Why?
Because we witnessed a similar breakout attempt around mid-October, and buyers failed to maintain it.
Moreover, negative divergences on the weekly Stochastic and CCI warn that momentum hasn’t been strengthening as convincingly as price.
The index may be trading above the wedge’s upper boundary now, but a weekly close is still required to confirm the breakout. At this point, it is worth noting that a return inside the formation by Friday would raise concerns about another failed attempt.
M1: The Most Important Resistance Is Still Ahead
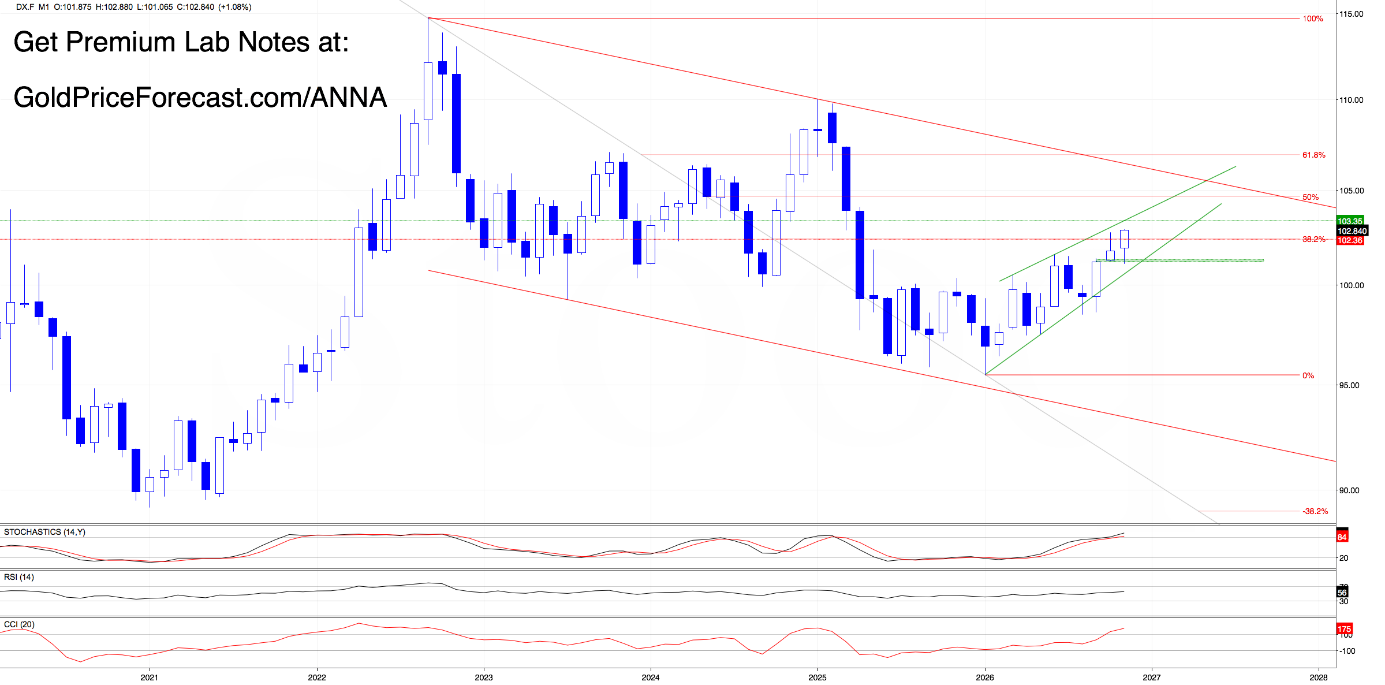
The monthly chart adds the final piece of the puzzle.
The dollar is advancing toward the upper boundary of its green rising wedge, currently near 103.35. Additionally, examining the daily chart we’ve identified an additional Fibonacci extension at 103.39. Together, they form the 103.35-103.39 resistance zone, which could be the most important obstacle in the dollar’s present longer-term structure.
Reaching that area would be a major test for buyers, even if the daily and weekly breakouts are confirmed and because this is a monthly formation, any decisive breakout or rejection will ultimately require evaluation in the context of the November monthly close.
What Could Go Wrong?
There are two distinct warning signals to watch.
First, a daily close back below 102.73 would invalidate the breakout above the previous 2026 high. That wouldn’t necessarily invalidate the breakout from the orange consolidation, but a comeback below 102.26 would also put that consolidation breakout at risk.
An additional weekly close back inside the black rising wedge would create a more serious warning.
The daily CCI has surged to approximately +260, highlighting strong momentum but also suggesting that a short-term pullback or profit-taking could emerge near resistance.
Daily Takeaways: a confirmed breakout above 102.73 would favor 103.08, followed by 103.17-103.20. Beyond those targets, the key longer-term resistance lies at 103.35-103.39. Watch 102.73, 102.26, and Friday’s weekly wedge boundary for signs of a failed breakout.
Bottom Line: dollar bulls have made significant progress, but their most important tests aren’t over. The daily breakout looks promising; the weekly and monthly charts still demand proof.
Gold (GC.F) – Two Bearish Engulfing Formations Put the Bulls on Notice
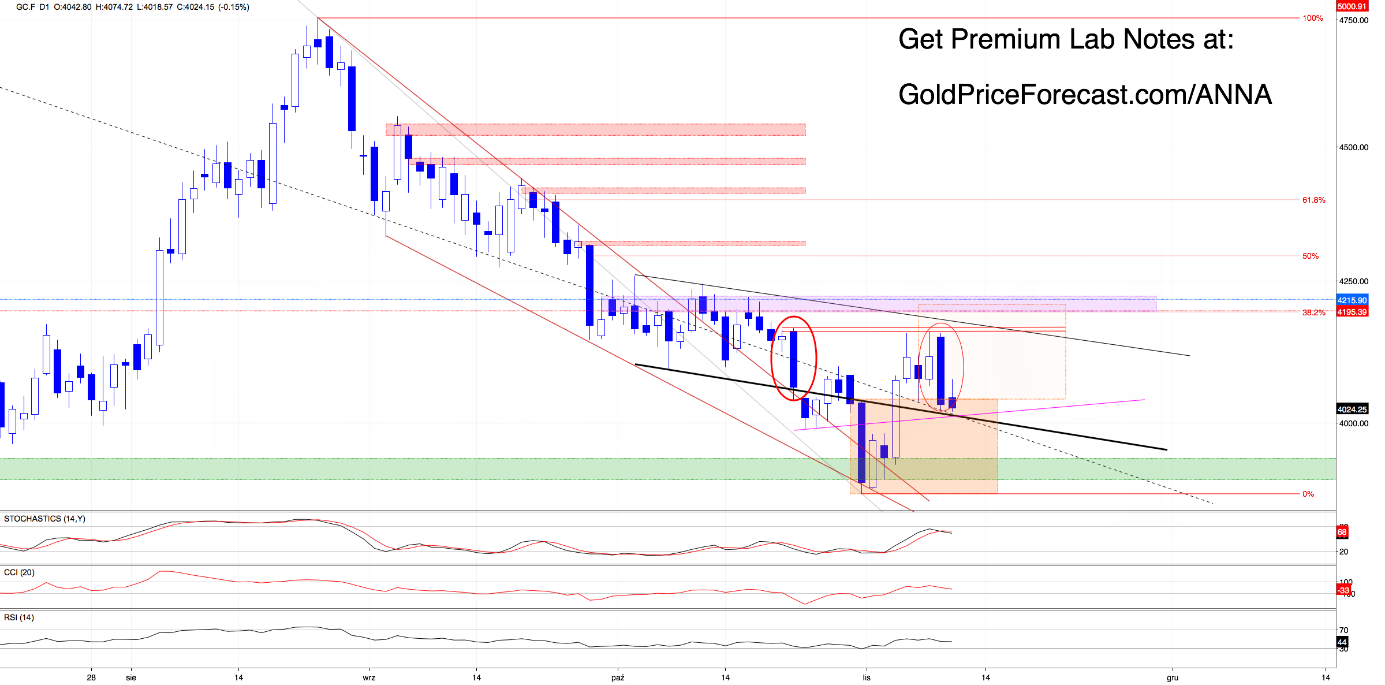
Gold‘s buyers are running out of convincing arguments.
Tuesday delivered another bearish engulfing candlestick formation, adding to the earlier warning associated with the October 22 bearish engulfing. Additionally, the latest selling pressure has pushed gold back below the upper boundary of the orange consolidation near 4038, undermining the bullish case built around its earlier breakout.
Wednesday hasn’t brought a convincing recovery.
Despite an intraday attempt to rebound, the yellow metal has struggled to hold above 4038, keeping bearish pressure firmly in focus. On top of that, the daily Stochastic has now generated an additional sell signal. Therefore, when we combine it with the two above-mentioned bearish engulfing formations, we have an uncomfortable collection of warnings.
However, there’s a particularly important technical development beneath the surface.
The Weekly Chart Is Approaching a Critical Test
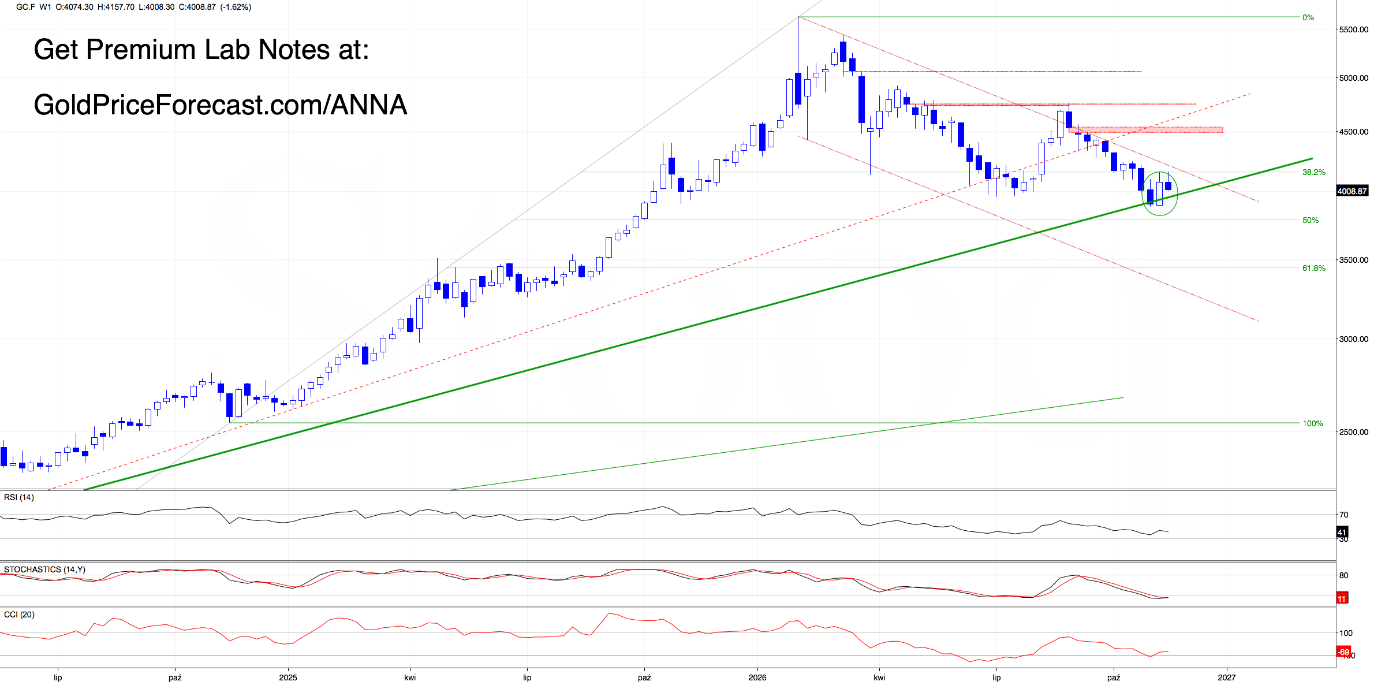
Gold is now threatening the lower boundary of the black declining channel on D1 and the psychological 4000 barrier.
If sellers confirm a breakdown through those supports, attention could shift toward a far more consequential level.
What do we mean by that?
The weekly chart shows that the key long-term rising green support line is currently near 3955-3960 and this isn’t just another short-term price reference. It’s an important element of the broader bullish structure. Therefore, a test of that trendline would carry much greater significance than an ordinary daily pullback.
What Would Change the Outlook?
For now, recovering 4038 would be a useful first step, but hardly sufficient to erase the recent bearish warnings. In our opinion, we would need to see gold overcome 4159-4164 on a daily closing basis before treating both bearish engulfing formations as meaningfully invalidated. Until then, rallies remain vulnerable to renewed selling pressure.
Additionally, the dollar’s attempted breakout adds another potential headwind, particularly if the index confirms its own upside targets. That relationship isn’t automatic, of course, but it increases the importance of watching both markets together.
Daily Takeaways: the immediate battleground includes 4038, the black declining channel’s lower boundary, and 4000. A confirmed breakdown would expose long-term weekly support near 3955-3960. A convincing bullish recovery requires much more than a brief rebound; 4159-4164 remains the crucial invalidation area.
Bottom Line: Gold’s technical picture is deteriorating. Two bearish engulfing formations, a daily Stochastic sell signal, and pressure on important support argue for caution until buyers deliver a much more convincing response.
What About Silver, Platinum, Palladium, and Copper?
Beyond the dollar and gold, four other markets are approaching potentially important technical decisions.
Silver received a fresh bullish opening gap and staged an intraday recovery, but buyers have struggled to maintain their advance above important resistance lines. With Tuesday’s bearish engulfing still casting a shadow, is this the beginning of a genuine recovery or merely another temporary rebound?
Platinum has encountered the same formidable resistance combination for a third consecutive session. Despite improving momentum indicators, buyers haven’t delivered a convincing breakthrough. Another rejection could revive the downside targets we discussed earlier this week.
Palladium has finally launched a serious attack on its overlapping bearish gaps, moving above both intraday. That’s a meaningful development but can buyers confirm the breakout before the closing bell?
And copper continues its unusually persistent battle around the lower boundary of a declining channel. A fresh bullish gap has helped buyers stage another recovery, but the outcome could have implications extending well beyond the daily chart.
Each of these markets presents a different technical challenge.
Final Thought – The Difference Between Trying and Succeeding
One of the most interesting things about technical analysis is how quickly an apparently convincing market move can lose its significance.
A breakout may look impressive during the session, only to disappear before the closing bell. A bearish reversal may seem decisive, until buyers return and reclaim the lost ground. And sometimes, the market simply refuses to choose a direction.
That’s why we pay attention not only to the levels prices reach, but also to the levels they can actually hold.
Wednesday has brought several promising attempts and a few serious warnings. The next closing prices will help us distinguish between the two.
Anna