


The S&P 500 is trading around 7,600 points, but the Bradshaw Predictor Model (BPM) estimates its historical fair value at just 2,825 points. With valuations approaching unprecedented territory, I believe investors should seriously reconsider the risks of chasing this bull market.
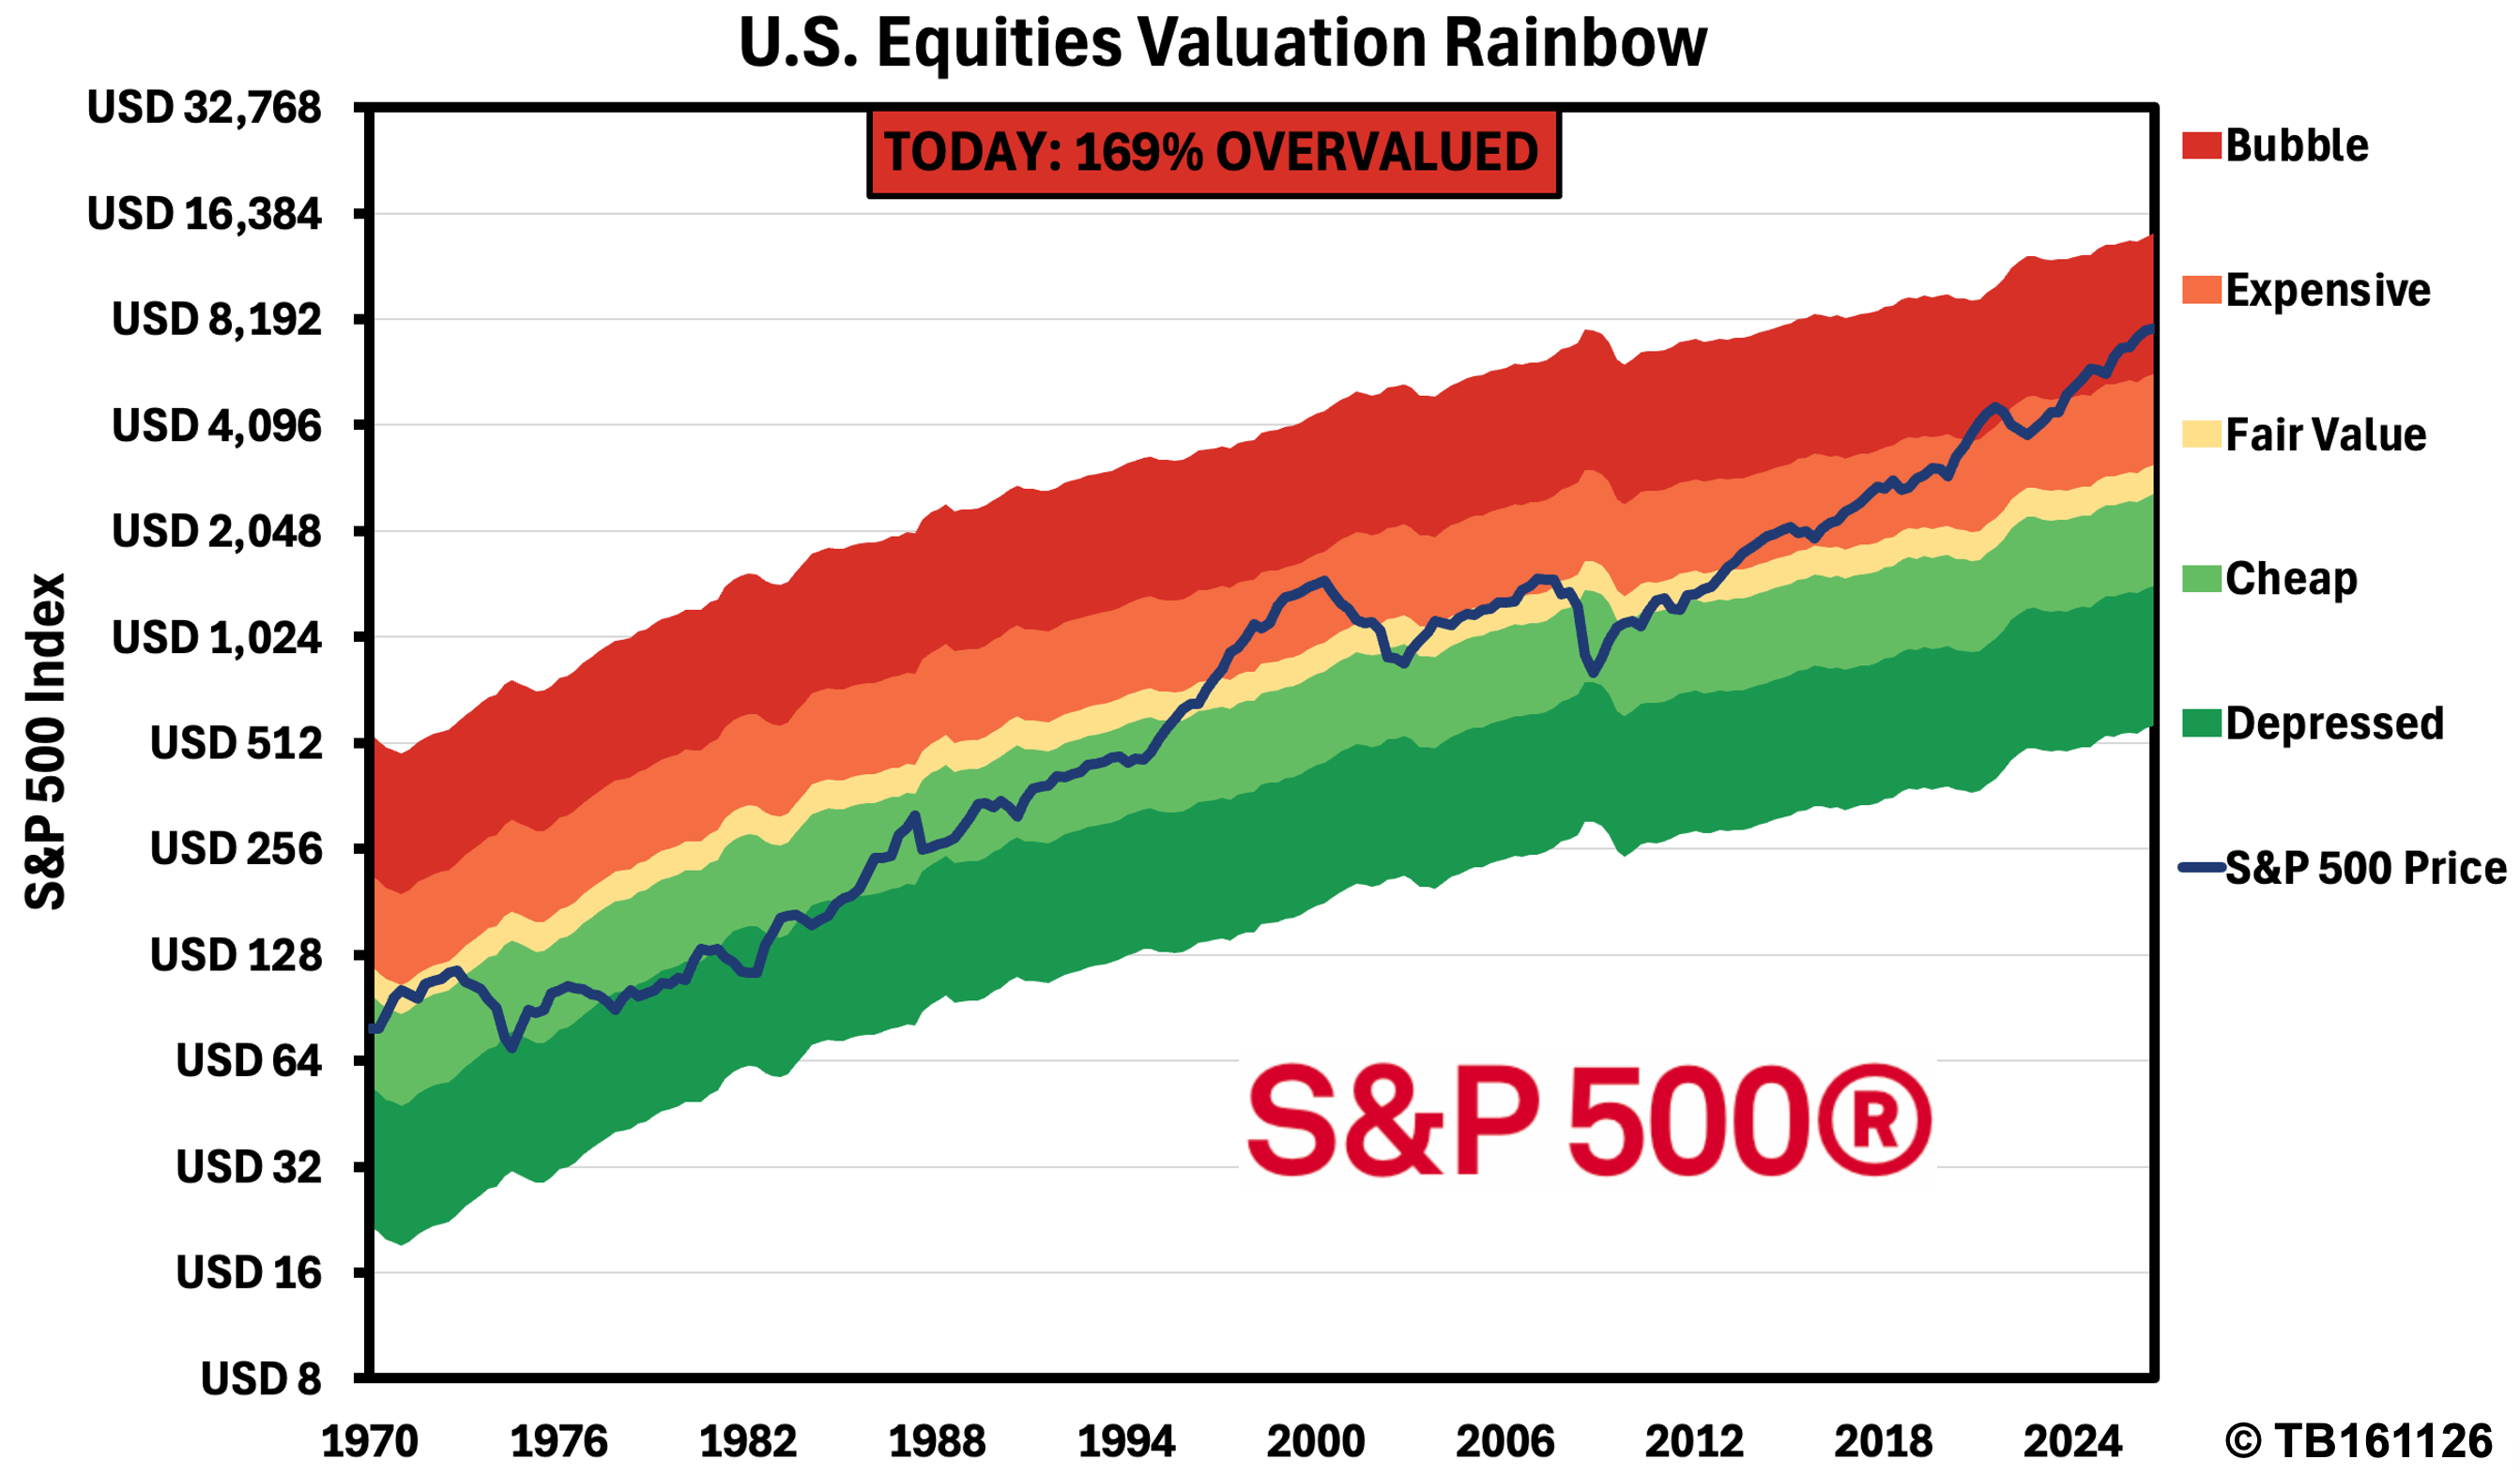
There is an uncomfortable conclusion emerging from the BPM. Despite the S&P 500 trading near record highs, my model estimates that the index’s historical fair value is 2,825 points. That implies an extraordinary 169% overvaluation.
What is the BPM, you say? It’s a model I have developed over the last six years which, based on valuation, momentum and market environment signals across 44 global markets, would have generated annualised returns of 21.5% over the past 56 years.
Put simply, investors are paying almost three times the model’s estimate of fair value. This is particularly concerning because the current valuation is not simply elevated by historical standards. It is considerably more extreme than during several previous market peaks.
This Isn’t 1999. It’s More Extreme.
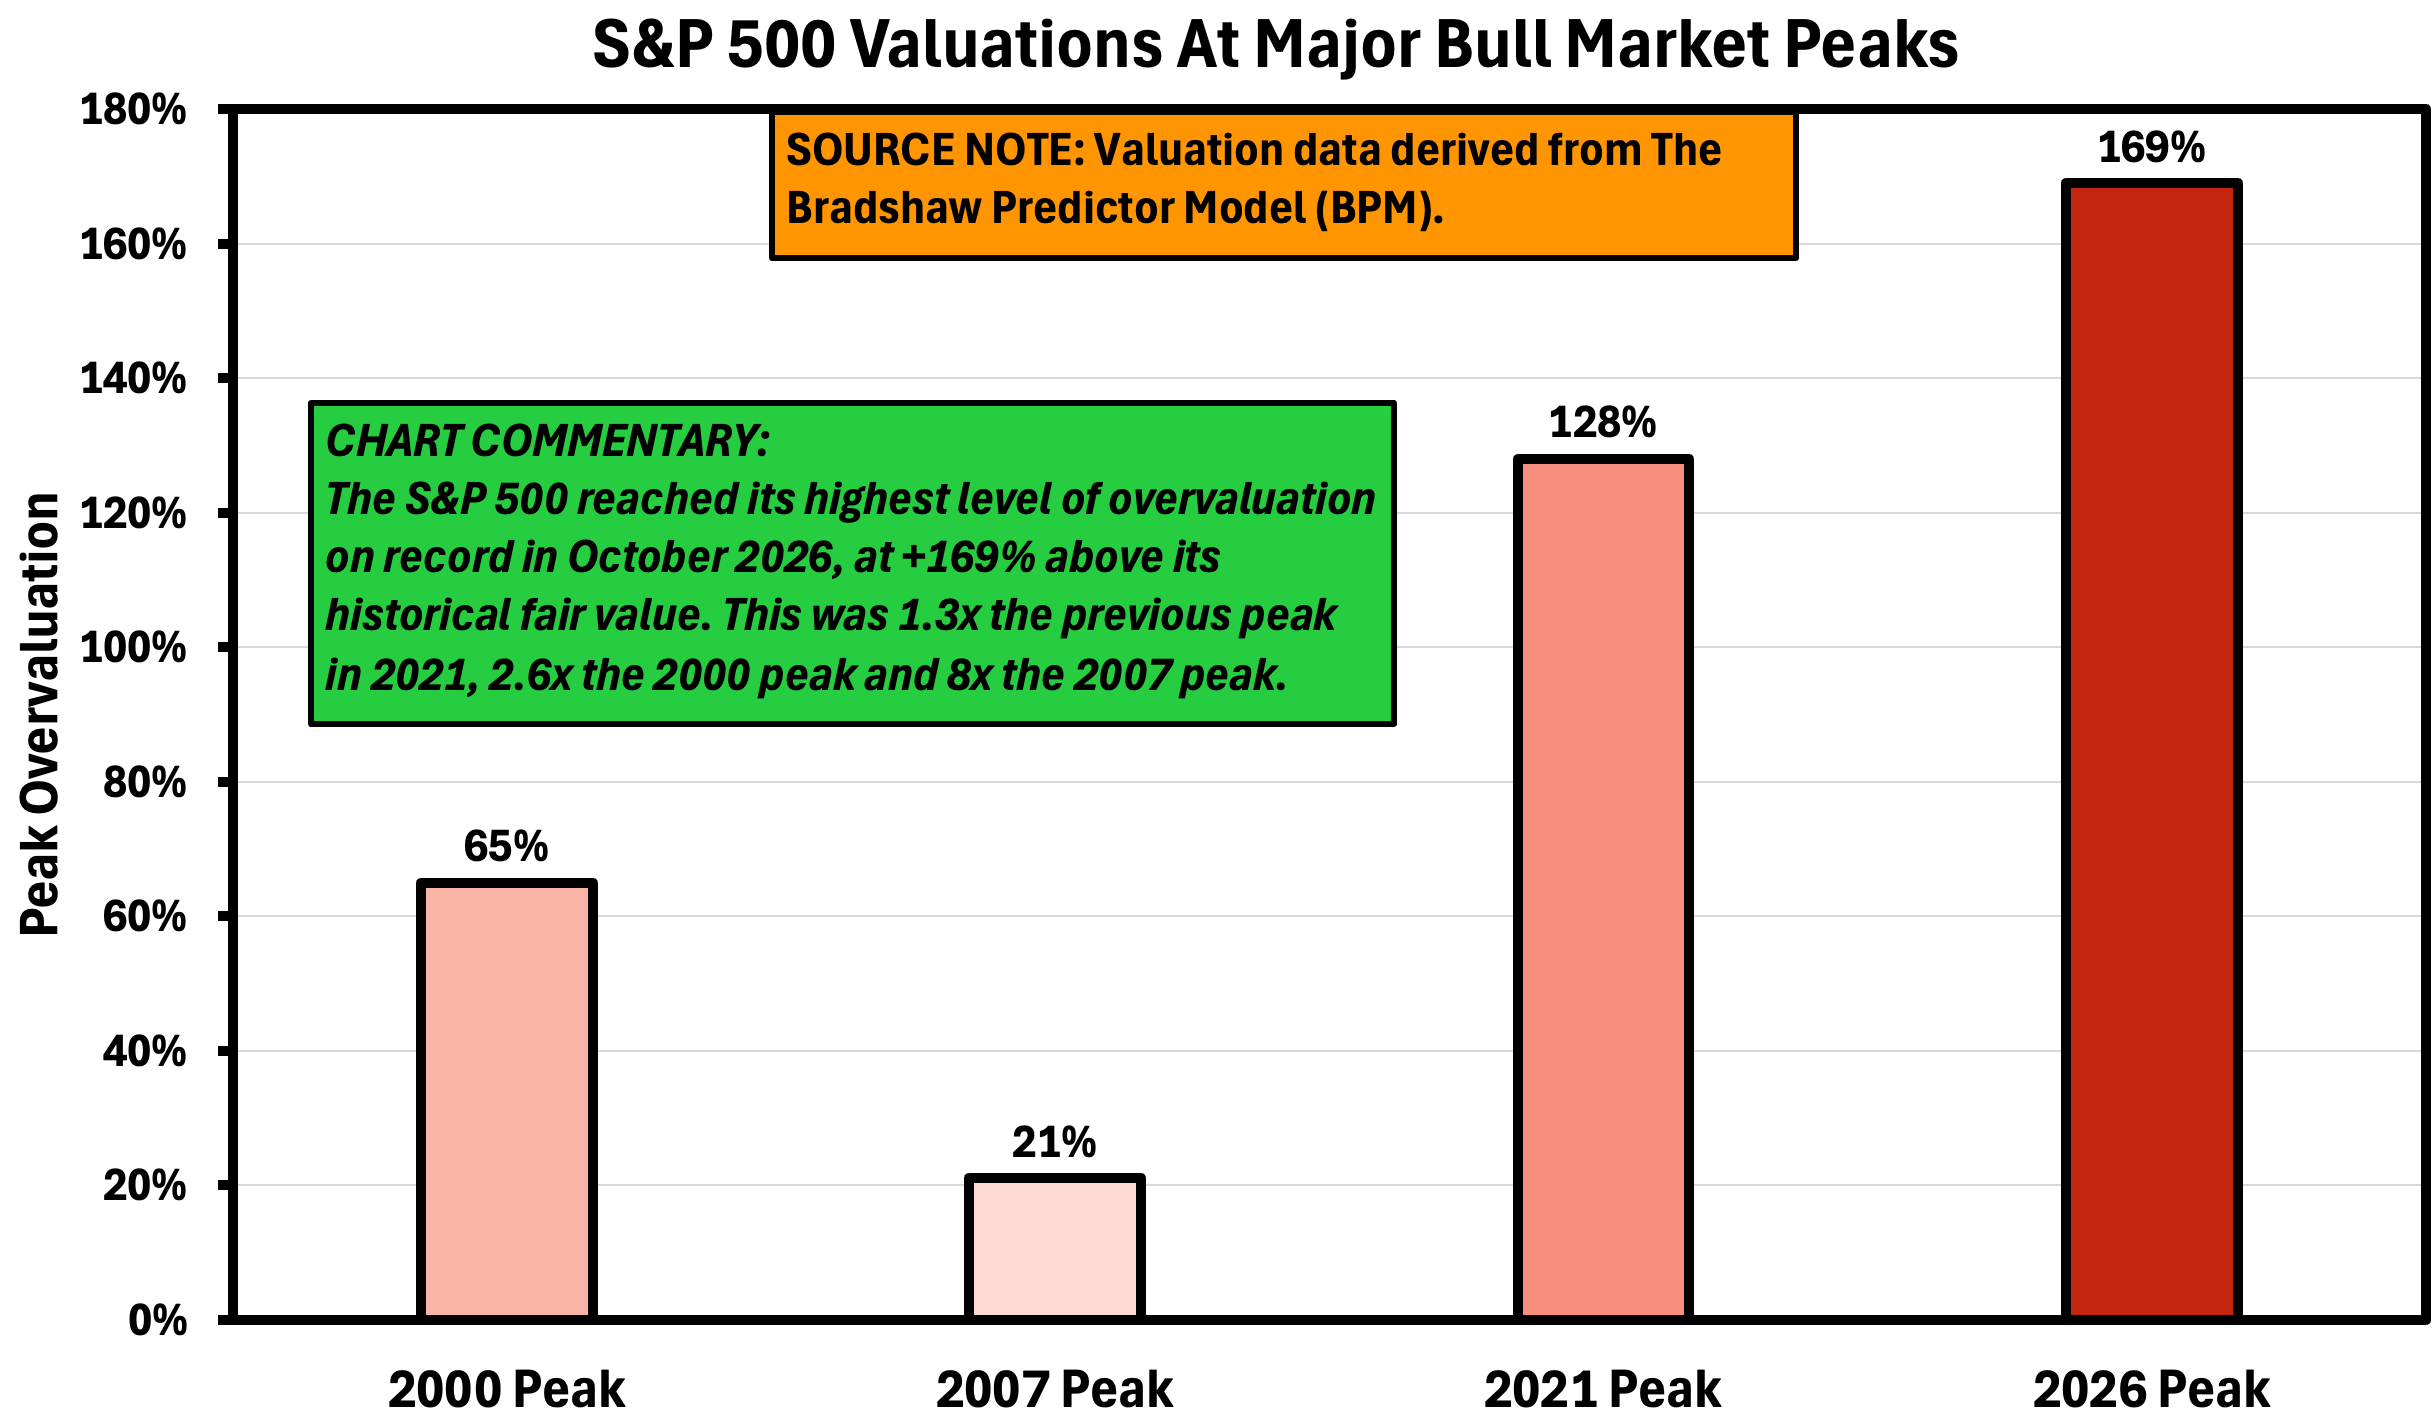
The scale of today’s valuation becomes clearer when comparing it with previous market peaks. According to BPM, the S&P 500 is currently:
- 1.3 times more expensive than December 2021.
- 2.6 times more expensive than March 2000.
- 8 times more expensive than October 2007.
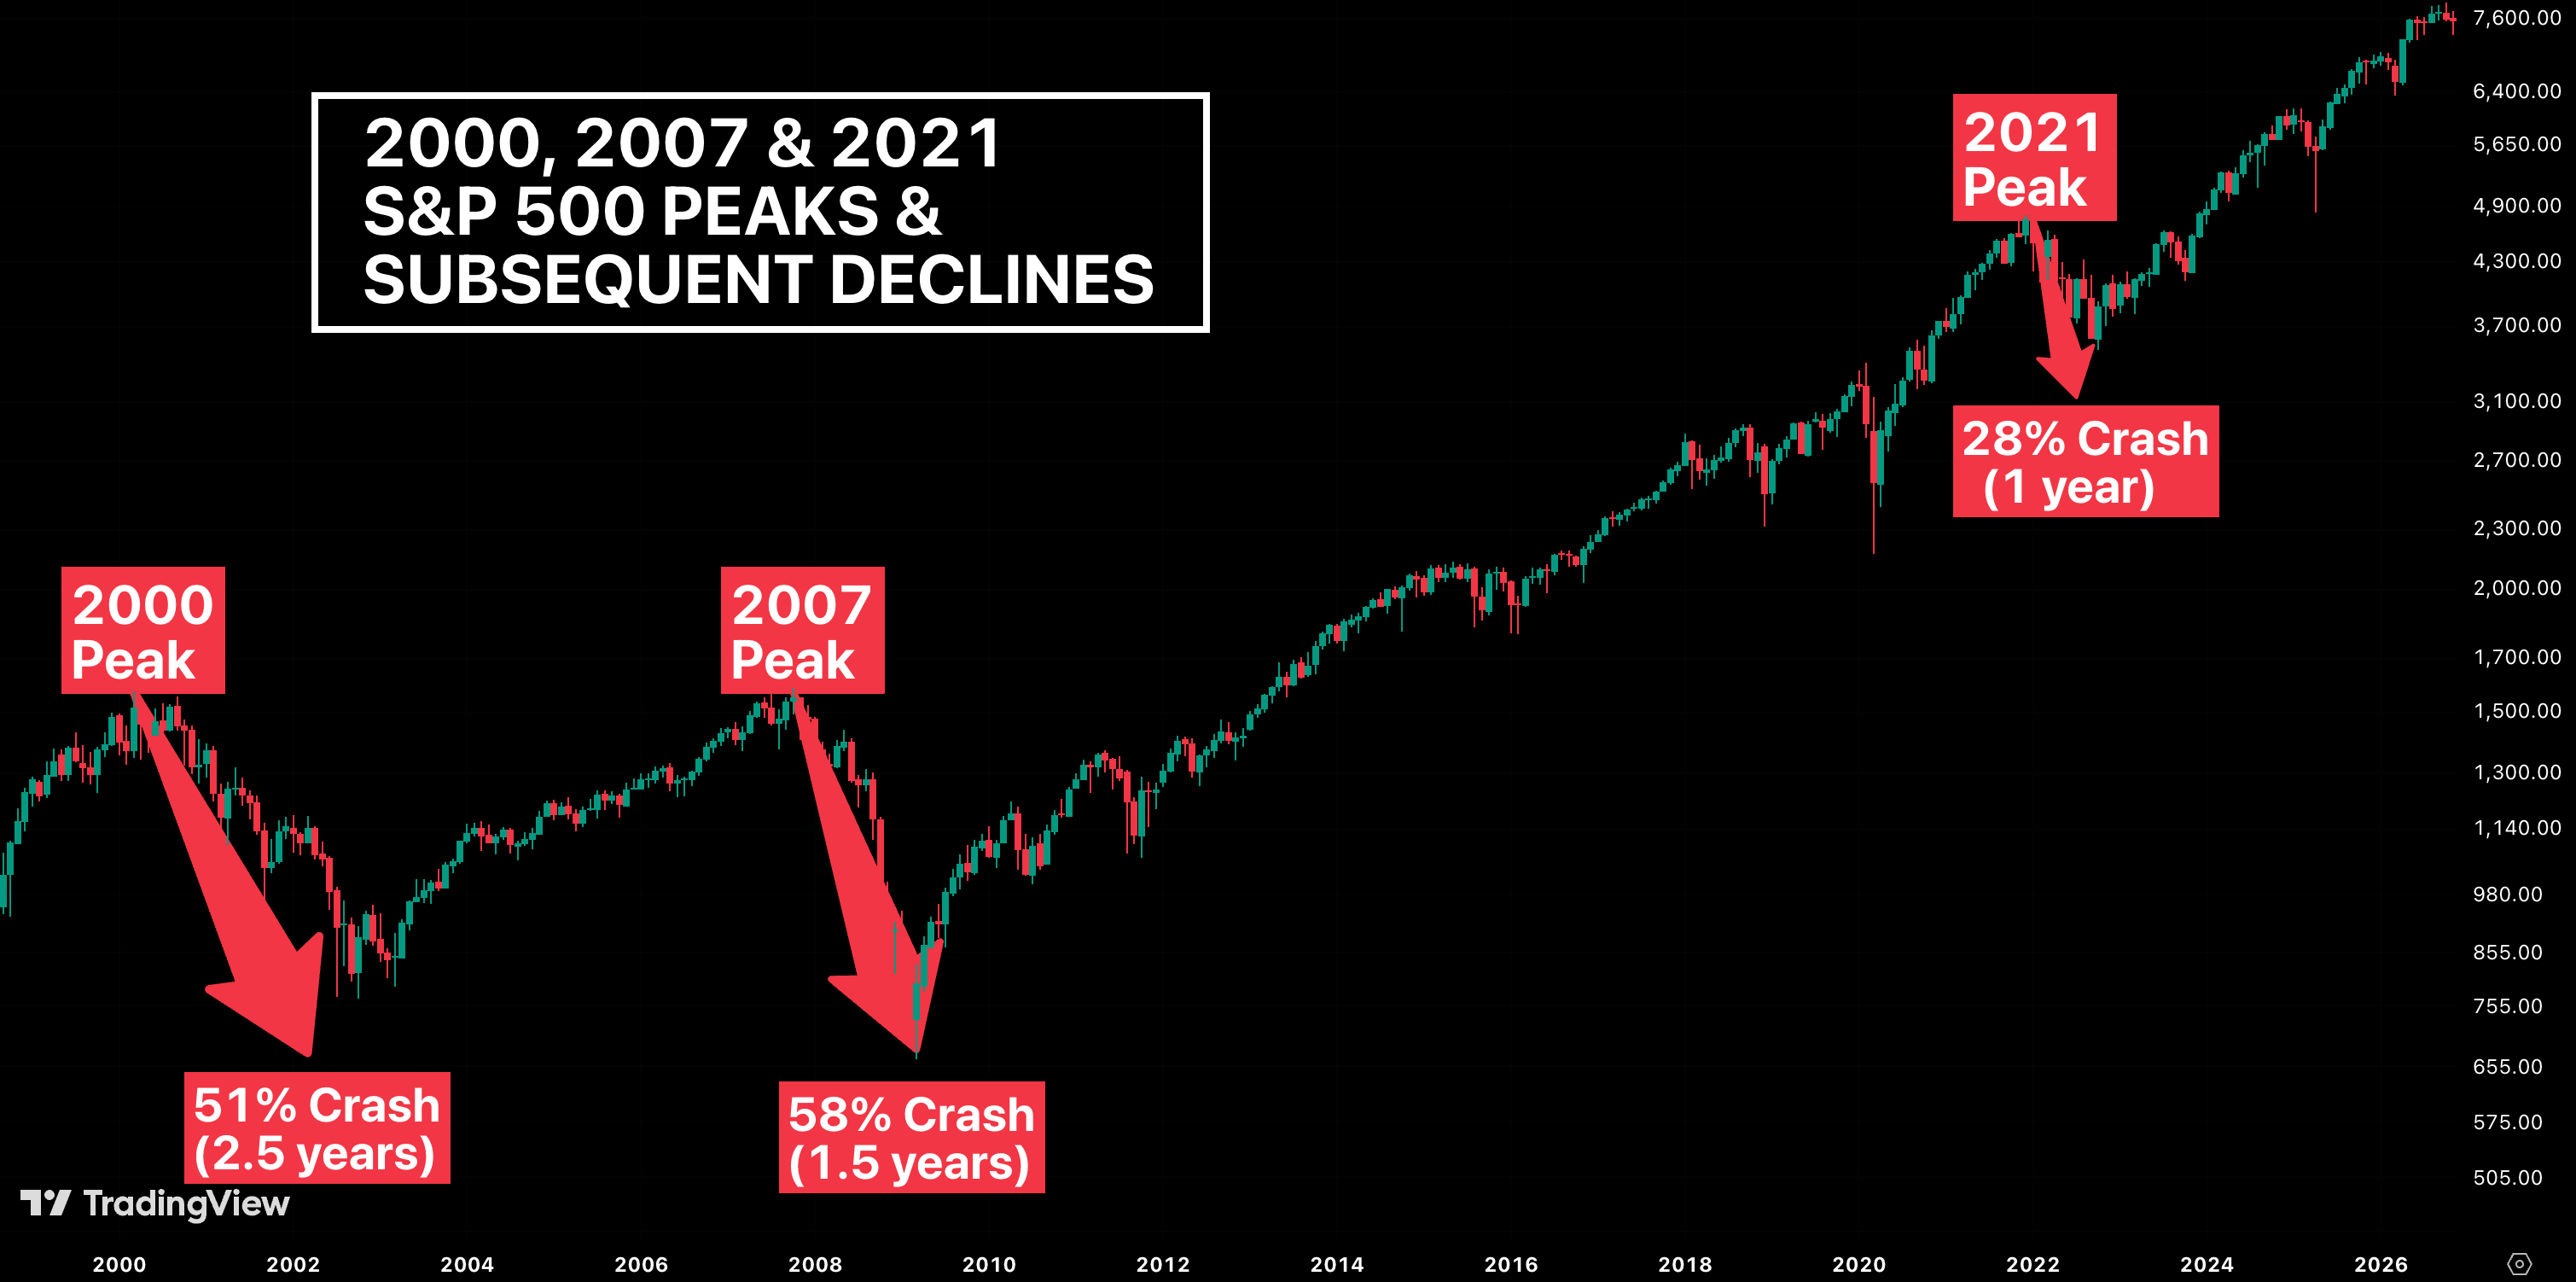
Each of these periods preceded a significant market downturn. The 2022 bear market produced a decline of 28%, the bursting of the dot-com bubble resulted in a 51% decline, and the Global Financial Crisis wiped 58% off the S&P 500.
Yet today’s valuation exceeds those previous extremes. That does not guarantee another collapse, but it does raise an important question: how much further can valuations stretch before investors begin questioning what they are actually paying for?
S&P 500 Price Forecast
Every new S&P 500 analysis as it publishes, today's technical signal and key levels, live price — on one page.
See all S&P 500 forecastsWhat History Tells Us About The Downside
The historical readings from the BPM are particularly revealing. At the March 2000 market peak, the model identified the S&P 500 as 65% overvalued. By March 2003, following the dot-com collapse, the index had fallen to 25% below estimated fair value. A similar pattern emerged during the Global Financial Crisis. In October 2007, the model indicated 21% overvaluation. By March 2009, the market had fallen to 89% below fair value. Today’s reading is 169% overvalued.
So what would a comparable valuation adjustment mean for investors? There are three scenarios worth considering:
Scenario 1: A Return to Fair Value: 2,825 Points
If the S&P 500 simply returned to its estimated fair value, it would decline 63% from its current level.
Scenario 2: A Repeat of 2003: 2,260 Points
If the market subsequently reached the same 25% undervaluation recorded in March 2003, the index would fall 70%.
Scenario 3: A Repeat of 2009: 1,500 Points
An 89% undervaluation, comparable to March 2009, would imply an index level of 1,500 points, representing an 80% decline.
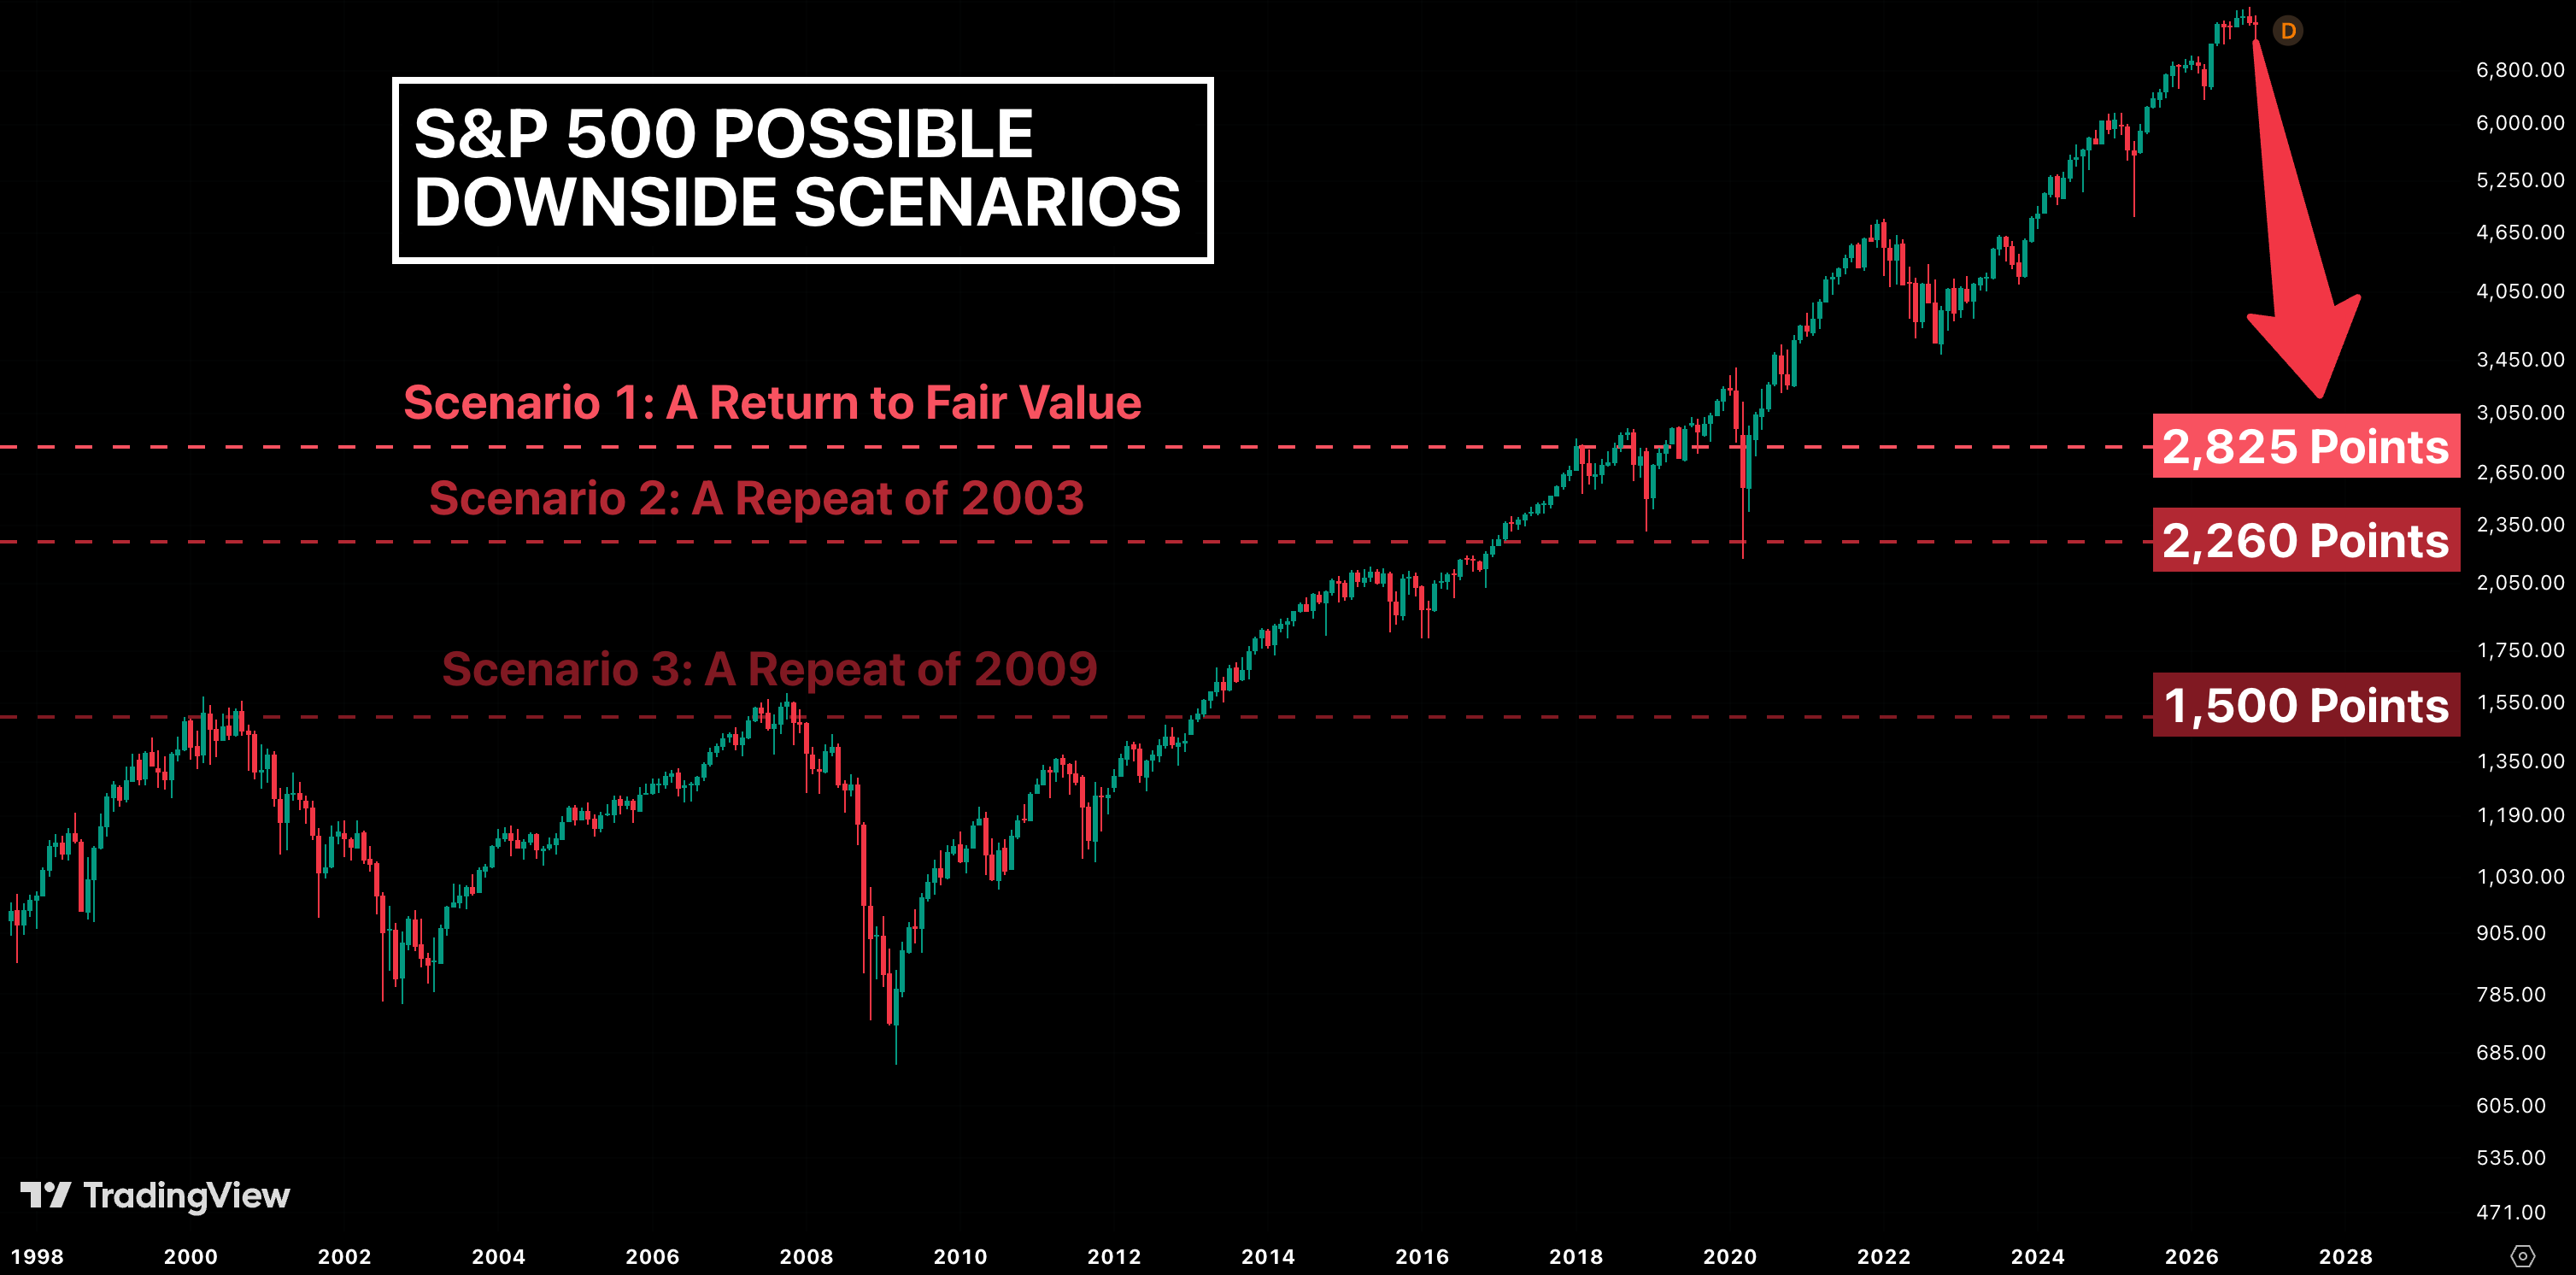
These are illustrative valuation scenarios, not forecasts or price targets. There is no guarantee that historical valuation extremes will repeat. Nevertheless, they demonstrate the potential consequences of investing when prices have become so detached from historical fair value.
A Hypothetical Bearish Trading Strategy
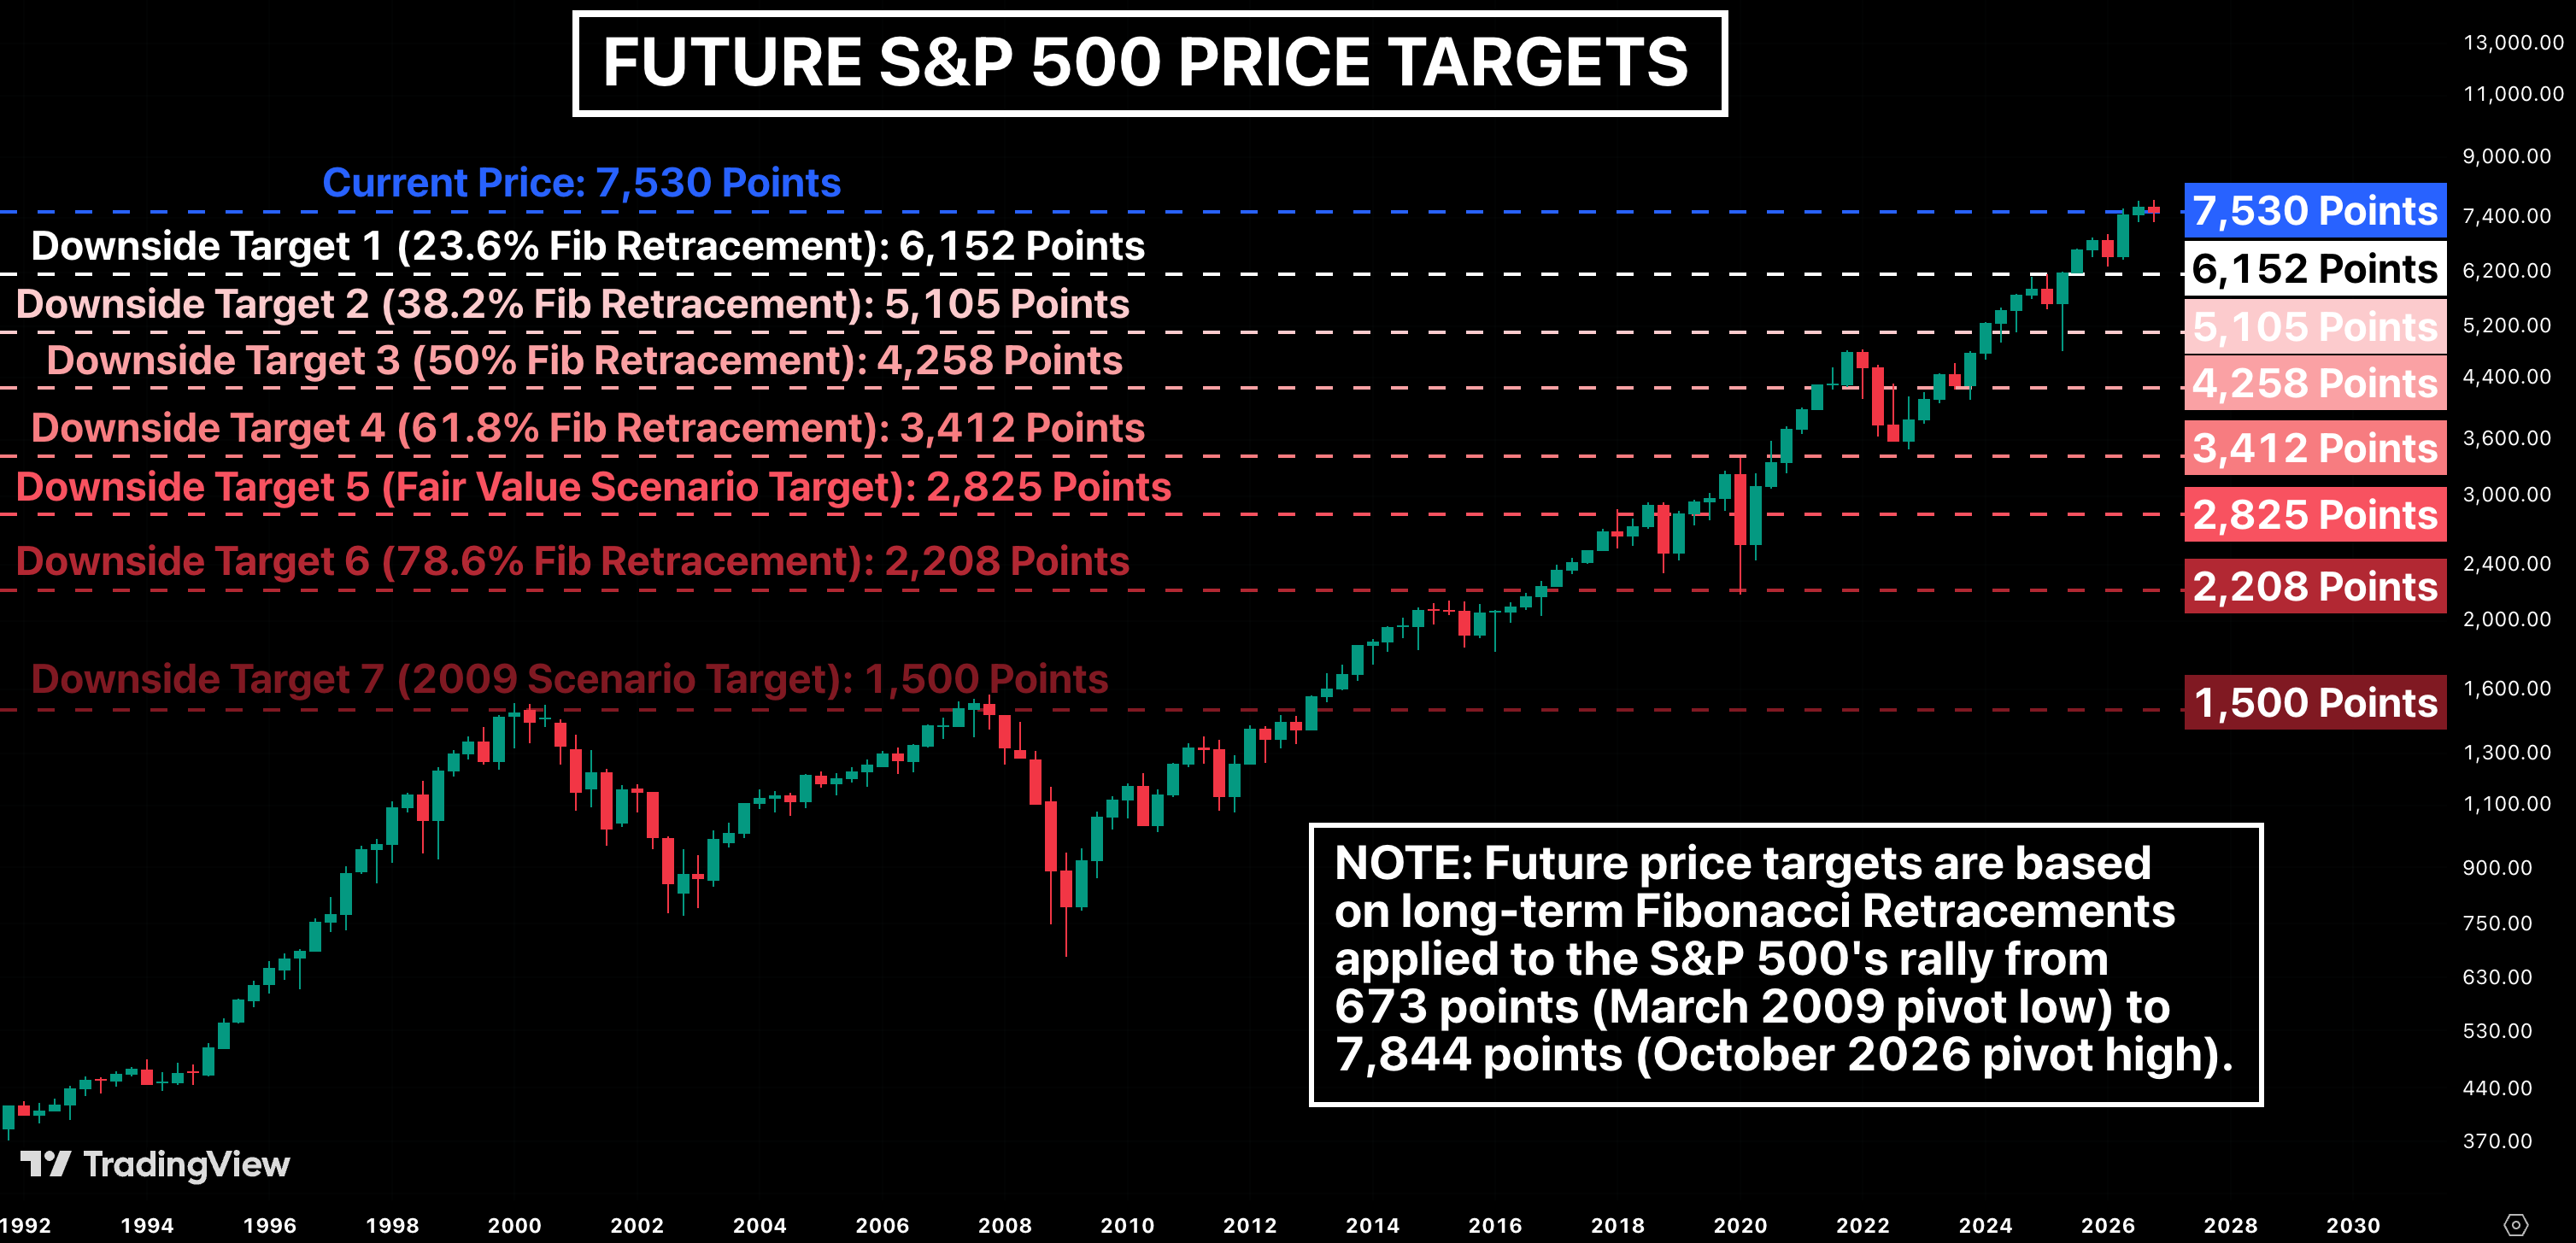
The obvious question is how to position for a potential decline without exposing themselves unnecessarily to the risk of another spectacular rally. One hypothetical approach would be to initiate a short position at 7,530 points, with a stop-loss order at 7,844 points, representing the October 2026 all-time high. That would put the initial stop 314 points above the entry price, limiting the potential loss to 4.2% of the position’s notional value. In other words, if the market continued higher and broke above its previous record, the position could be closed relatively quickly rather than allowing losses to accumulate.
However, assuming the S&P 500 has already peaked at 7,844 points, the potential downside becomes considerably more interesting. Rather than attempting to identify the exact market bottom, I would consider gradually taking profits as the index approaches successive downside targets. The hypothetical strategy could look like this:
- 6,152 points: Closing 1/7 of the original position.
- 5,105 points: Closing 1/7 of the original position.
- 4,258 points: Closing 1/7 of the original position.
- 3,412 points: Closing 1/7 of the original position.
- 2,825 points: Closing 1/7 of the original position.
- 2,208 points: Closing 1/7 of the original position.
- 1,500 points: Closing the remaining position.
The reason for structuring the trade this way is straightforward. As the market falls further, the probability of an aggressive countertrend rally potentially increases. Taking profits incrementally would therefore help lock in gains while reducing exposure as the market approaches increasingly extreme downside levels.
Importantly, this approach also removes the pressure of having to predict precisely where the market will eventually bottom.
What Could the Potential Returns Look Like?
Assuming an entry of 7,530 points and that all seven downside targets are reached, the strategy would close equal portions of the original position at each level. The average exit price would consequently be 3,637 points. That would generate a hypothetical profit of 52% relative to the initial short position’s notional value. The risk/reward calculation would therefore look like this:
- Initial entry: 7,530 points.
- Stop-loss: 7,844 points.
- Potential maximum loss: 4.2%.
- Average exit price: 3,637 points.
- Potential profit: 51.7%.
- Risk/reward ratio: 12.4:1.
Of course, this is an extremely optimistic outcome. The S&P 500 could continue rising, remain overvalued for years or experience substantial rallies during any subsequent decline.
What Could Trigger A Reversal?
If valuations are so stretched, why does the market continue rising? The answer is that expensive markets can become even more expensive. Positive momentum, resilient corporate earnings expectations and enormous investment in AI continue to support investor optimism. However, several potential vulnerabilities deserve attention.
- Japanese bond yields and the yen carry trade: Rising Japanese yields could encourage investors to unwind leveraged positions, potentially creating volatility across global financial markets.
- Higher U.S. Treasury yields: Persistently elevated borrowing costs could undermine equity valuations while increasing financing pressures across the economy.
- Geopolitical tensions: Another oil price shock could reignite inflation, complicating monetary policy and placing additional pressure on consumers.
- Debt and property markets: Highly indebted households and vulnerable property markets could become increasingly exposed if financing conditions deteriorate.
- AI investment: The enormous capital expenditure associated with AI creates the risk that investment expectations ultimately exceed the financial returns being generated.
- Market concentration: Approximately 40% of the S&P 500 is represented by just 10 companies, leaving the index heavily dependent on a relatively small group of market leaders.
None of these risks necessarily needs to materialise simultaneously. However, an unexpected deterioration in just one area could challenge investor confidence and expose vulnerabilities elsewhere.
Why I’m Choosing Treasury Bills
Ultimately, valuation analysis needs to translate into an investment decision.
My approach is relatively straightforward: I want to be adequately compensated for the risks I take. If the S&P 500 rises another 10%, I will have missed out on some additional upside. I can accept that. However, chasing that potential gain while exposing my capital to a possible 60-80% decline presents a very different proposition.
Would I rather risk missing another 10% rally or risk participating in a potential 60-80% decline? My answer is clear. I currently prefer U.S. three-month Treasury Bills.
This is not an attempt to predict the exact market peak. Nor am I suggesting that equities must collapse tomorrow. The market could continue rising for considerably longer. Rather, I believe the prospective reward from owning U.S. equities does not adequately compensate me for the valuation risk.
Treasury Bills offer an opportunity to earn a return while preserving capital and maintaining the flexibility to invest when more attractive opportunities emerge.
In my view, that is a considerably more robust proposition than chasing an increasingly expensive equity market.
The Biggest Investment Skill May Be Patience
During a bull market, remaining on the sidelines can feel like falling behind. Watching others make money while holding cash requires considerable discipline. But investing is not about participating in every rally. It is about allocating capital when the potential returns justify the risks.
The S&P 500 could continue climbing, and the AI revolution could deliver extraordinary economic benefits. Neither possibility changes the importance of paying a sensible price for an investment. The easy money may not be behind us yet. But according to the BPM, the easy risk/reward certainly is.