


XRP (XRP) faced a surprisingly dramatic setback at $1.39 that quickly erased all of yesterday’s gains nearly as quickly as they came in.
Just three hours into the American session on Tuesday, the price hit a strong sell wall and plummeted back to $1.31 — a level that we had flagged as the key “pivot” for XRP after a confirmed trend reversal.
The exact cause of this downtrend is unclear, apart from the fact that it was a technical sell zone. However, the magnitude of the decline suggests that the market is positioning for some negative news.
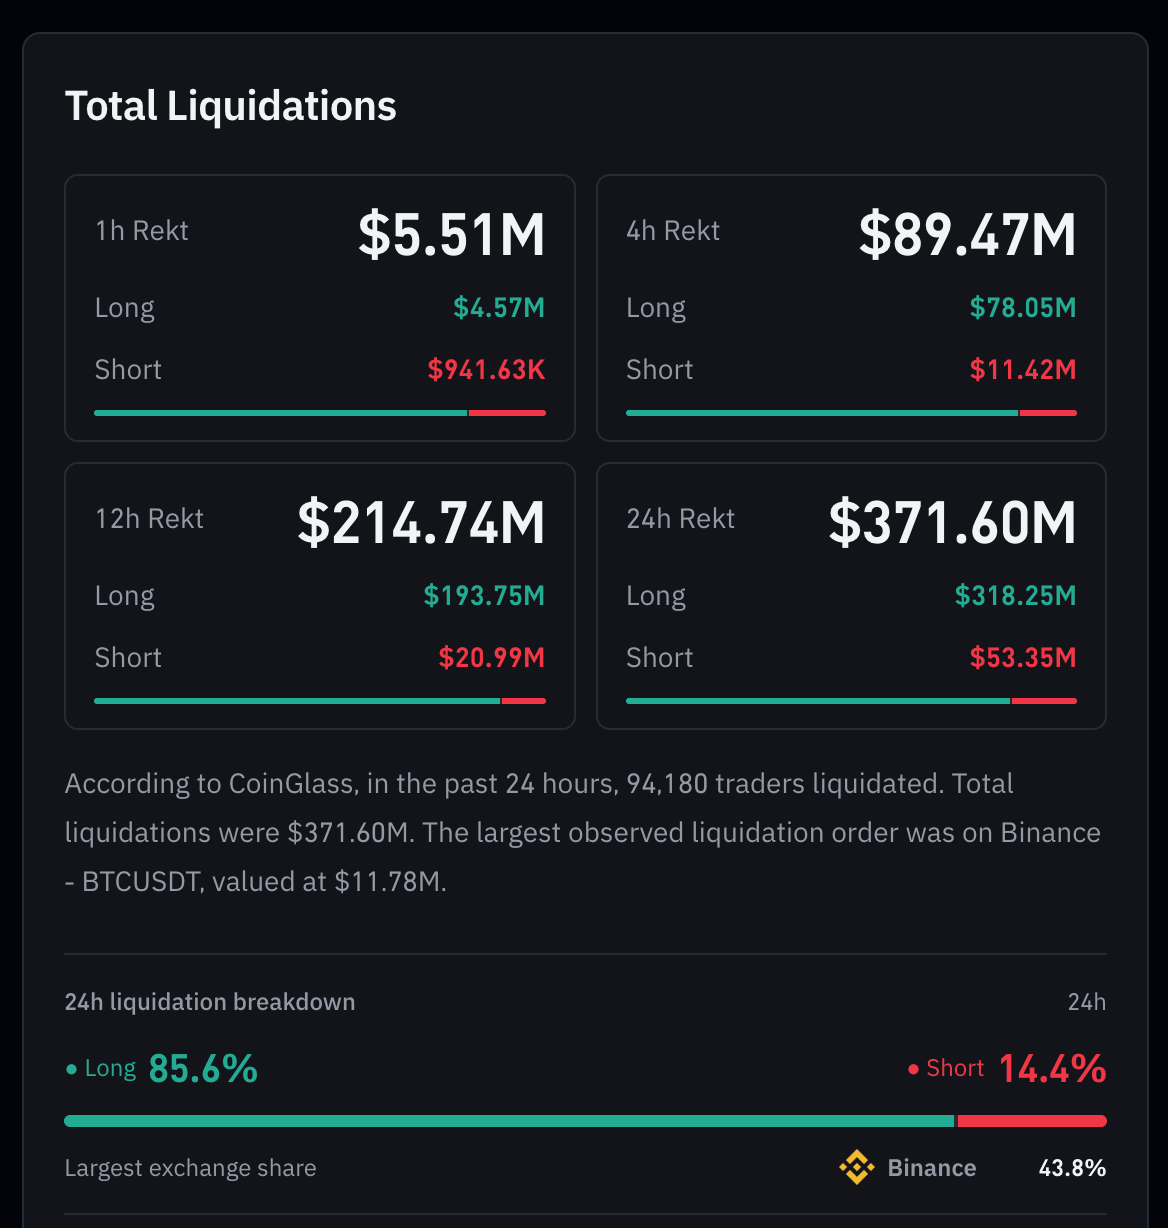
Liquidation data shows that over $300 million worth of long positions have been blown up in the past 24 hours, as sell volumes shot up.
XRP Long-to-Short Ratio Favors Bearish Short-Term Outlook
According to on-chain data from CoinGlass for XRP specifically, the long-to-short ratio in the futures market, a measure of how the market is currently positioned, experienced a strong downturn to 0.71. This is the metric’s second-lowest print in the past 45 days or so.
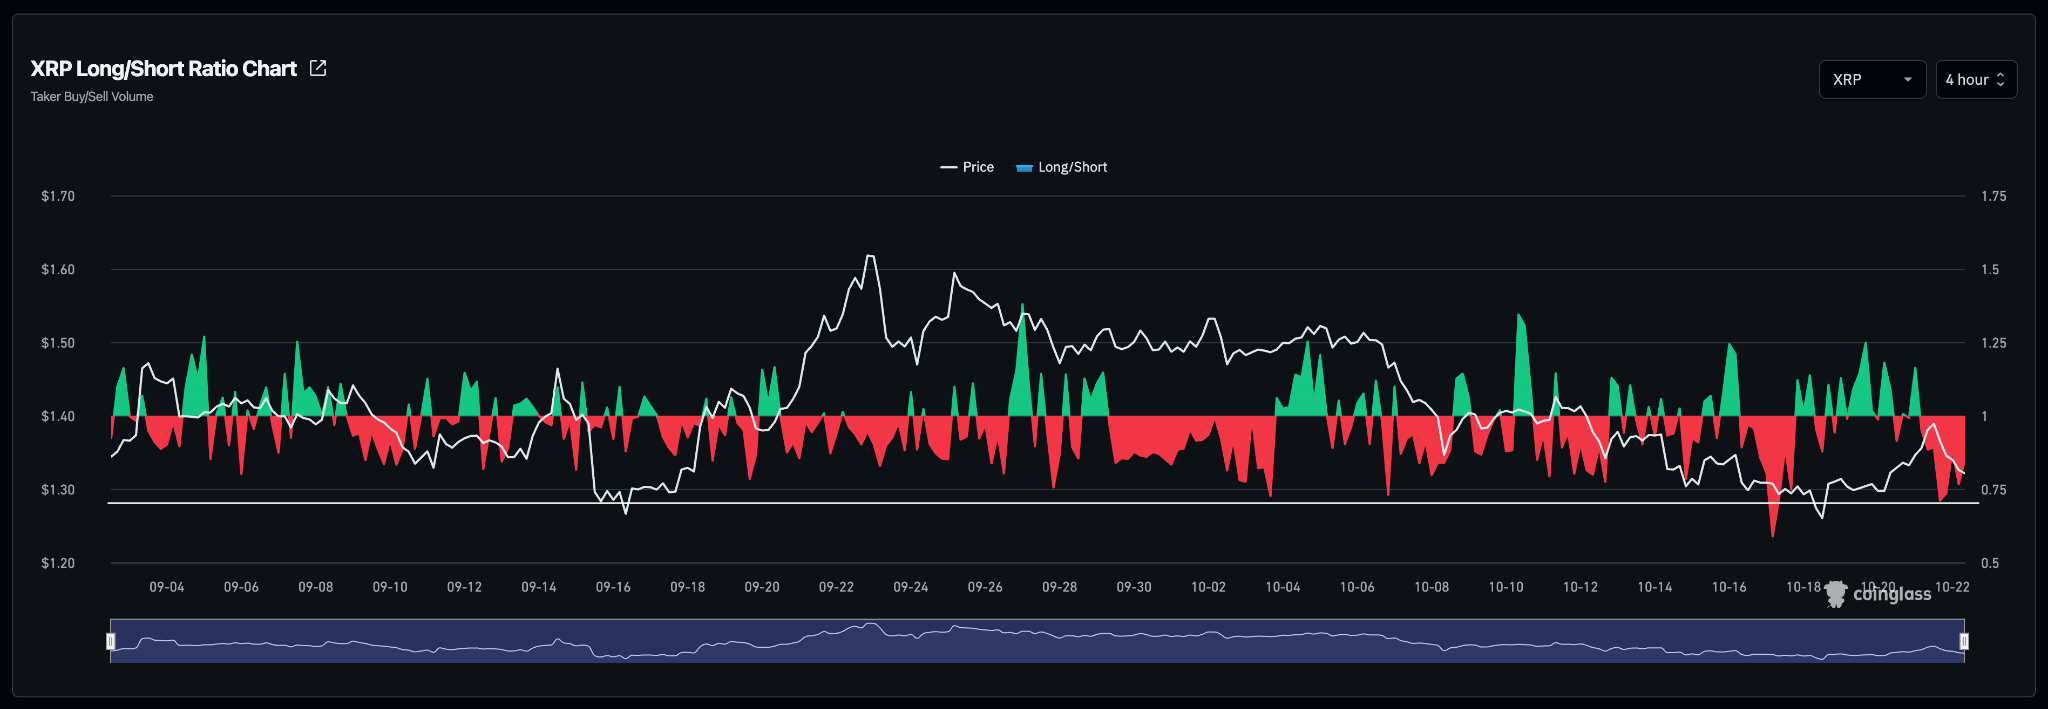
Back on October 17, when the ratio dipped to its lowest level during this period at 0.59, XRP went on to drop from $1.30 to $1.26.
This could be a short-term signal that the market is ready to retest those lows again. This $1.26 level is also the key support to watch for XRP in the near term and potentially the last line of defense for bulls to prevent a much stronger decline to the low onesies.
Ripple Price Forecast
Every new Ripple analysis as it publishes, today's technical signal and key levels, live price — on one page.
See all Ripple forecastsDrop to $1 Possible If XRP Loses These Key Support Areas
Turning to the 4-hour chart, the price has recovered slightly upon hitting the $1.31 level. This was the “market shift” that confirmed a trend reversal for the token yesterday.
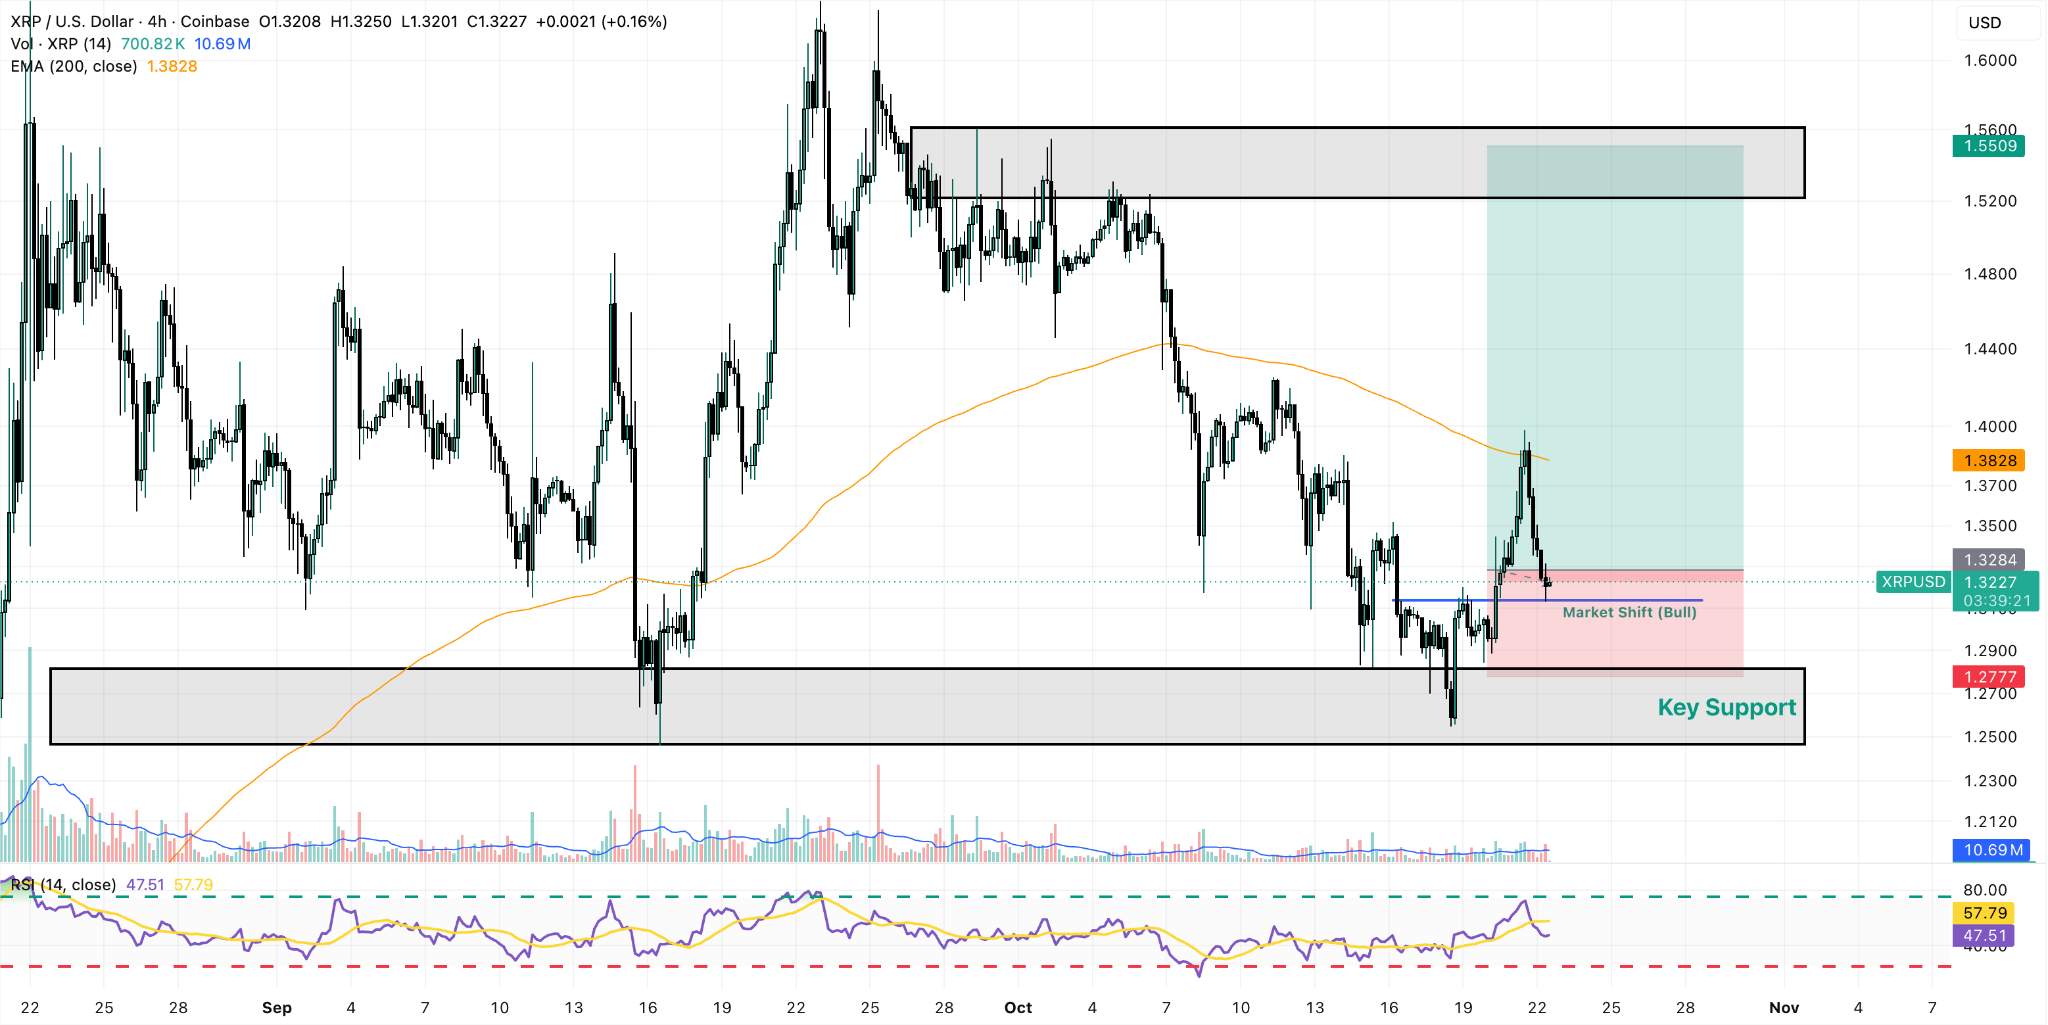
We can see that the $1.36 area was also relevant from a technical standpoint, as this is where the 200-period exponential moving average (EMA) sat in the 4-hour time frame. This is typically a price zone where significant order volumes are concentrated, and that may have been what triggered the decline.
It would make sense that the market turns back to this price zone to find the necessary liquidity from late buyers to keep the rally going. Nonetheless, the selling pressure seems quite strong, and there’s little evidence that the buying power at this level is strong enough to help XRP rebound.
Hence, this long position could be closed at break-even if possible. Otherwise the risk of moving into the red zone is much higher than it was when the position was opened.
The Relative Strength Index (RSI) has also dipped below the signal line, providing an early signal that momentum has swung to bearish territory.
The most likely target for the token at this point would be the $1.29 area if we break below that $1.31 threshold, followed by a retest of the $1.26 support.
If that level is lost, the odds of a massive decline for XRP in the near term will rise as the token could eye a retest of the cycle’s lows at around $1.10 – $1.00.