


XRP (XRP) has dropped below $1 for the first time since President Trump’s victory in the November 2024 election, and that says a lot about how the market is feeling about this altcoin.
Political headwinds in the United States, starting with the failed vote in the Clarity and the sweeping victory of the Democrats in the midterm elections, have created the perfect storm to depress XRP’s valuation once again to levels not seen in two years.
The market as a whole has turned bearish, as the macroeconomic backdrop has deteriorated recently. Analysts are now expecting that the U.S. Federal Reserve will raise interest rates by 50 basis points by January in response to rising inflation.
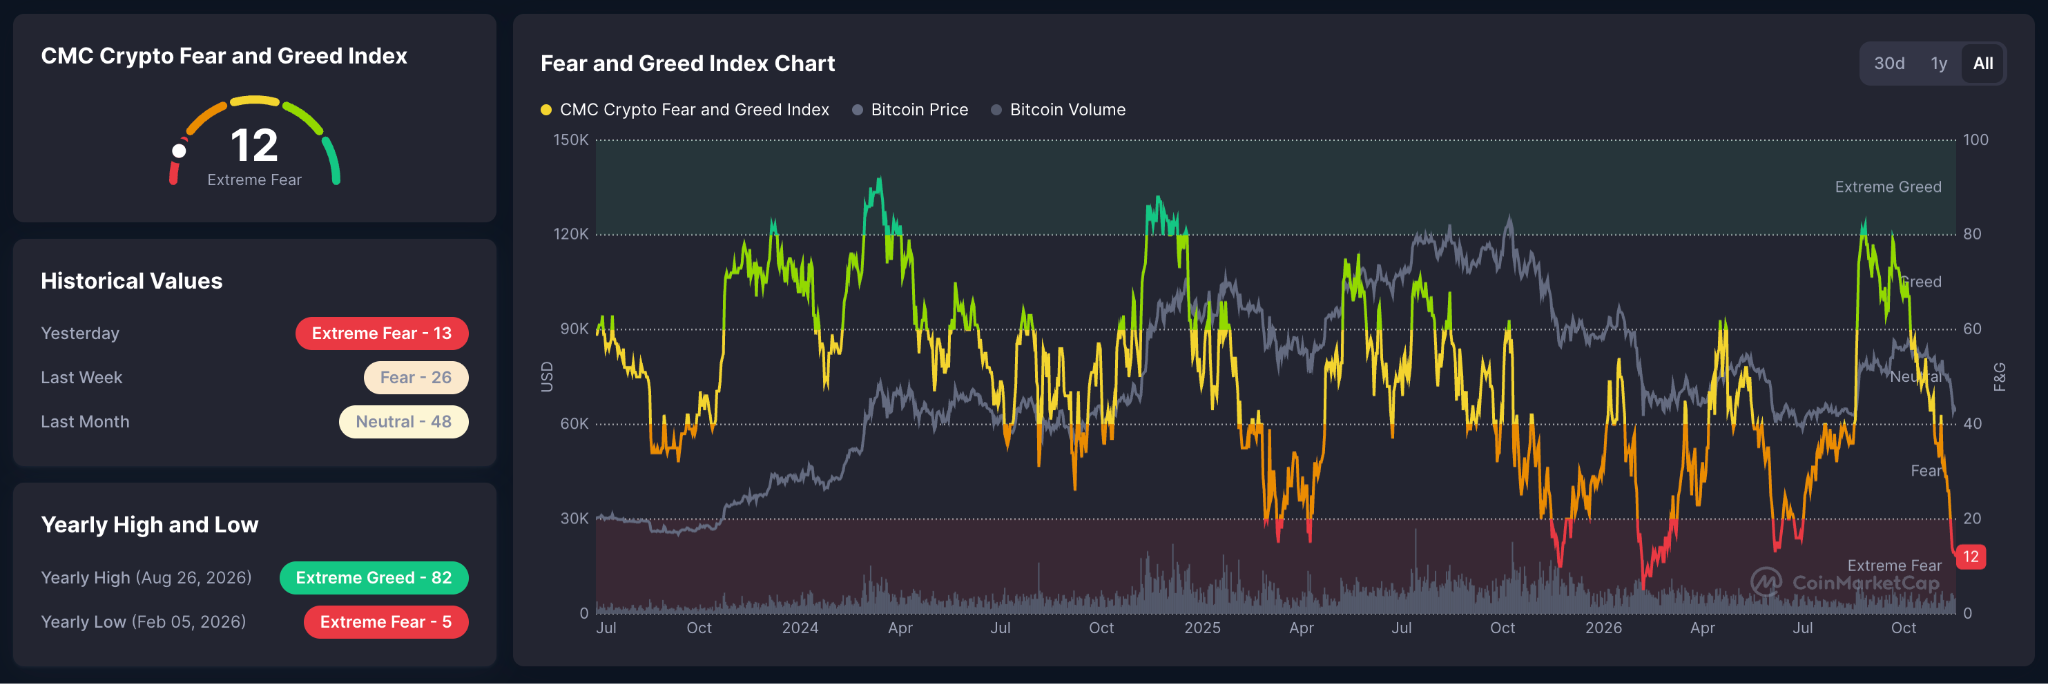
As a result, the Crypto Fear and Greed Index has dipped to 13, indicating that investors are in Extreme Fear mode. This is the lowest level that this sentiment gauge has hit since February this year, and it explains why XRP dropped for 10 days in a row.
The question after such a meaningful breakout below $1 would be: are we nearing a bottom?
The answer unfortunately does not seem to be positive or favorable for bulls, as the crypto market is heavily positioned for the continuation of the downtrend.
Traders Are Positioning for the Continuation of XRP’s Downtrend
According to data from CoinGlass, the long/short ratio for XRP dropped to a 24-hour low of 0.8448 just four days ago, as XRP dipped below $1.
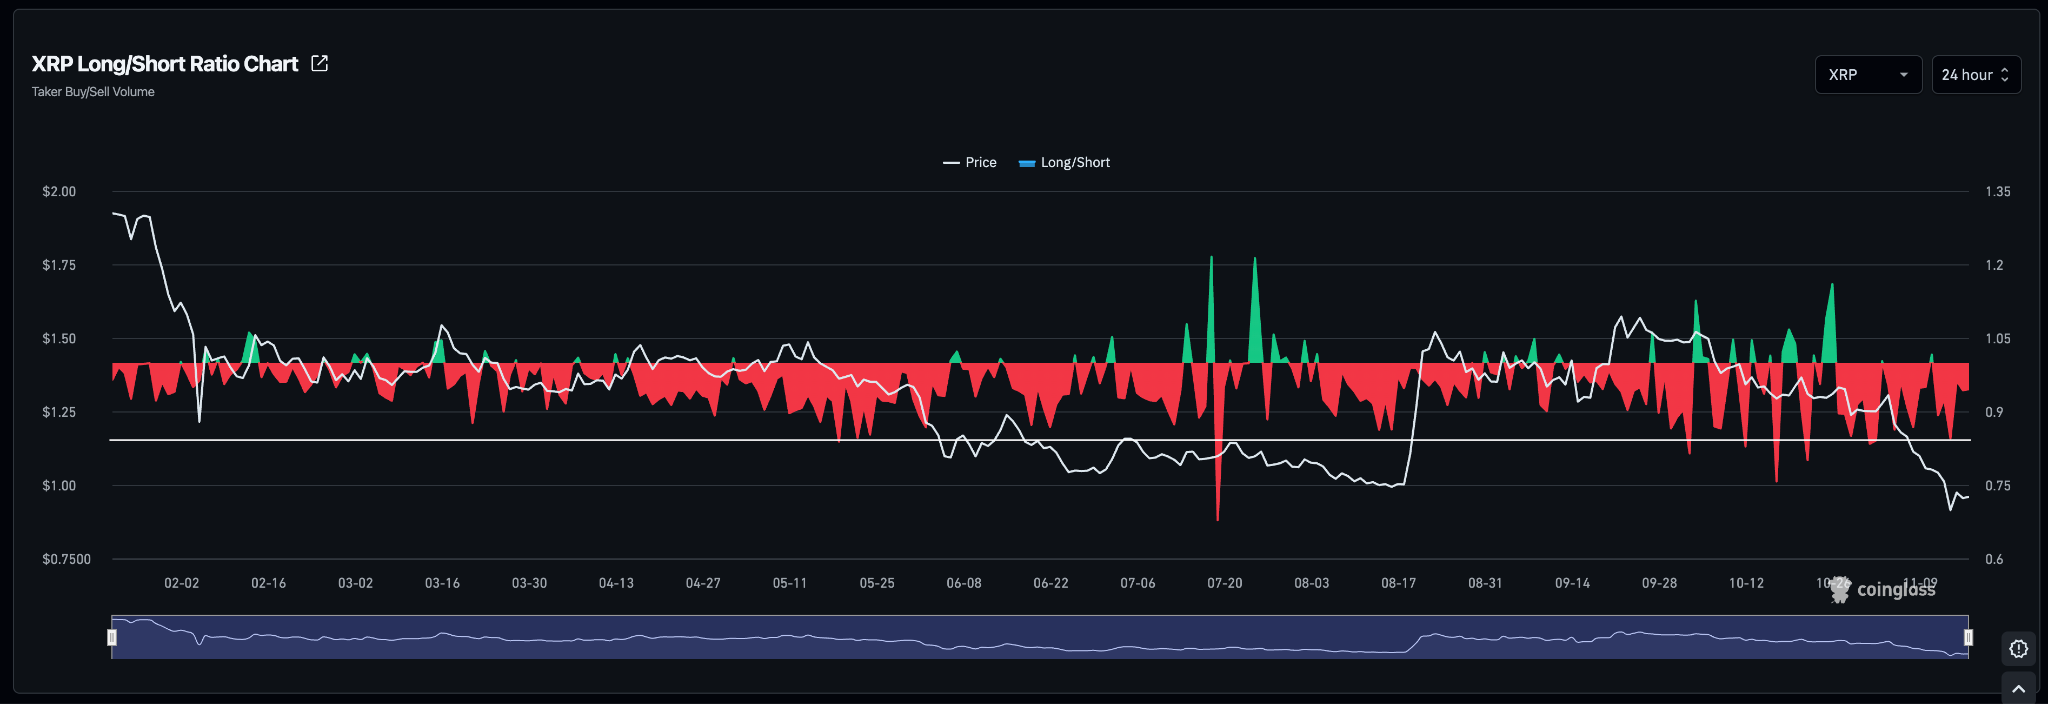
The market’s current positioning indicates that traders expect the continuation of the downtrend. Hence, even though XRP recovered after hitting $0.90, traders do not think that this will be the lowest price that the token will hit in the near term.
This was the 7th lowest long/short ratio for XRP in 10 months or so. In all of the previous instances, whenever this metric has hit such low levels, the initial downward movement has kept going.
Ripple Price Forecast
Every new Ripple analysis as it publishes, today's technical signal and key levels, live price — on one page.
See all Ripple forecastsPath of Least Resistance is Down as XRP Forms Solid Bearish Structure
Turning to the 4-hour chart, we can see that a consolidation pattern has formed between $0.94 and $0.97. This is a typical structure that forms when a key level is lost, such as $1 for XRP.
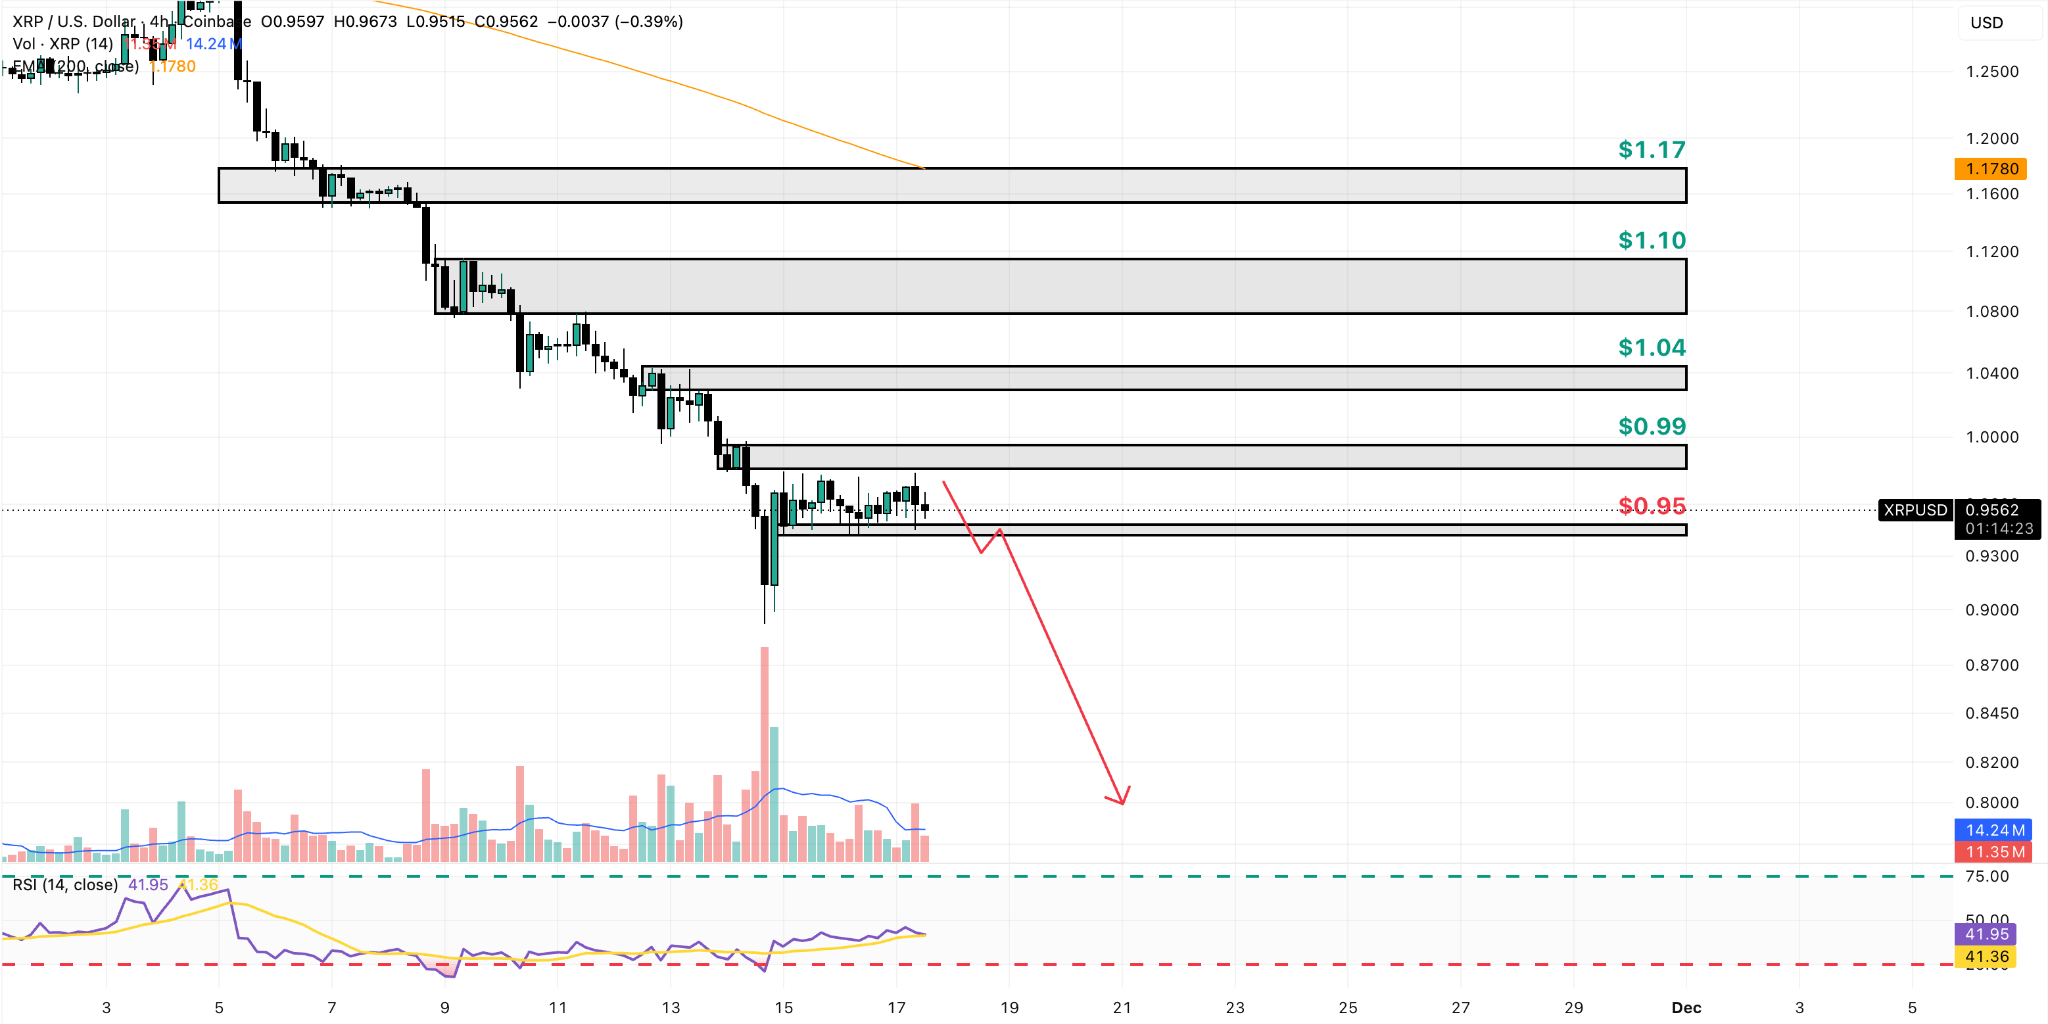
It would be interesting to see how the pattern resolves. If the price drops below $0.94, we see high odds of a much stronger drop ahead toward $0.80 or even $0.60 in the next few weeks, as the market could be aiming to partially or fully erase the token’s Trump-era gains.
Meanwhile, if we break past $0.99, bulls will have a tough time clearing the significant number of order blocks that we can identify in the 4-hour chart at $1.03, $1.10, and $1.17, to name a few.
The path of least resistance is down, and a bearish breakout below $0.94 could mark the beginning of XRP’s journey to levels not seen in more than 2 years.