
Gold (XAUUSD) Price Forecast: Price Prediction – Rally Launch Pad or Bull Trap?
Gold rallies to $4964.62 as big money stays after margin hike. Gold rally hinges on 50-day moving average—launch pad for breakout or trigger for decline?
Friday’s Bounce: Real Support or False Hope?
Spot Gold settled higher on Friday after another successful test of a key retracement zone just slightly above the 50-day moving average. The market visited the zone three days out of five last week, suggesting buyers may have found value. The real question is, is this support base being built good enough to support a rally back to the all-time high at $5602.23?
On Friday, XAUUSD settled at $4964.62, up $183.95 or +3.85%.
Margin Hike Reveals Who’s Still Playing
The good news is gold rallied after another margin hike by the CME Group. This signals that big money still feels the market is attractive to the major players that can afford it even around the $4700 to $4500 area. The bad news is, the margin hike may have priced out some of the smaller traders. With big money aboard, the CME is banking on less volatility.
The Iran Factor: Not What You Think
Some analysts thought safe-haven buyers stepped in to stop the price slide, but I didn’t see evidence of that. Certainly, news that the United States and Iran were holding talks on Friday may have actually dampened speculative interest on the long side. However, when dealing with issues in the Middle East, one has to be willing to look at both sides. So while Iran’s top diplomat on Friday said talks were off to a “good start” and set to continue, we have to consider the flip side. If the talks collapsed, it could bring the two countries closer to war.
What’s Really Driving This Market
I think that renewed demand for risky assets and a weaker U.S. Dollar were more than likely the fundamental catalysts behind the strength. I also think that since the long-term fundamentals are still bullish (central bank buying, Fed rate cut expectations), we may have just seen some good old-fashioned bargain hunting.
The Technical Picture: Classic Post-Top Behavior
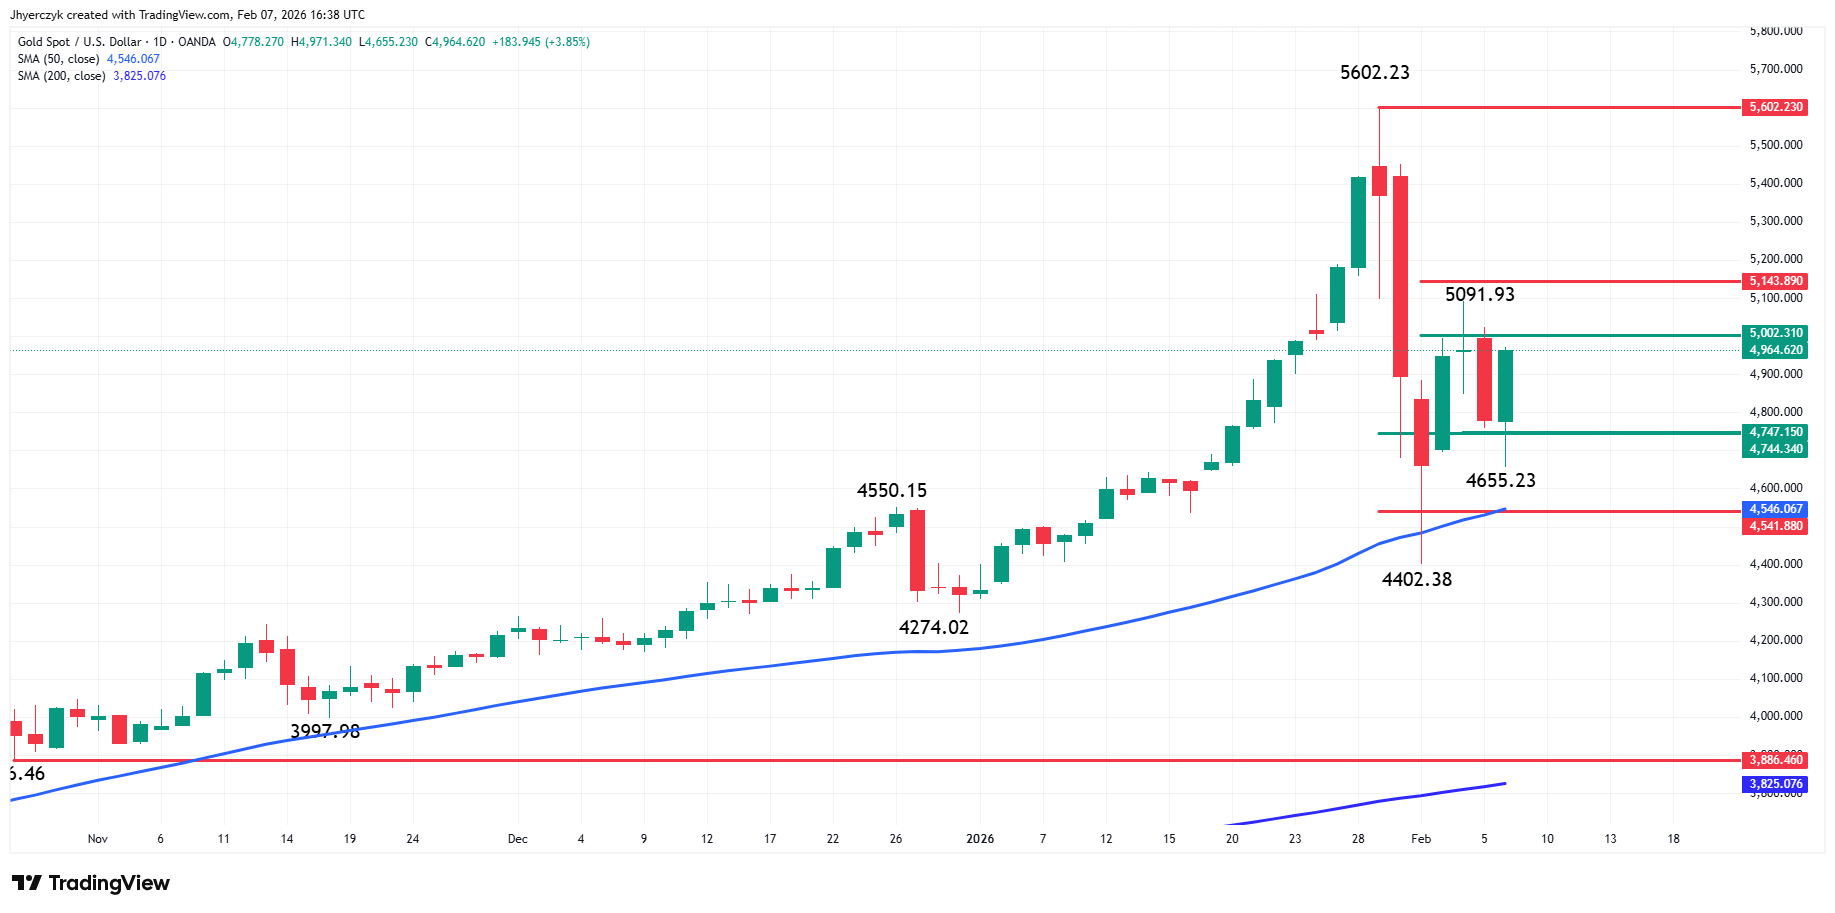
Technically, the market is looking like a typical market after a major top. First, we had long liquidation from $5602.23 to $4402.38. Then we saw the rebound rally from $4402.38 to $5091.93. Now we’re in the indecisive phase where long-term investors have to decide to buy strength or wait for value.
Among the questions being asked: is the retracement zone at $5002.31 to $5143.89 new lower resistance or a potential launching pad for an acceleration to the upside? The other question is whether value has been found between $4747.15 and $4541.88 and the 50-day moving average at $4402.38.
The Bottom Line: Patience Required
I think there are too many questions that need to be answered before the bull market resumes so we’re more than likely to sit in a range over the near-term, establishing a solid support base for the next run. With the market in strong hands and the major buyers sitting on enough funds to wait it out, long-term investors are just going to have to be patient.
What to Watch This Week
Keep an eye on the 50-day moving average in the upcoming week. The market is about 50 days from when it started taking off on November 21, so that moving average is going to start moving higher. It’s going to either provide support and guidance, or it’s going to serve as the trigger point for another breakdown.
More Information in our Economic Calendar.