
Advertisement
Advertisement
10-Yr U.S. Treasury Notes (TY) Futures Technical Analysis – August 3, 2015 Forecast
By:
September 10-Year U.S. Treasury Notes surged to the upside on Friday. The move took out the previous main top at 127’09, reaffirming the uptrend on the
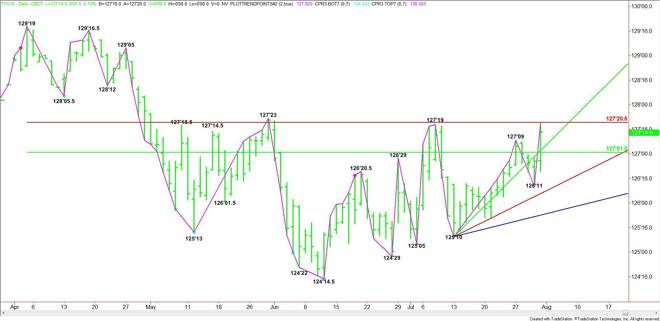
September 10-Year U.S. Treasury Notes surged to the upside on Friday. The move took out the previous main top at 127’09, reaffirming the uptrend on the daily swing chart. The new main bottom is 126’11.
The main range is 129’19 to 124’14.5. Its retracement zone is 127’01 to 127’20.5. On Friday, the market surged through the 50% level at 127’01, but ran into resistance at the Fibonacci level at 127’20.5.
A trade through 127’20.5 will signal the presence of buyers, but don’t expect another breakout to the upside unless the main top at 127’23 is taken out with conviction. There is plenty of room to the upside over this level with the next major targets coming in at 129’05, 129’16.5 and 129’19.
On the downside, the first support angle comes in at 127’06. This is followed by the 50% level at 127’01 and the main bottom at 126’11. A trade through this level will turn the main trend to down.
It is important that with each breakout rally, buyers come in to support the dips. This will help continue the uptrend. It will also serve as proof that real buyers are coming in to support the moves.
Based on the reaction to the Fibonacci on Friday, it’s safe to say that the direction of the market today will be determined by trader reaction to 127’20.5.
About the Author
James Hyerczykauthor
James Hyerczyk is a U.S. based seasoned technical analyst and educator with over 40 years of experience in market analysis and trading, specializing in chart patterns and price movement. He is the author of two books on technical analysis and has a background in both futures and stock markets.


Advertisement