
Advertisement
Advertisement
10-Yr U.S. Treasury Notes (TY) Futures Technical Analysis – August 4, 2015 Forecast
By:
September 10-Year U.S. Treasury Notes are trading lower shortly before the cash market opening. Yesterday, the market surged to its highest level since
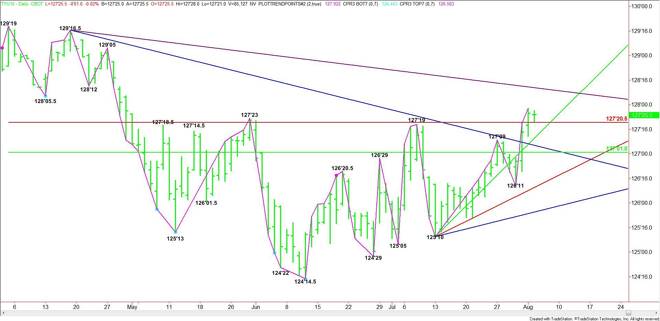
September 10-Year U.S. Treasury Notes are trading lower shortly before the cash market opening. Yesterday, the market surged to its highest level since April 30. The close was also on the strong side of a Fibonacci level at 127’20.5, giving it an early upside bias.
The main trend is up according to the daily swing chart. The first support is the Fib level at 127’20.5. This is followed by an uptrending angle at 127’10. A trade below this level could trigger a move into a long-term downtrending angle at 127’05.5. The next major target is the 50% level at 127’01.
A sustained move over 127’20.5 will signal the presence of buyers. The daily chart indicates there is room to the upside. The next major upside target is a long-term downtrending angle at 128’11.
The key today is the follow-through rally following yesterday’s strong surge. If there is no follow-through rally then don’t be surprised if T-Notes go into sideways-to-lower mode for a few days ahead of Friday’s major U.S. Non-Farm Payrolls report.
Based on the current price at 127’26, the direction of the market today will likely be determined by trader reaction to 127’20.5.
About the Author
James Hyerczykauthor
James Hyerczyk is a U.S. based seasoned technical analyst and educator with over 40 years of experience in market analysis and trading, specializing in chart patterns and price movement. He is the author of two books on technical analysis and has a background in both futures and stock markets.


Advertisement