Ethereum’s native token, Ether (ETH), has rebounded by around 30% when compared to its local low of around $2,150 from over a month ago.
Improving macroeconomic conditions, including global central bank rate cuts and a robust earnings season on Wall Street, have boosted an overall risk appetite in crypto and traditional markets, fueling ETH’s ongoing boom.
Now, at least three technical setups on the ETH charts support this bullish momentum, each signaling a potential rally for the world’s second-largest cryptocurrency by market cap.

Ethereum Enters Breakout Stage with $3,500 Target
The first chart showcases a classic inversehead-and-shoulders (IH&S) pattern, characterized by the formation of three troughs beneath a common neckline resistance. The middle trough, called the “head,” is deeper than other two, called “shoulders.”
An IH&S pattern is considered a bullish reversal signal, resolving when the price breaks above the neckline with decisive volumes and rises by as much as the maximum distance between the neckline and the head’s deepest point.
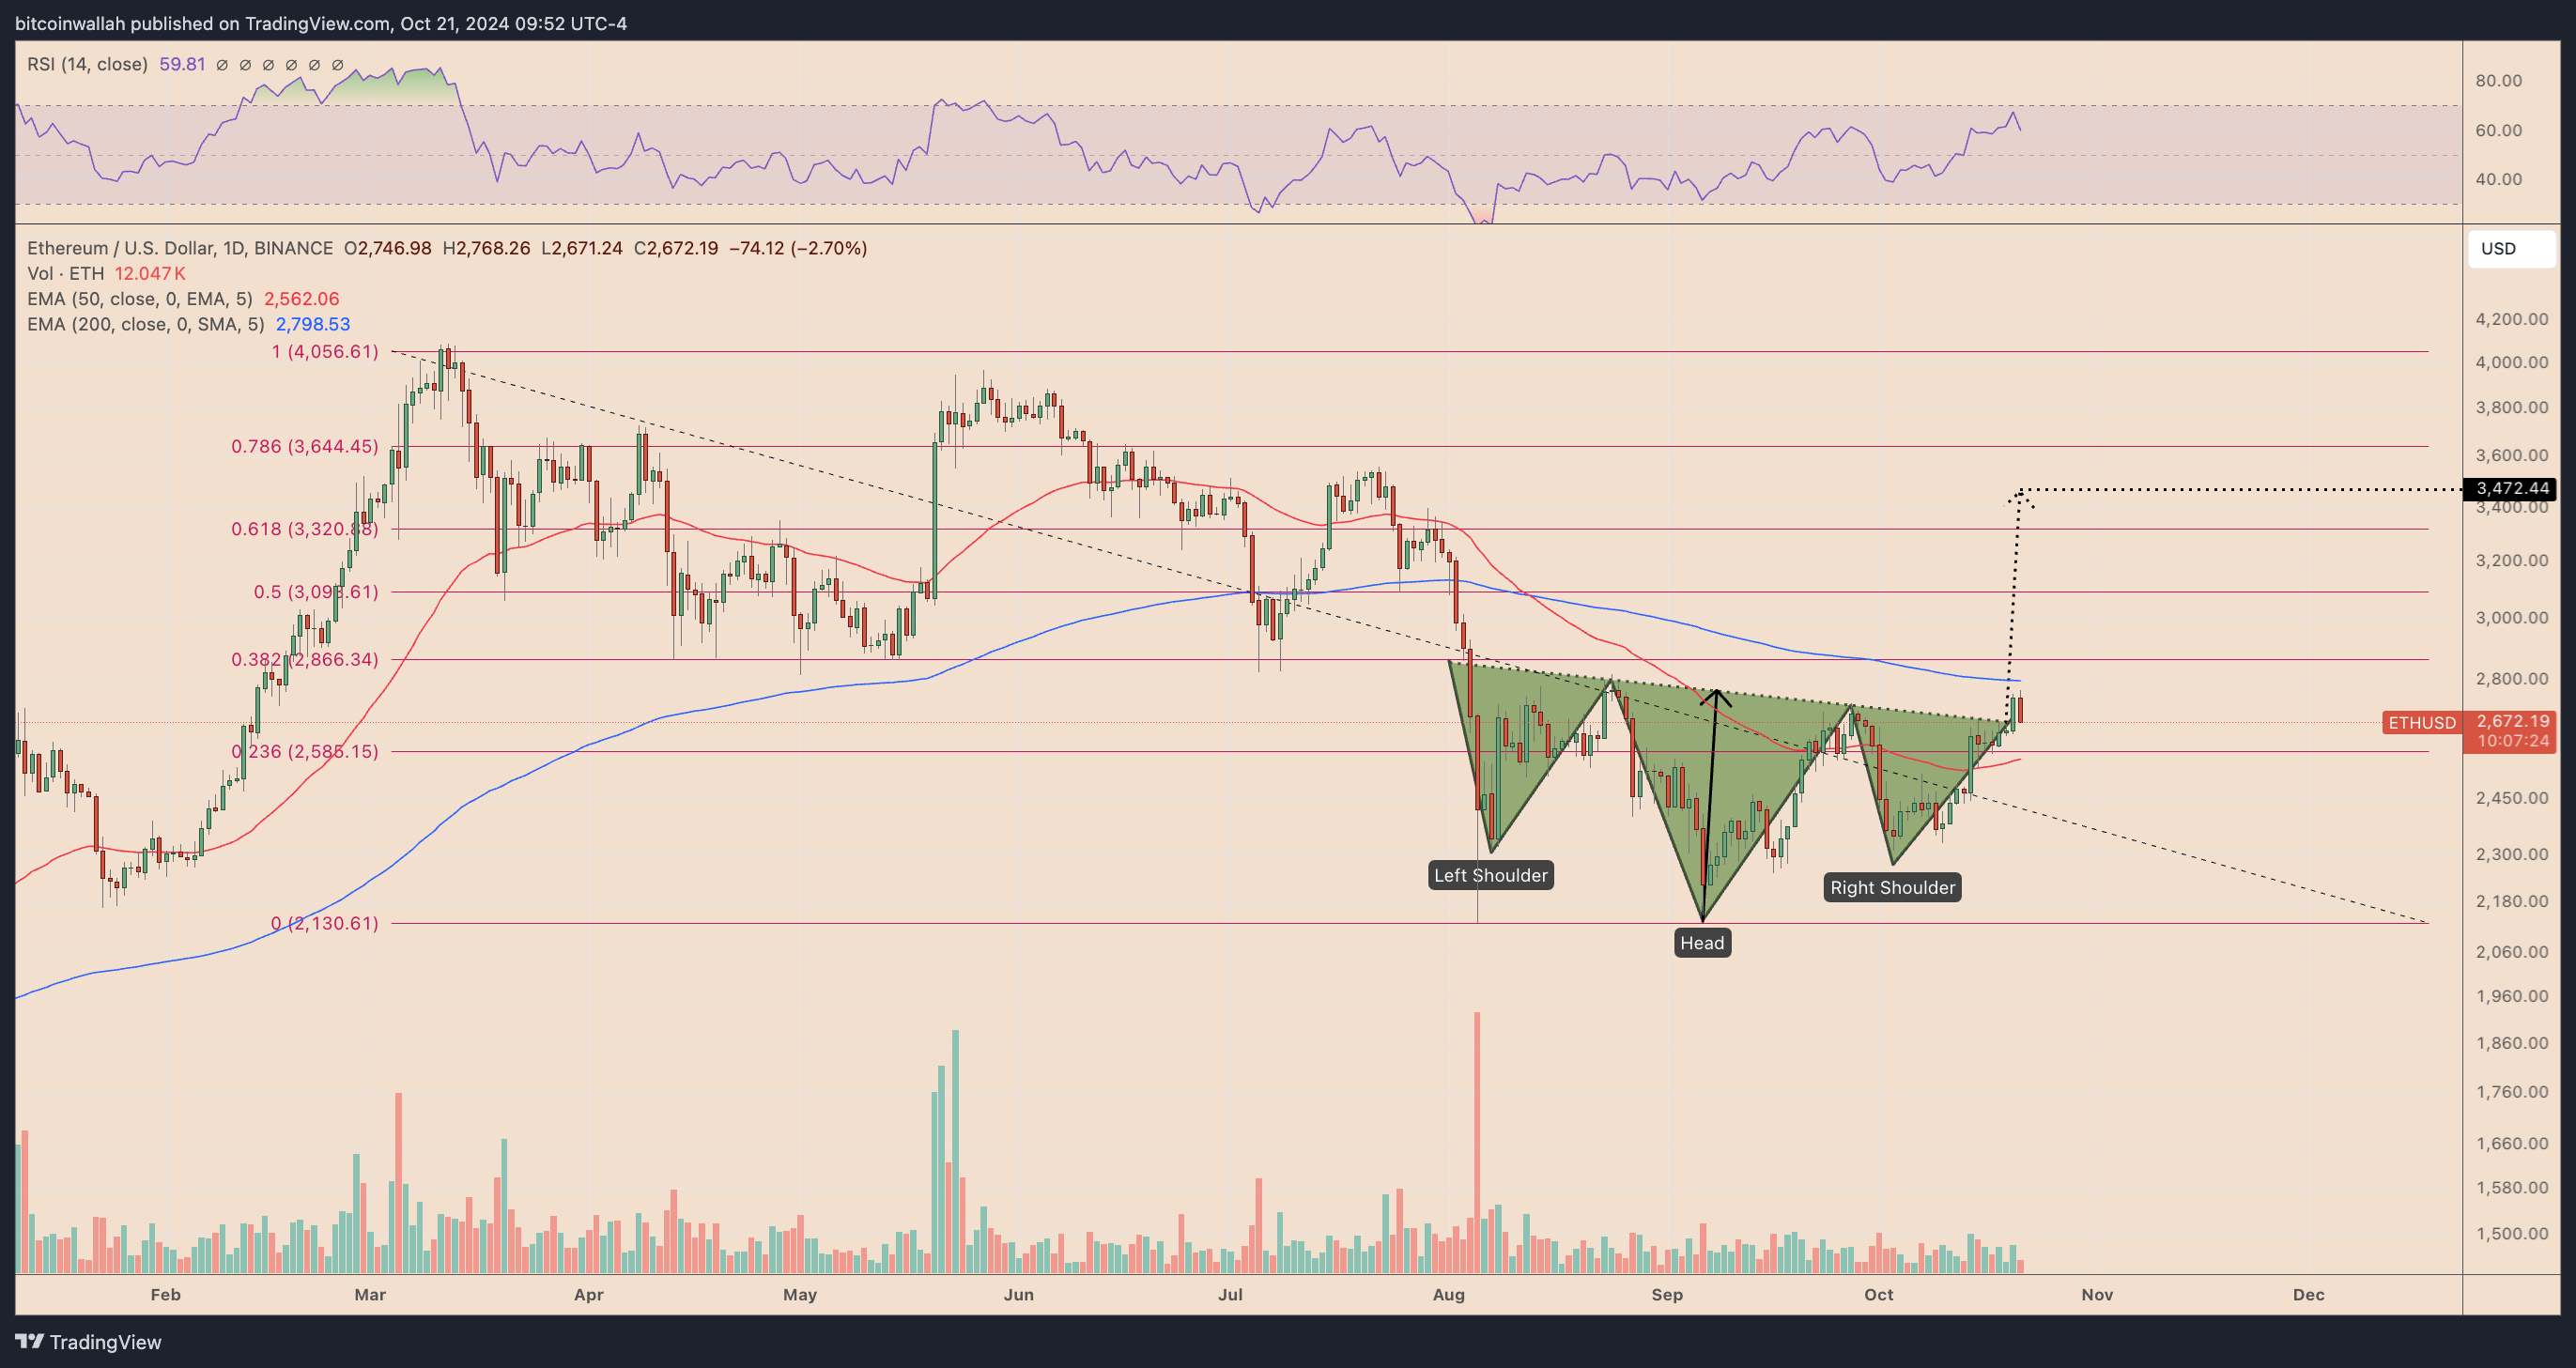
The cryptocurrency’s neckline resistance is near $2,800, and a breakout above this level—if accompanied by a rise in trading volumes—could lead ETH toward the $3,500 target by December 2024.
Ethereum Price Forecast
Every new Ethereum analysis as it publishes, today's technical signal and key levels, live price — on one page.
See all Ethereum forecastsETH Price Target for Early 2025: $4,000 or More
The second chart depicts a symmetrical triangle, with Ethereum bouncing off its lower trendline and moving toward the upper trendline.
Symmetrical triangles represent a consolidation phase, where buyers and sellers reach an equilibrium. A breakout from this structure, especially toward the prevailing trend, can lead to significant price action as traders view it as a continuation signal.
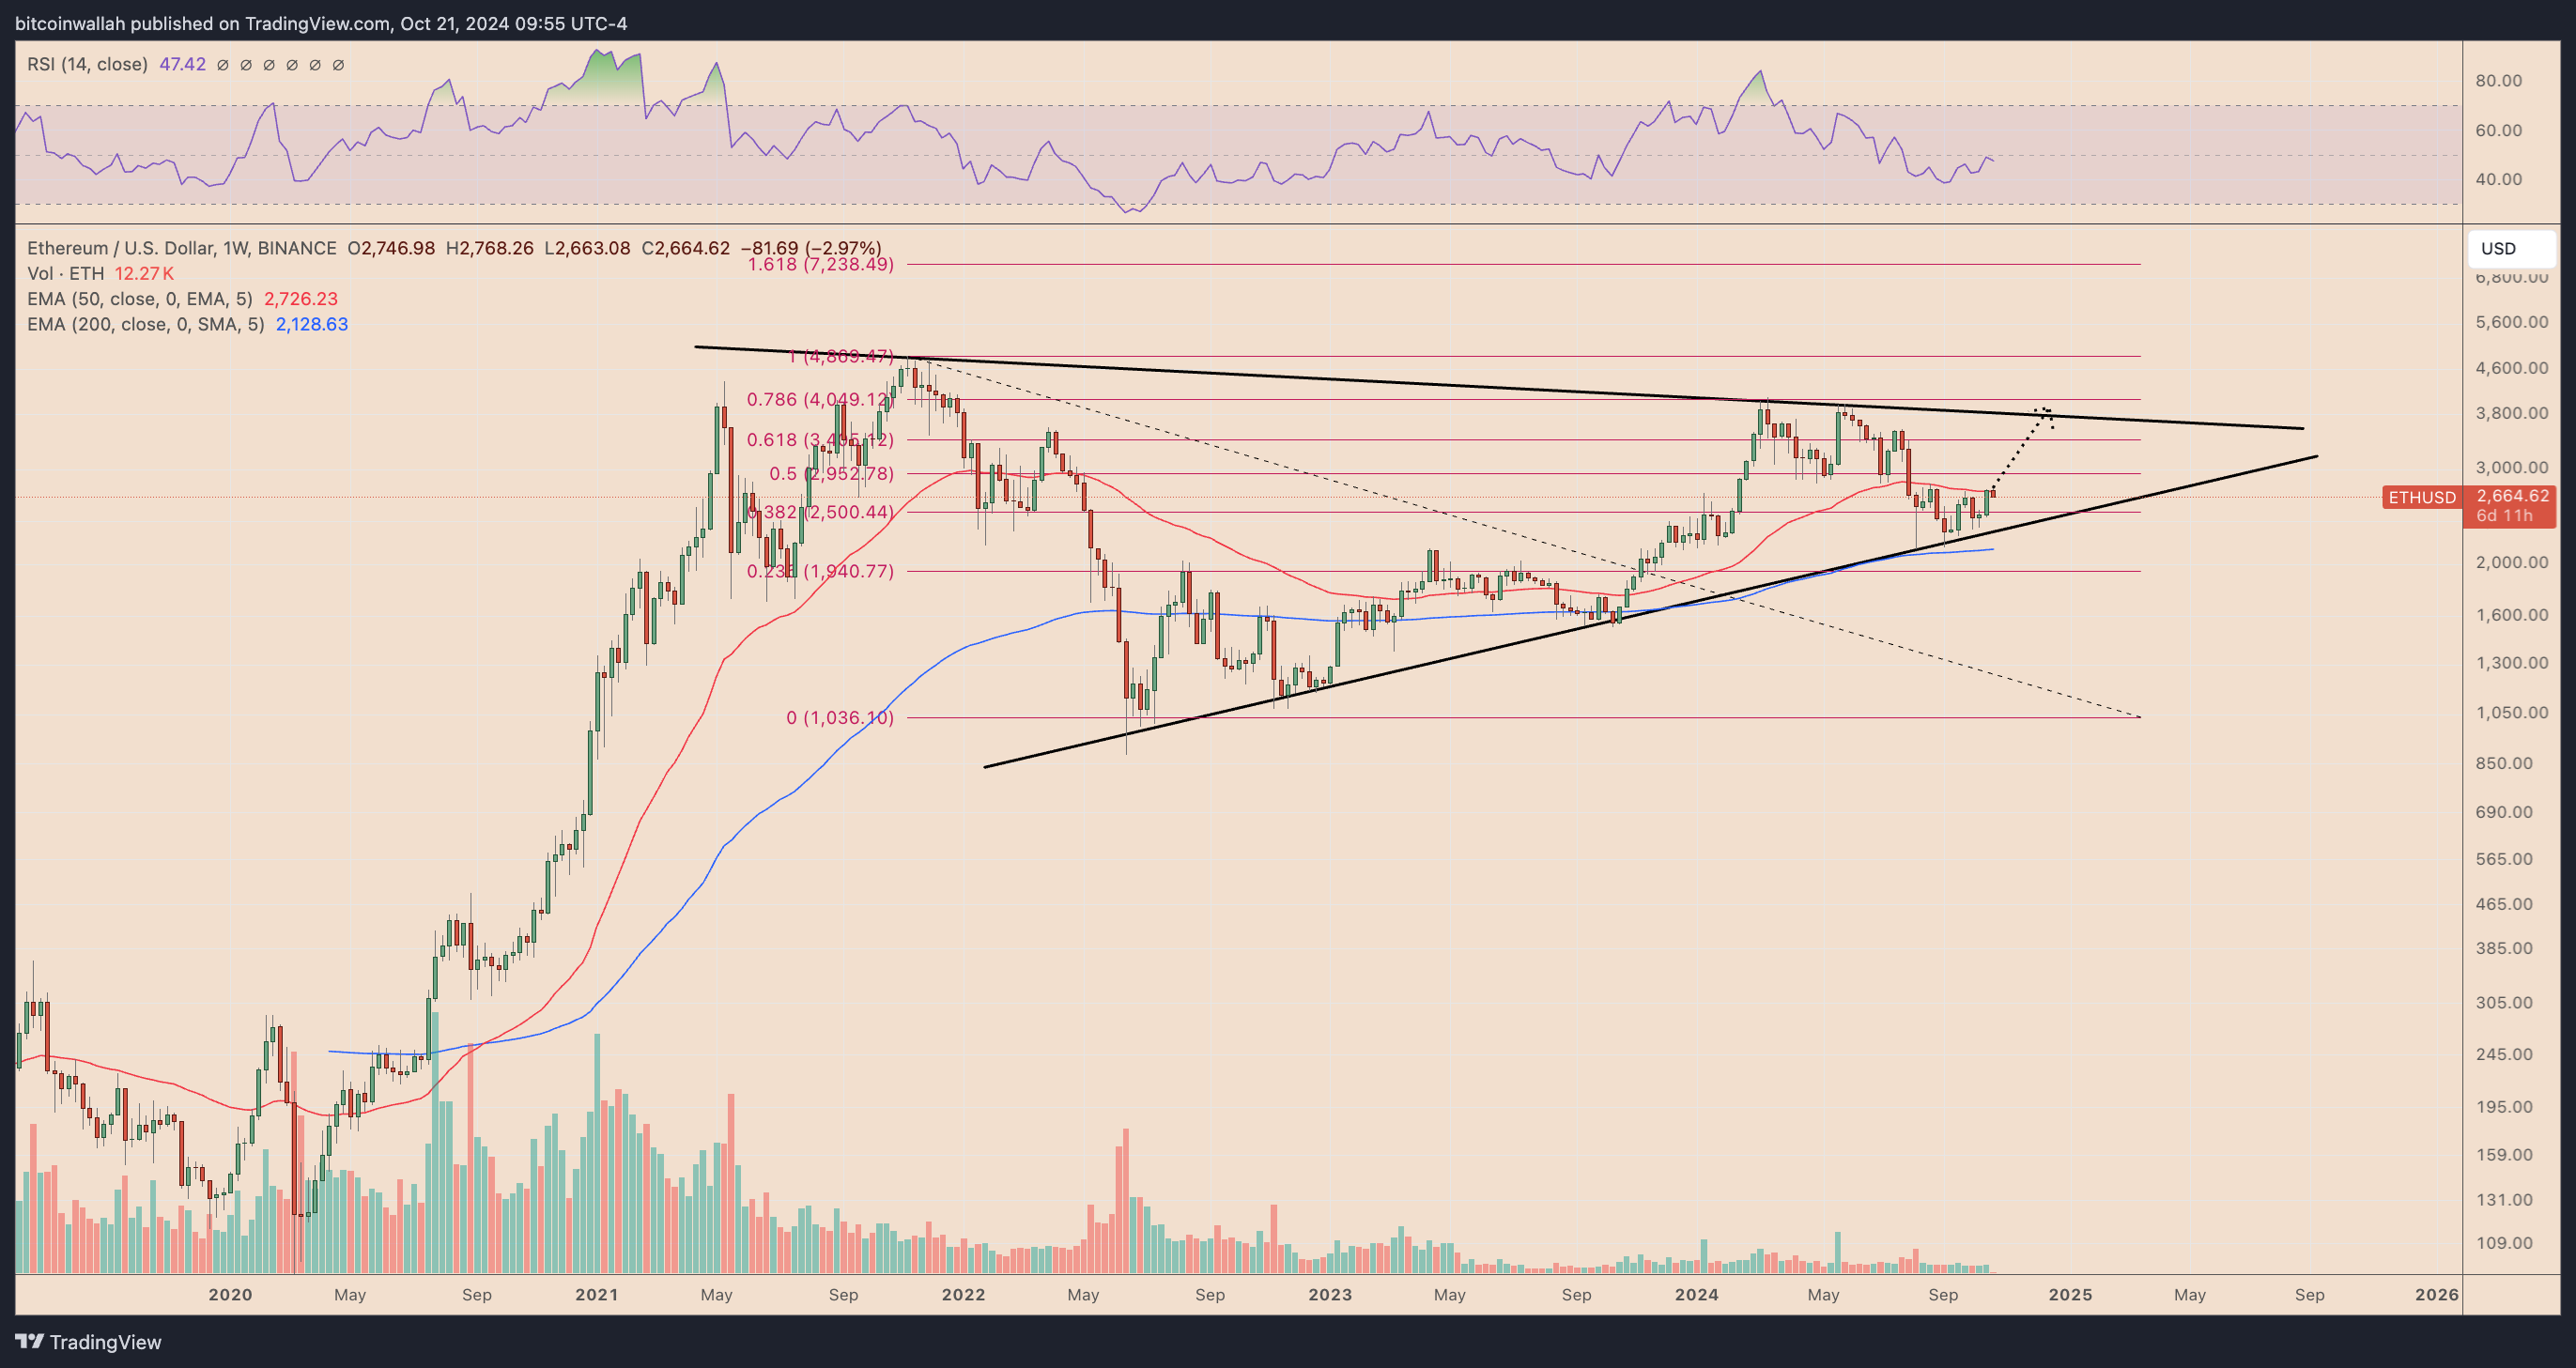
Meanwhile, a breakout above the upper trendline could have ETH pursue levels above $7,000 as its upside targets for 2025, coinciding with its 1.618 Fib line.
Ethereum vs. Bitcoin: ETH/BTC Eyes Massive Rebound Ahead
The third chart displays the ETH/BTC pair, where Ethereum has bounced from the lower trendline of a falling wedge pattern.
Traders interpret falling wedges as signals that the selling pressure is weakening and a reversal may be imminent. Coupled with an RSI bounce from oversold territory, many traders consider this a strong buy signal, expecting ETH to outperform BTC in the short to medium term.
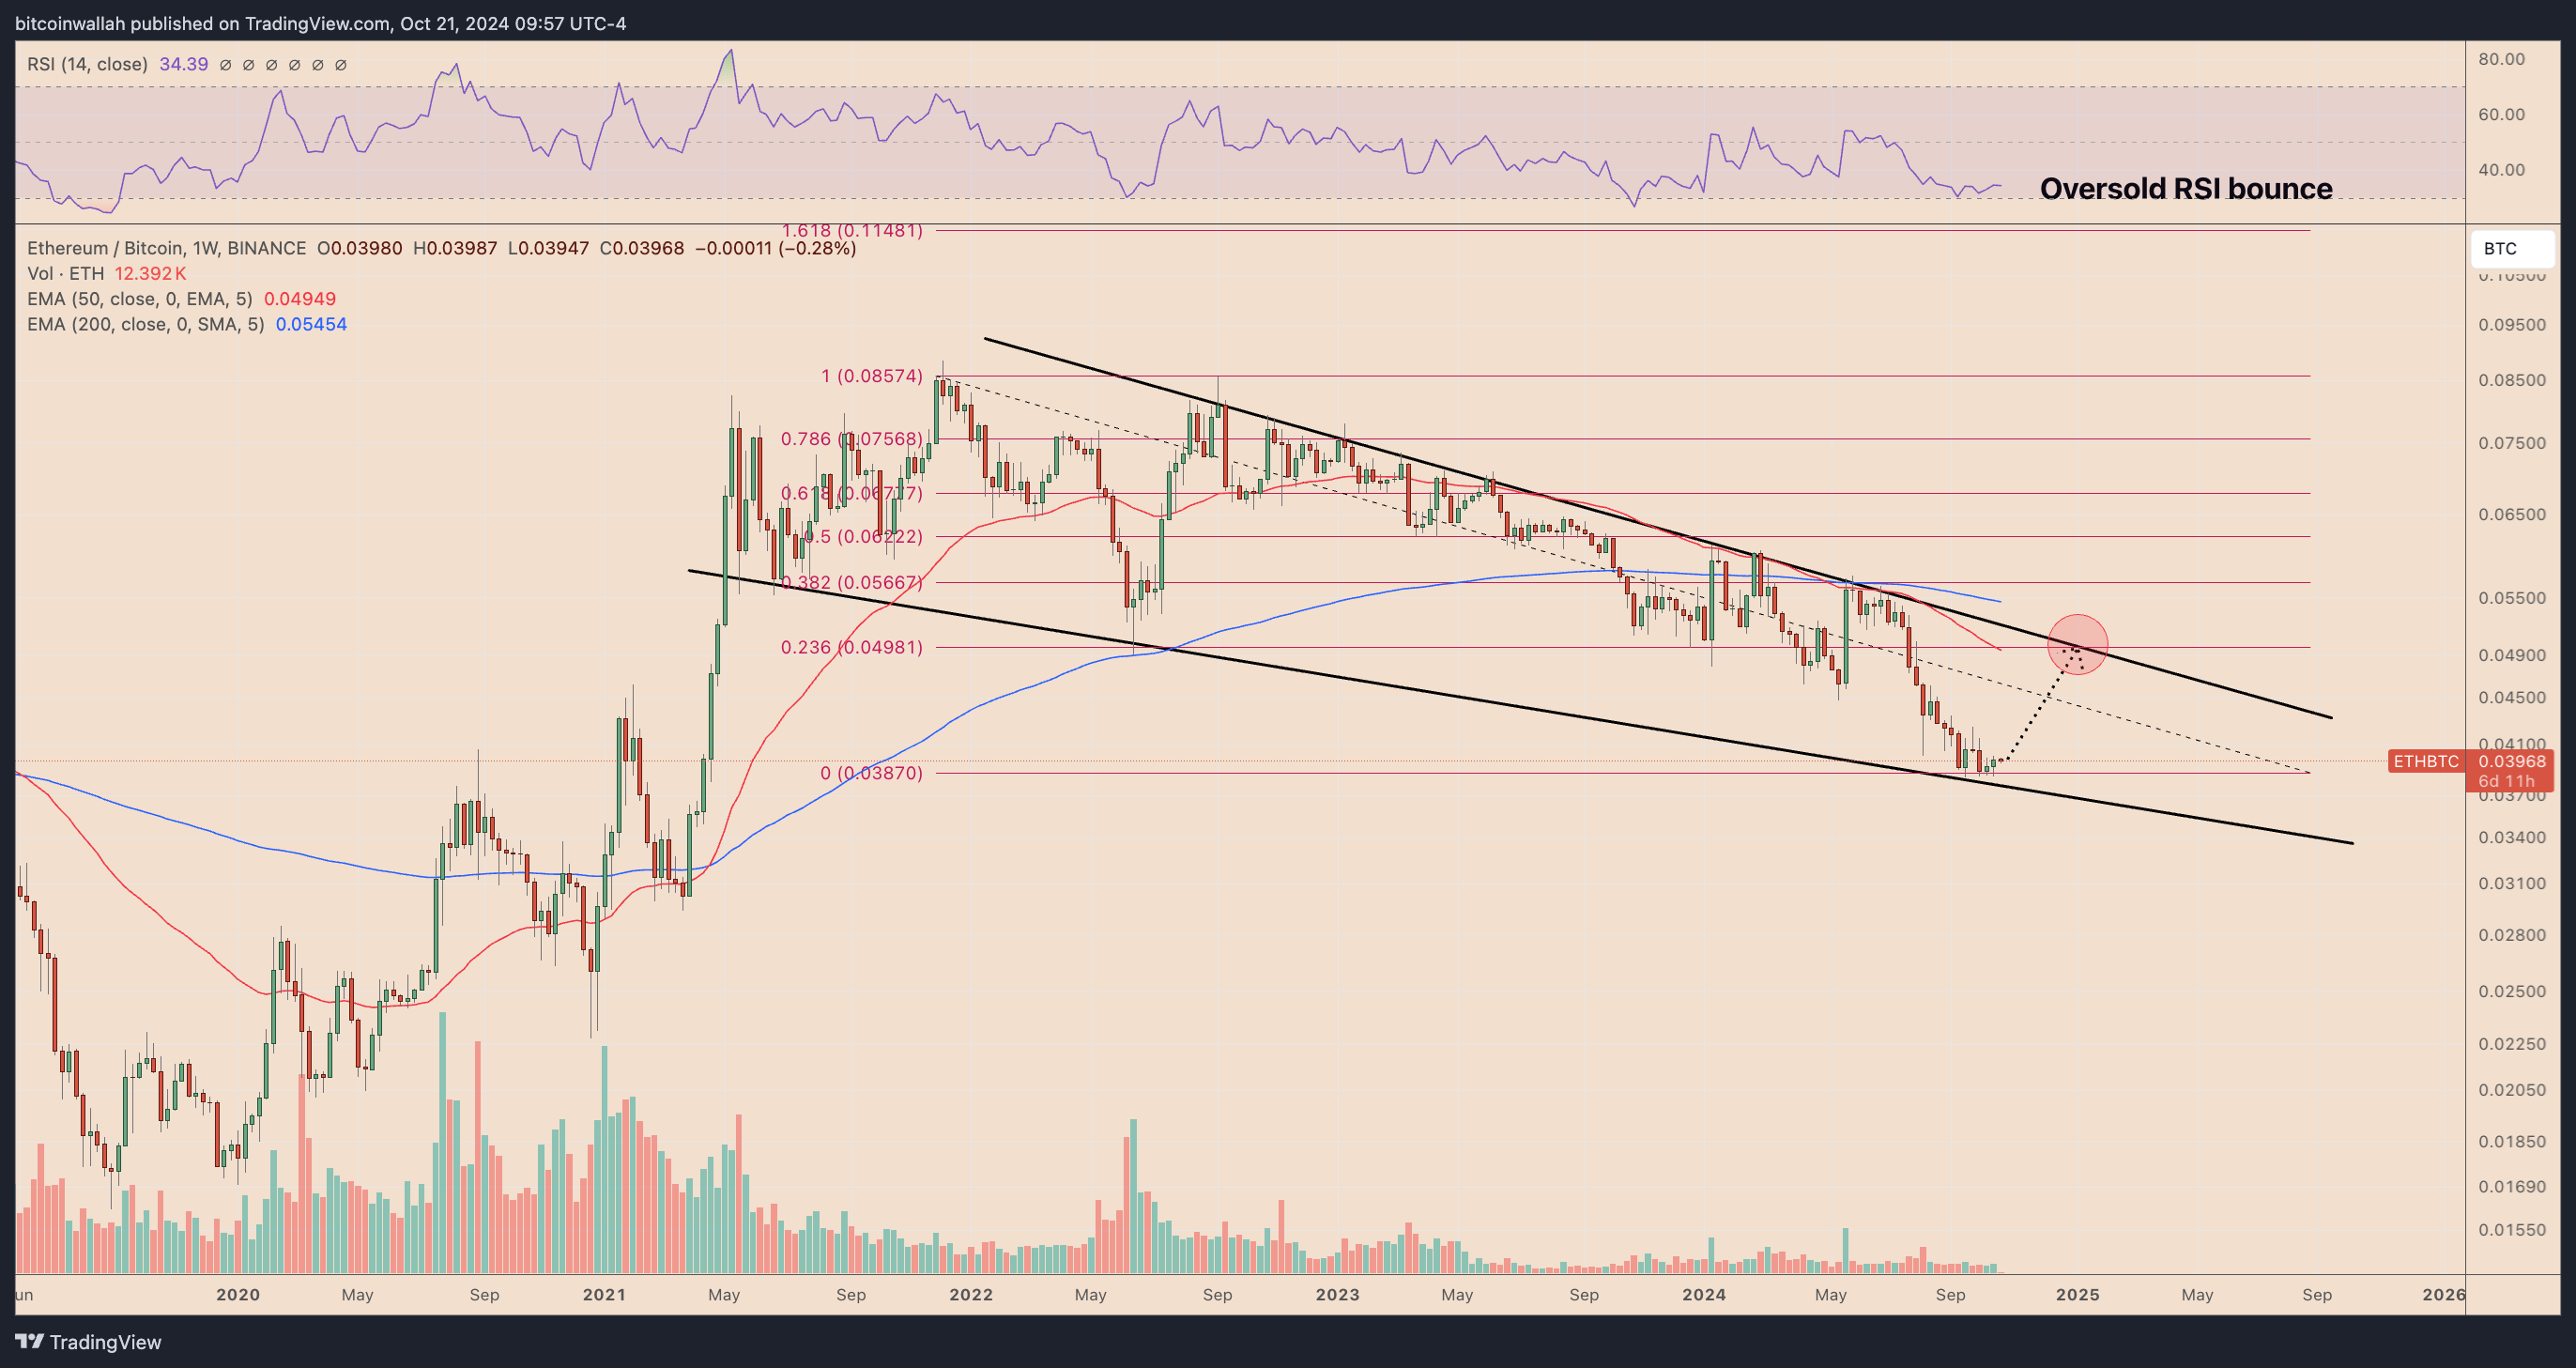
The immediate target is the upper wedge trendline near 0.0498 BTC, and a breakout above this level could set the stage for a prolonged rally toward 0.0857 BTC.
Ether’s upside outlook versus Bitcoin receives further cues from its weekly relative strength index (RSI) has bounced from the oversold region.